STX/USDT Weekly Outlook Golden Accumulation Zone
📌 Overview:
STX (Stacks) is currently retesting a crucial demand zone in the $0.63 – $0.72 range — the same area that previously served as the launchpad for a massive rally toward the $3.80 highs. This chart highlights a strategic opportunity for swing traders and long-term investors who understand market cycles.
🧠 Price Structure Insight:
A well-established demand zone (highlighted in yellow) has acted as a base of accumulation since late 2022 through mid-2023.
Price is now consolidating above this zone, suggesting a potential bullish reversal.
A potential Double Bottom pattern is forming, with a neckline around the $1.00 level — a breakout above this could spark a significant bullish impulse.
🟢 Bullish Scenario (Upside Potential):
If STX maintains support and bounces from this accumulation zone, we could see a stair-step rally toward the following targets:
1. $0.90 – $1.00 → Psychological resistance & neckline of reversal pattern
2. $1.2975 → Historical supply and consolidation area
3. $1.9447 → Previous lower-high resistance zone
4. $2.20 – $2.71 → Key Fibonacci retracement levels from prior highs
5. $3.66 – $3.84 → All-Time High resistance, long-term bull target
🔍 A confirmed weekly close above $1.00 would significantly strengthen the bullish thesis and validate the reversal structure.
🔴 Bearish Scenario (Downside Risk):
If price breaks down below $0.6380, this could invalidate the current structure and lead to deeper corrections, targeting:
$0.45 → Minor support from early 2023
$0.20 → Historical macro bottom and extreme support
❗ A breakdown below this accumulation zone could trigger a longer-term bearish continuation.
🔄 Strategic Trading Notes:
This is a high-probability reversal zone, ideal for gradual accumulation (DCA) or swing entries with tight stop losses below support.
Watch for a spike in volume as a signal for institutional or smart money involvement.
Confirmation from bullish candlesticks (e.g., bullish engulfing on weekly) could provide additional entry confidence.
📚 Conclusion:
STX is testing a key structural level that previously led to exponential price growth. As long as the $0.63–$0.72 zone holds, the mid-to-long-term bias remains bullish. However, traders should remain disciplined and responsive to any invalidation signals.
#STXUSDT #Stacks #CryptoAnalysis #AltcoinSetup #TechnicalBreakout #WeeklyChart #BullishReversal #AccumulationZone #SmartMoney
Stxusdtanalysis

STXUSDT 1W Analysis STX ~ 1W Analysis
#STX Buy back gradually from here with a short-term target of at least 20%++.

STXUSDT Potentially BullishWe saw BTCUSDT gain some momentum and this effect is being seen on many ALT coins. BINANCE:STXUSDT is no different!!! At the moment, STX is breaking out of a consolidation phase on the Daily TF. Will this breakout mean #STXUSDT is regaining its bullish momentum? That remains to be seen, However a close above the 0.78 will likely bring us into the bullish phase.
Until then, fingers crossed.
Do your analysis before taking any trade, results are not typical, past results does not guarantee future results

STXUSDT Potentially BullishBINANCE:STXUSDT is beginning to take shape and is looking good to go long. Broken the consolidation phase and retested it. The bulls are setting in however, we just might see the market slow down around the 1.152 area which turns out slightly below the EMA 200 and also aligns with a resistance point on the weekly TF. On futures trade, I will target this area while i will lock down some profits on my spot trading at this point.
This is not a trade advice as such do your due diligence
Past results does not guarantee future results

STX Bulls Beware: Is This the Calm Before a Massive Drop?Yello, Paradisers! Are you seeing what we’re seeing on STXUSDT? If not, now’s the time to pay attention—our recent predictions on bearish setups are starting to unfold again, and this one might catch many off guard. Let’s break it down.
💎Currently, STXUSDT is flashing some serious warning signs. We’re spotting a clear bearish Change of Character (CHoCH) in play, which is being reinforced by a Head and Shoulders pattern—a combination that significantly increases the probability of a downside move.
💎To make things worse for the bulls, there’s an unfilled Fair Value Gap (FVG) sitting just below the current price. This acts like a magnet and could drag the price downward as liquidity gets targeted.
💎However, if STXUSDT manages to bounce from current levels, we’ll be closely watching the Order Block (OB) and Fibonacci Golden Zone as potential entry points. These could offer an excellent risk-to-reward (RR) setup if the bearish scenario gets temporarily rejected.
💎But here’s the key invalidation point: if price breaks and closes above the OB zone, the entire bearish thesis falls apart. In that case, we’ll step aside and wait for stronger confirmation before jumping back in. No need to rush—better opportunities always come with clear setups.
🎖Trade smart, Paradisers. The market doesn't care about your bias—it rewards only patience, precision, and discipline. Stick to your trading plan, and don’t let FOMO or fear drive your decisions.
MyCryptoParadise
iFeel the success🌴

STXUSDT 1WSTX ~ 1W Analysis
#STX Buy gradually from here if you still have a Conviction on this coin with a short -term target of at least 20%+.

Is STXUSDT Setting Up for a Big Move? Don’t Miss These Key LevelYello, Paradisers! Is STXUSDT quietly building momentum for a major breakout? Let’s dive into the current market structure to see if we’re on the verge of a bullish opportunity — or if caution is the smarter play.
💎STXUSDT is showing bullish I-CHoCH (Internal Change of Character) and BOS (Break of Structure) on higher timeframes — a good sign that buyers are gaining control. The current retracement adds more weight to this setup, making it an attractive opportunity if we see further confirmation on lower timeframes.
💎The double-bottom pattern forming is another bullish signal. However, instead of jumping in early, it’s smarter to wait for a bullish I-CHoCH confirmation on lower timeframes to increase the probability of success.
💎If we get a deeper retracement or sudden panic selling, our focus will shift to the strong support zone below. This is where we expect a bounce, and once again, we’ll be watching for bullish I-CHoCH on lower timeframes to confirm the reversal.
💎If STXUSDT respects that support, we’re in a good position. But...
💎If the price breaks down and closes a candle below the strong support zone, that will invalidate the entire bullish idea. In that case, we step back and wait for better price action to form. No need to rush — the market will always give more opportunities if you stay patient and disciplined.
Play It Smart, Paradisers! At this point, it’s all about waiting for confirmation and avoiding emotional trades. The crypto market loves to punish impatience, but the disciplined traders always win in the end.
MyCryptoParadise
iFeel the success🌴

STXUSDT 1WSTX ~ 1W
#STX if you still have Conviction on the coin,. This support block would be a very good buying place for now,. Target at least 20%+ from here.

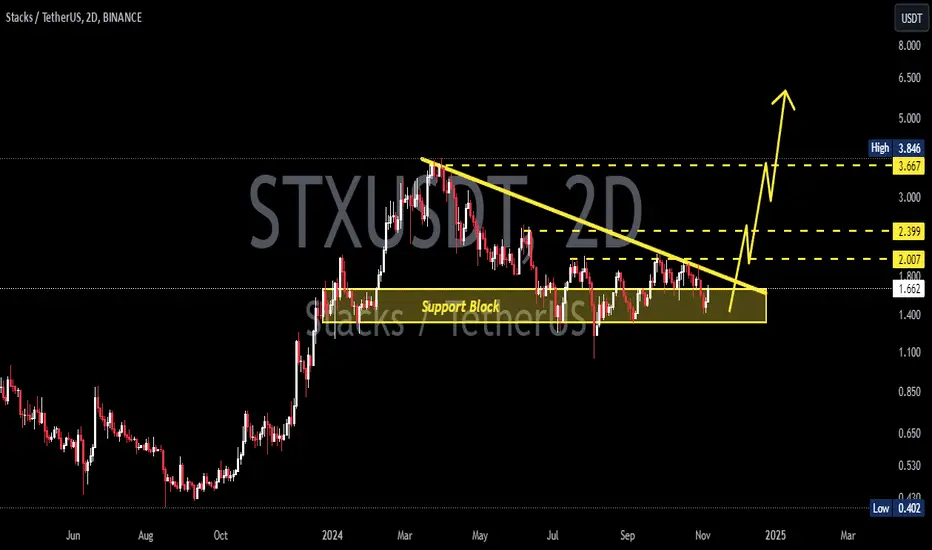
STXUSDTSTX ~ 2D
#STX So far it continues to maintain this support Block. Buy gradually on this support block,. with a minimum target of 15%++. If you have Conviction on this coin.
STXUSDT Triangle BreakoutSTXUSDT technical analysis update
STX is breaking the symmetrical triangle resistance with high volume, and the price is trading above the 100 EMA on the daily chart. This is considered a strong bullish signal for STX.
Buy zone: Below $1.75
Stop loss: $1.55
Regards
Hexa

STXUSDT 2DSTX ~ 2D
#STX Best strategy for COINBASE:STXUSD , Buy on breaking out of this descending pattern, or buy in the demand zone.

STXUSDT: Previous Resistance Acting as Strong SupportSTX technical analysis update
STX's price is bouncing from its major support level, with the previous resistance now acting as strong support. Above this support zone, the price has formed a descending channel and is currently trading within it. The price is now moving toward the channel resistance, potentially setting up for a breakout.
Regards
Hexa

STX Potentially BullishNASDAQ:STX is still attempting to reclaim the bullish momentum and so far, the 1.760 zone (Previous Resistance now turned support) seems to be holding. A further bullish push just might lead the start of another bullish push.
This does not completely rule out the possibility of another dip in the market. As long as the now found support holds, the bulls will take the lead otherwise, the bears will dominate. I will keep an eye on this closely. Expect updates on #STX as market reveals itself more.

STXUSDT 1DSTX ~ 1D
#STX Make purchases gradually in this pattern. it is only a matter of time until this pattern is successfully broken and the bulls will dominate again.

Could STXUSDT Be on the Verge of a Major Rebound? Yello, Paradisers! Is #STXUSDT about to make a dramatic move? Let’s dive into the analysis to see what’s happening.
💎Currently, #STX is lying on a strong support zone. The probability of a rebound from here is high if the daily candle closes with a bullish rejection. Should this occur, the price is likely to reverse upward, testing the supply zone around 1.8 and the descending resistance area.
💎If STX successfully breaks out of the descending resistance, it could indicate a strong momentum shift. This breakout might also lead to a breach of the supply zone. A successful break above the supply zone would confirm a bullish reversal, with a high probability of the price reaching our target at the strong resistance area.
💎However, if STX fails to break the descending resistance or fails to rebound from the support, we could see a move towards the order block (OB) area. The OB area is crucial as it likely contains large orders that could lead to a significant rebound. For the price to continue its upward movement, reclaiming the support zone is necessary.
💎Conversely, if STX breaks below the OB area and the daily candle closes beneath it, this would confirm a bullish invalidation, signaling a continuation of the bearish trend and a potential further dip.
Stay vigilant, traders, and remember that discipline and patience are key to navigating these market moves successfully.
MyCryptoParadise
iFeel the success🌴

STX Potentially BullishWe have seen over time how the crypto market has created some lows. Are we going to be seeing some bullish push ahead of the crypto convention next month? On the TA side, market is looking like it is ready to make another push upward, however I will want to see some bullish move to confirm that the retest is completed on the H4 TF.
Until then, fingers crossed.
Long term, I'm going long

STXUSD 1DSTX ~ 1D
#STX In the event of a retest of this pattern's support line, This is a very good buy. with a minimum target of 15%+

STXUSDT Trade SetupThis coin is trying it level best to breakout on shorter Time Frame, if that resistance market as daily res is broken, it should fly higher than expectation.
Confluences:
1. Daily/Weekly Falling Wedge Breakout.
2. Lying on daily demand zone.
Thanks me later. Do not miss this before bull run starts.

STX Analysis: Eyeing Bullish ReversalKey Levels:
Support Level:
1.92 USDT (marked on the chart)
1.56 USDT (next major support below)
Resistance Level:
2.15 USDT (immediate resistance marked on the chart)
2.38 USDT (secondary resistance above)
3.10 USDT (projected upper target)
Current Trend:
The price is currently in a downward channel, indicated by the trend lines converging downwards.
There has been a consistent lower high and lower low pattern, characteristic of a downtrend.
Technical Indicators:
Stochastic RSI:
The Stochastic RSI is currently around 53.10, which is in the neutral zone but close to being oversold. This could suggest a potential for a reversal if it moves further down into the oversold territory (below 20).
Volume:
The volume shows some green bars, indicating buying interest at lower levels, which could support a potential reversal or bounce from current levels.
Potential Scenarios:
Bullish Scenario:
First Target: The price may attempt to break the immediate resistance at 2.15 USDT.
Next Target: If it successfully breaks above 2.15 USDT, the next resistance level to watch is 2.38 USDT.
Upper Target: A significant bullish move could see the price reaching up to 3.10 USDT, as indicated on the chart.
Bearish Scenario:
Immediate Support: The price might retest the support level at 1.92 USDT.
Next Support: If the 1.92 USDT level fails to hold, the next support is at 1.56 USDT.
Trading Strategy:
Long Position : Consider entering a long position if the price shows a strong reversal signal from the support level at 1.92 USDT, with a stop loss just below the support.
Short Position : Consider shorting if the price breaks below 1.92 USDT, targeting the next support at 1.56 USDT, with a stop loss just above 1.92 USDT.

STXUSDT BINANCE:STXUSDT has done well over time and at the moment we are seeing it back at a key level @2.0600. If this level holds, we just might see some new highs. Until then, fingers crossed!!!

NTX/USDT Favorable Entry Opportunity at Key Support & TrendlineKey Support and Trendline Confluence:
NTX/USDT currently finds itself situated at a critical support juncture, coinciding with the 4-hour trendline. This confluence underscores a pivotal area for potential market reversal or continuation.
Bullish Confirmation Entry
Traders eyeing long positions may consider entering upon bullish confirmation at the retest of this support zone. A prudent entry point lies near 2.9500, strategically positioned to capture potential upward momentum while managing risk effectively.
Risk Management Parameters
To safeguard against adverse price movements, it is advisable to implement a stop loss order in close proximity to the entry point. A stop loss set around 2.4360 serves to mitigate downside risk while allowing ample room for market fluctuations.
Profit Targets
Profit-taking levels should be established to capitalize on upward price potential. The first profit target (TP-1) is set at 3.4845, representing a significant area of resistance where partial positions may be exited. For those aiming for further gains, TP-2 is identified at 3.9390, reflecting a higher resistance zone.
Conclusion
In conclusion, NTX/USDT exhibits favorable conditions for a potential bullish reversal, with the confluence of key support and trendline providing a compelling entry opportunity. Diligent adherence to risk management principles and profit-taking strategies is paramount to successful trading execution.

STXUSDT Buying the dipBINANCE:STXUSDT showing some buying potential. We have seen some continued rejections; I will take a long position if price holds above the support area at 1.4495 to target the 2.000 mark.
#STXUSDT still looks ultimately bullish from my perspective

STXUSDT Buying the DipBINANCE:STXUSDT has done relatively well in the last few weeks and it is my opinion that STX still has some potential to move further. I am buying the dip at 2.8858
Do your due diligence and do not assume.
Thanks
