someone's BTFD on sugarsugar is either broken or you better buy all you can right now
weekly volume exceeds all volume for the past two years, and it's only the first day of the week wtf
pretty confirmed here imo
Sugar


ICEUS SUGAR : The fifth wave is performing in diagonal triangle
The fifth wave is performing in diagonal triangle.After the completion of wave 5,
the market is expected to make a significant rally.


Long Sugar at support levelsIs time to put in watchlist Sugar.
We are close to the main supports so we have two levels to place a buy. I think the better level should be 10 but the upper one is still attractive.

Sugar long preferedA Bigger Price range is obvious and we are just sitting on the bottom right on the support zone which could offer a nice long entry after a certain price action signals .
Something like a break n close through a h4 flip zone here would give me confidence and confirmation to enter a long position .
A break of the 200 ma would also be a nice sign for me that we see some action in direction north.

Sell Sugar. 40% move opportunity1. Sugar seems to be completing 4th wave of the down move.
2. 4th wave has (slightly running) flat structure.
3. It looks on the chart and in particular on MACD that last 4-5 weeks it is incapable to move significantly up from the bottom of the range. It seems ready to break down.
4. Previous month volume spike on big red candle also supports the idea of selling sugar.
5. 5th wave target should be about 0.61 of 1-3 waves move calculated from the top of wave, therefore it is about $0.082, ie it is ~40% move.


DHAMPUR SUGAR UPSIDE :) NSE:DHAMPURSUG RSI reversal possible, the price is about to touch the support. A bullish candle will confirm the uptrend.
Disclaimer: Consult your financial advisor before investing.

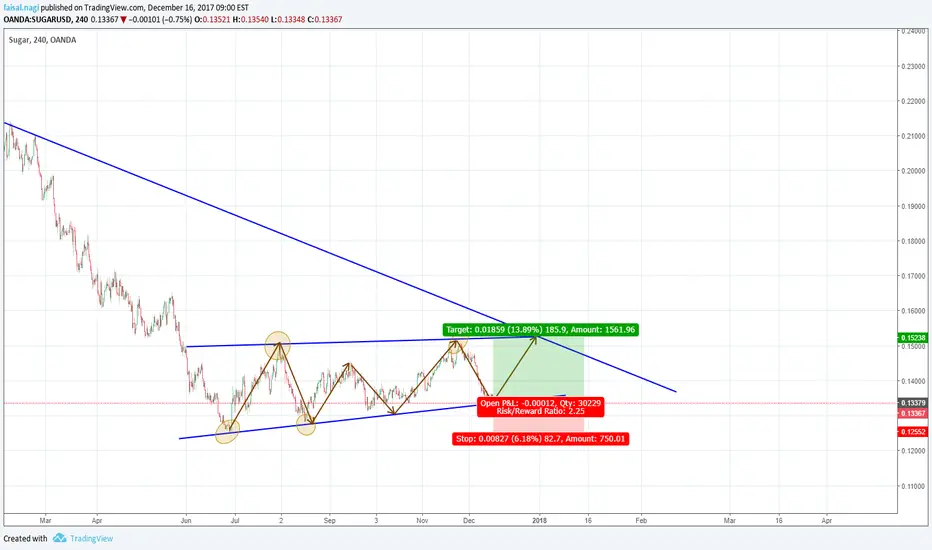
Sugar price to hit 0.153 in the next days, mid-run looks bearishAlthough in the next days the price increase can continue up to 0.1536 level, the gray support line does not look strong enough, which means 0.1133 can be seen in the mid-run, the price can hit its long run support level.

SUGAR / USD 4HThis trade will be active on monday morning ,,,
More update will follow ,,,
Good Luck All ,,,
SUGAR. Flat correction. Wait to short after it finishes.Sugar is in a long running flat correction.
The wave Y could reach out to the 0.1580 area (where Y=W) before it drops. It could also exceed it with further Fibonacci ratios 1.27-1.618.
Wait for reversal pattern at the top.

Sugar - TradeI love Sugar.... I love the Dividends.
RSI had a good run, benefited from low energy costs.
I am taking profit to keep cash on the side-line for the inevitable mrkt correction.
I will re-enter below 5.65 if the fundamentals stay solid.
On Balance Volume is weakening, this could be an indicator that investors are switching to cash or trading to high flying stocks.
Ichimoku 3/5 bear
23-Nov-17 6.23 Bear Chikou Span Cross Strong
" " Bear Kijun Sen Cross Neutral
" " Bear Kumo Breakout
21-Nov-17 6.50 Bull Senkou Span Cross Neutral
" " Bull Tenkan/Kijun Cross Weak


Sugar Futures Short?! To be or not to be?My current expectations are short in futures sugar.
- level 14
- 4 month consolidation
Target 12.85 - 13 (second monthly support S2)

Possible Scenarios for SugarAs you know, it was following a bearish channel, but consider the daily resistance line around 0.127, and the lower bullish trend line who prevented more fall of price for three times, & bad fundamental news from Brazil & India, I guess I`ll buy sugar soon-possibly after breaking the upper line of channel while moving averages confirm all this too (hopefully :). But if this won`t happen, we`ll have much more fall & maybe even the lower line of channel breaks (so dramatic!) heading for the other partial trend line. For now, we`ll wait, but if you`re love with setting up positions, set an approximate buy stop over the channel!

Has Sugar Bottomed?I just wanted to take a moment to share this bit of insight. I'll try my best to be brief in my analysis.
What you see is a continuous chart of Sugar futures. In my opinion, I'm thinking that there is a reversal in trend that is about to take place and here's why.
The first thing that you may see is the downward slopping trend channel which began in October of last year which depicted a clear bear market. In late June of this year, prices broke through the bottom of the channel and created what I consider to be an obvious selling climax. Preceding the climactic selloff was a shortening of downward thrust, which showed stopping action in the market's selling. Since then, prices have moved sideways, creating a base. One thing that stands out about this base is the fact that the supports continue to rise, which is an indication that bulls are buying at higher levels each time the price falls. As I type this, prices are at the top of the range. Does this mean that there will be a breakout? I wouldn't go that far. After all, there was a false breakout on July 31st, which was checked at the overhead resistance area of the April '17 low.
Another case for a bullish reversal, going back to the selling climax, is that the wave volume shows continuous increases in volume in the buying waves. Such action indicates that demand is overcoming supply. Something to note is how prices are pulling away from the bottom of the channel as it forms what may be an accumulative base.
Conclusion: I'm gonna have to see a strong close above not only the top of the accumulative base but also above the April '17 swing low. Such action will be a signal to get long following a pullback to test the breakout area. On another note, I find it interesting that Sugar, or any commodity for that matter, is setting up for a potential move to the upside as the U.S. Dollar is about to make a strong move to the upside as well. A strong dollar is usually bearish for commodities, but hey, we can only listen to what the charts tell us, right?

Sugar at its lowsDear mgrzegorzak,
Thanks for your little request and sorry for late reply.
Here is our analysis about sugar. For rising prices in Sugar indicates the following aspects:
increasing trend line
CoT report of the Non Commercials
Seasonlality
current support at 13,70
