Sugar and FCOJ Take the Bullish BatonThe soft commodities sector of the commodity market can be highly volatile. Historically, sugar, coffee, cotton, cocoa, and frozen concentrated orange juice futures that trade on the Intercontinental Exchange have doubled, tripled, and halved in value over short periods. While clothing and other consumer goods depend on the cotton market, the other sector members are foods.
The soft commodity sector rose in 2021, and Q1 2022
Coffee and cotton rose to multi-year highs in 2022
FCOJ takes off on the upside in April and makes a new multi-year high
Sugar could be next for three reasons
Trading softs from the long side- Buy those dips
Brazil is the world’s leading producer and exporter of three of the soft commodities; sugar, coffee, and oranges. Sugar comes from two sources, sugar beets and sugarcane. Brazil’s tropical climate makes it the leading sugarcane producer. Arabica coffee beans are popular in the US and other areas, while Robusta beans produce espresso coffees. Brazil leads the world in Arabica production. While many people associate orange production with Florida and California, Brazil is the world’s top orange producer. Cocoa, the primary ingredient in chocolate confectionery products, comes mainly from West Africa, as the Ivory Coast and Ghana produce over 60% of the world’s annual supplies.
Soft commodities are agricultural products, so the weather in growing areas typically determines the prices each year. Since the 2020 pandemic, the price action has been anything but ordinary.
The two latest soft commodities to lead the sector on the upside have been sugar and FCOJ futures.
The soft commodity sector rose in 2021, and Q1 2022
In 2021, the composite of the five soft commodities that trade in the futures markets on the Intercontinental Exchange rose 31.57%. In Q1 2022, the softs added to gains, rising 6.58%, with all five members posting gains.
Cotton futures led the softs higher with a 20.51% gain. Cocoa futures moved 5.16% to the upside, with FCOJ posting a 3.86% gain. Sugar rallied 3.23%, and Arabica coffee futures eked out a 0.13% gain.
Meanwhile, coffee and cotton rose to new multi-year highs during the first three months of 2022.
Coffee and cotton rose to multi-year highs in 2022
In June 2020, coffee futures made a higher low under the $1 per pound level before taking off on the upside.
The weekly chart shows the bullish trend of higher lows and higher highs that took coffee futures to $2.6045 per pound in early February 2022. Coffee futures rose to the highest price since 2011.
Cotton futures also rose to the highest level since 2011, peaking at the $1.4614 per pound level in April 2022.
Coffee futures were over the $2.20 level, with cotton above $1.40 on April 14.
FCOJ takes off on the upside in April and makes a new multi-year high
Frozen concentrated orange juice futures are the least liquid of the five soft commodities, based on daily volume and open interest metrics. While the FCOJ futures arena rose to a new multi-year high in Q1 2022, the bullish price action continued in April with higher highs.
The chart shows that nearby FCOJ futures rose to $1.8660 per pound last week, the highest level since March 2017. The all-time high in the orange juice market came in 2016 at $2.35 per pound.
Brazil is the leading producer and exporter of oranges and Arabica coffee beans. The South American country also is the leader in free-market sugarcane production and exports.
Sugar could be next for three reasons
Sugar futures rose to 20.69 cents per pound in November 2021, the highest price since February 2017.
The weekly chart shows that sugar futures were above the 20 cents per pound level last week. Sugar is approaching the first technical resistance level at the November 2021 20.69 cents high. Above there, the next target is at the October 2016 23.90 high, which is a technical gateway to the 2011 36.08 cents per pound peak.
Three factors support sugar prices in April 2022:
Rising inflation is lifting all commodity prices, and the trend is always your best friend in markets across all asset classes.
Rising crude oil and natural gas prices support sugar. Crude oil is over the $100 per barrel level, and natural gas stopped just short of $7 per MMBtu last week. Multi-year highs in the energy market support sugar as it is the primary input in Brazilian ethanol production. As more sugarcane goes into ethanol production, less is available for exports.
Sugarcane production costs are increasing as they are labor-intensive. The rising Brazilian real makes sugar more expensive to produce.
The chart illustrates the technical breakout to the upside in the Brazilian currency against the US dollar. A higher real increases the cost of production, putting upside pressure on sugar’s price.
Trading softs from the long side- Buy those dips
Stocks and bonds have been shaky in 2022, and cryptocurrencies have not yet of the slump that took prices lower since the November 2021 highs. Commodities have been the place to be for investors and traders over the first four months of 2022. The latest inflation report will likely keep the bullish party in raw material markets going.
I remain bullish on soft commodities as they are highly volatile and can offer explosive returns. Sugar is my top choice as of April 15, as the sweet commodity loosed poised to eclipse the 2021 high on its way to higher ground. Meanwhile, I favor all soft commodities in the current environment. The optimal approach to the sector has been buying on price weakness, and I expect that to continue. Bull markets rarely move in straight lines, and corrections can be the best route to optimizing returns over the coming weeks and months.
--
Trading advice given in this communication, if any, is based on information taken from trades and statistical services and other sources that we believe are reliable. The author does not guarantee that such information is accurate or complete and it should not be relied upon as such. Trading advice reflects the author’s good faith judgment at a specific time and is subject to change without notice. There is no guarantee that the advice the author provides will result in profitable trades. There is risk of loss in all futures and options trading. Any investment involves substantial risks, including, but not limited to, pricing volatility, inadequate liquidity, and the potential complete loss of principal. This article does not in any way constitute an offer or solicitation of an offer to buy or sell any investment, security, or commodity discussed herein, or any security in any jurisdiction in which such an offer would be unlawful under the securities laws of such jurisdiction.
Sugar

EXTREMELY BULLISH SUGAR Sugar has no place to go but up. Look at my golden lines, replicate them on your chart and go to the monthly timeframe. Look left and see the beauty of multi timeframe analysis.
Anyways, we don't control the market but I remain bullish till the market says otherwise.
What's your own view on sugar???

FOOD CRISIS bad for stocks?There has been a lot of talk since the Ukraine - Russia war started that the rising prices in the agricultural sector will cause a new Bear Cycle in the stock market. Commodities have been rising across the globe as a result of an inflation build up in recent years, accelerated by the COVID pandemic, but with agriculturals in particular, the story is a little different.
This chart illustrates Corn (blue trend-line), Sugar (orange), Soybeans (teal), Oats (black) and in the pane below them is the S&P500 index (green trend-line). As you see, even though price rallies on the agriculturals have caused minor (from a long-term perspective) pull-backs on S&P (as they did in February/ March), they only coincided with a Bear Cycle in the 2007/08 Bear Cycle, which of course was caused by the subprime mortgages.
So the conclusion we can draw is that global indices' reaction in February/ March with a strong pull-back, was very natural based on the long-term historic action. A Bear Cycle has to have a strongest macro-economic catalyst, strong enough to affect the fundamental structures of the capitalistic/ monetary system that supports the stock markets.
--------------------------------------------------------------------------------------------------------
Please like, subscribe and share your ideas and charts with the community!
--------------------------------------------------------------------------------------------------------

Sugar Long - SBK22Buy Signal
Entry - 19.06
TP#1 - 19.86
TP#2 - 20.23
SL - 18.44
**Trading commodity futures and options involves substantial risk of loss.
The recommendations contained in this letter is of opinion only and
does not guarantee any profits. These are risky markets and only
risk capital should be used. Past performance is not indicative of future results**

Sugar Futures (SB1! ), H1 Potential for Bearish DipType : Bearish Reversal
Resistance: 20.69
Pivot: 20.41
Support : 19.86
Preferred case: We see the potential for a bearish dip from our pivot at 20.41 in line with 138.2% Fibonacci extension towards our 1st support at 19.86 in line with 38.2% Fibonacci retracement and 78.6% Fibonacci projection. Our bearish bias is supported by stochastic indicator where price is trading near resistance level.
Alternative scenario: Alternatively, price may break our pivot structure and head for 1st resistance at 20.69 in line with 161.8% Fibonacci extension.
Fundamentals: No major news

Sugar Futures ( SB1! ), H1 Potential for Bearish DipType : Bearish Dip
Resistance: 20.69
Pivot: 20.36
Support :19.86
Preferred case: We see the potential for a bearish dip from our pivot at 20.36 in line with Fibonacci extension towards our 1st support at 19.86 in line with 38.2% Fibonacci retracement and 78.6% Fibonacci projection. Our bearish bias is supported by the stochastic indicator where price is trading at resistance level.
Alternative scenario: Alternatively, price may break our pivot structure and head for 1st resistance at 20.69 in line with 161.8% Fibonacci extension.
Fundamentals: No major news


Long on sugarLook for this to move higher shortly or will it correct some more? I think we have another wave (V) up to complete this wave. But there is some bearish divergence building up on the RSI
So I think there is another corrective wave (C) down to form a running or expanding flat

Long on sugar, small correction then upSitting through a small correction on Sugar (hopefully) this may go down to the upper medium line to hit support and then start a Wave V to the upside to target the outer warning line of the pitchfork. This is inline with a previous high which may form resistance.

Sugar update - 03/04/2022remaining higher than 18.657 will reinforce the idea of wave 3 that target higher than 22, critical support at 17.746

Sugar Futures (SBK2022), H1 Potential Bearish DipType: Bearish Dip
Resistance : 19.89
Pivot: 19.63
Support : 19.05
Preferred case: Price is approaching our pivot level of 19.63 in line with 78.6% Fibonacci retracement. We see the potential for a bearish dip towards our 1st support level of 19.05 in line with 50% Fibonacci retracement. Our bearish bias is further supported by the stochastic indicator where price is trading at the resistance level.
Alternative scenario: Otherwise, price could potentially rise to the 1st resistance level at 19.89 which is in line with 161.8% Fibonacci extension..
Fundamentals: No major news.

SUGARUSD (2022 March 8th Trend Line)After the retest of the Trend Line, Enter a Long Position at the closing price of the retest candlestick at 0.19536. Next, place the stop loss beneath EMA 20 Close Price 0.19441. Set Take Profit at 0.19916 and 0.20072.

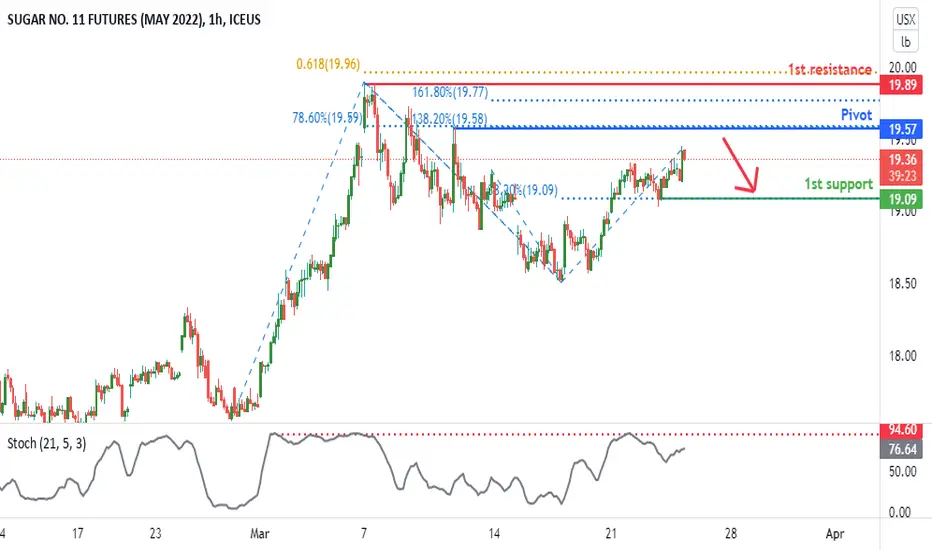
Sugar Futures (SBK2022), H1 Potential Bearish ReversalType: Bearish Reversal
Resistance : 19.89
Pivot: 19.57
Support : 19.09
Preferred case: Price is approaching our pivot level of 19.57 in line with 138.2% Fibonacci extension and 78.6% Fibonacci retracement. We see the potential for a bearish reversal towards our 1st support level of 19.09 in line with 38.2% Fibonacci retracement. Our bearish bias is further supported by the stochastic indicator where price is trading at the resistance level.
Alternative scenario: Otherwise, price could potentially go to the 1st resistance level at 19.89 which is in line with 161.8% Fibonacci extension and 61.8% Fibonacci projection.
Fundamentals: No major news.
Sugar Futures (SBK2022), H4 Bullish BounceType : Bullish Bounce
Resistance : 19.88
Pivot: 19.01
Support : 18.56
Preferred case: Price is near the pivot level of 19.01 in line with 38.2% Fibonacci retracement and overlap support. We expect price to move towards 1st resistance level of 19.88 in line with 61.8% Fibonacci projection, along with a swing high resistance. Our bullish bias is supported by price trading above the Ichimoku cloud indicator.
Alternative scenario: Price may break our pivot structure and head for 1st support at 18.56 in line with 61.8% Fibonacci projection.
Fundamentals: No Major News.

SUGAR RAW LONG - Buy Entry - D1 ChartSUGAR RAW LONG - Buy Entry - D1 Chart
Buy @ Market
Symbol: SUGAR RAW
Timeframe: D1
Type: BUY
Entry Price: Buy @ Market
TP - Resistance @ 20.28
TP - Resistance @ 19.47
Support @ 18.53
Support @ 18.68
✅ If you liked this analysis, please consider Following and giving it a Thumbs Up 👍
✅ If you have any feedback or questions, please leave a comment below as I answer each comment.
✅ Wishing you enjoyable successful trading 🙏

SUGAR WHITE LONG - Buy Entry - D1 ChartSUGAR WHITE LONG - Buy Entry - D1 Chart
Buy @ Market
Symbol: SUGARWHITE
Timeframe: D1
Type: BUY
Entry Price: Buy @ Market
TP - Resistance @ 563.95
TP - Resistance @ 586.58
Support @ 524.68
Support @ 528.00
✅ If you liked this analysis, please consider Following and giving it a Thumbs Up 👍
✅ If you have any feedback or questions, please leave a comment below as I answer each comment.
✅ Wishing you enjoyable successful trading 🙏

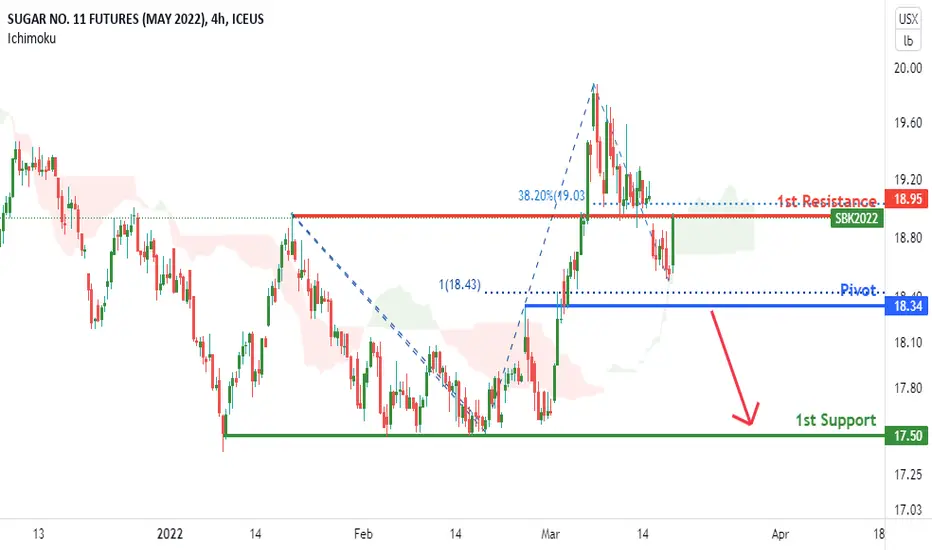
Sugar Futures (SBK2022), H4 Bearish ContinuationType : Bearish Continuation
Resistance : 18.95
Pivot: 18.34
Support : 17.50
Preferred case: Price is near the pivot level of 18.34 in line with a 100% Fibonacci projection. We expect price to move towards 1st support level of 17.50 in line with a graphical swing low support. Our bearish bias is supported by price trading under Ichimoku cloud indicator.
Alternative scenario: Price may break our pivot structure and head for 1st resistance level at 17.50 in line with 38.2%.
Fundamentals: No major news.
Balrampur chini is getting more sweeterBalrampur chini is giving range consolidation breakout.
Can see 550 in coming days
Weak below 450

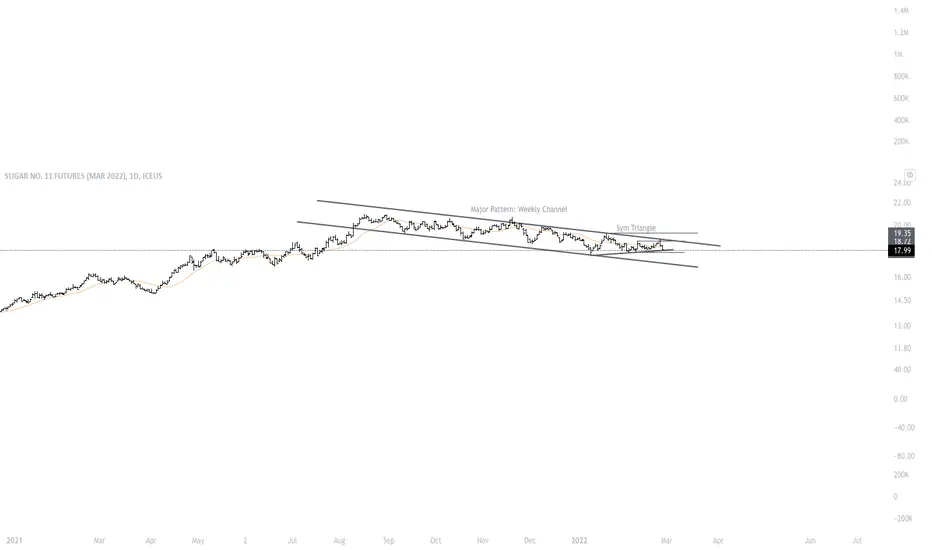
Sugar: Symmetrical TriangleMajor Pattern: Weekly Descending Channel
A symmetrical Triangle on Daily Chart could confirm an up or down continuation
Trigger Points: 18.68 or 18.14
The FED Roach InfestationMoney supply expansion is like roaches. It goes everywhere you don't want, and nobody can control it.
Plotted here is the money supply to futures ratio of soy, wheat, corn, and sugar. We have the potential to see a massive increase in food speculation, simply because it's not risky. When equities burst, the money goes anywhere it can. So we should expect a breakout here unless the fake money kicks back into gear.

SB1! (SUGAR) BULLISHSB1! (SUGAR) is bullish. We are going for the Intermediate 5th of Primary C of the cycle be. For now, the target area is roughly $23.43 to $$24.80 which is 50% and 61.8% of fibo. This is the commodity market and in a commodity market, the 5th wave can be extended. For now invalidation level is $17.60 which is the 4th wave for now.
DISCLOSURE - Please be informed that the information I provide is not a trading recommendation or investment advice. All of my work is for educational purposes only. All labeling and wave count have been done by me manually and I will keep changing according to the LIVE MARKET PRICE ACTION. So don't bias, hope on my trade plans. Try to learn Elliott Wave or other strategies and make your own strategy. Following is not that much easy. I am not responsible for any losses if u took the trade according to my trade plans.
#SB1! #SUGAR

Shorted SugarShorted some sugar, based one previous resistance and top of rising wedge, will keep SL tight. Look for retest of lows as indicated
* Prices shown in this chart is based on OANDA, price might differ from the product traded and brokers. However the underlying principles are the same
