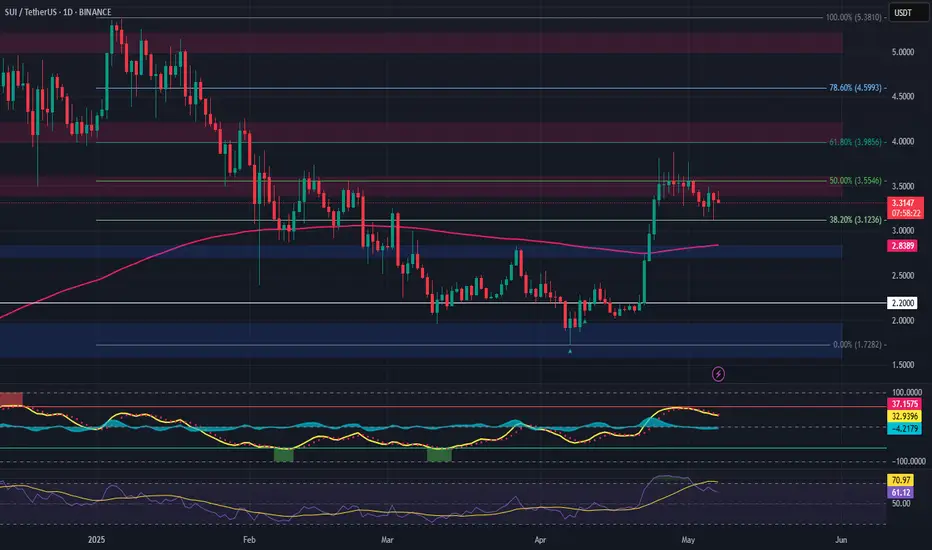
Sui: Your Altcoin ChoiceThe action is happening right above 0.786 Fib. retracement level support. Above it, the actual level wasn't hit and this is a signal of strength.
I looked at this chart when the action was happening above 0.618 and mentioned that it could drop further before the start of the next bullish wave. See what happened, as soon as the next support gets challenged, volume goes up. This is significant volume in comparison with the daily average. The highest volume since November 2024.
This volume signal can be easily translated as support found. Support found means that the down-move is no more. The down-move being over invariably leads to change. Change means the market won't be dropping no more. If it was going down, soon, SUIUSDT should start to grow. That's my conclusion based on the data coming from the chart.
Even if prices move a bit lower, the bullish bias still remains. There is an ending diagonal on the chart. This pattern tends to show up before a change of trend. The correction is over. It is only a matter of time before the next bullish wave.
Thanks a lot for your amazing and continued support. It is truly appreciated.
It is not possible to project an accurate ATH for this pair because the chart is too young. Relevant numbers for 2025 are $9.42 and $15.24.
Namaste.
SUI

SUI Going to 4.80?Hi everyone
Here is my weekly analysis on SUI, it appears we are heading to 4.80-5.20 levels before we see another correction, lets see how we go
Kris/Mindbloome Exchange
Trade Smarter Live Better

U scared, I'm eyeing $100k by May.What beautiful price action.
We are going higher.
disagree if you want.
But you should probably hedge that viewpoint, with a bullish bet.
BALLA JI!
WE WILL WIN.

SUI – Long Trade Setup After Trend ReversalSUI has broken out of its downtrend, hitting all prior upside targets and now pulling back toward a key support area and the 200-day EMA, potentially forming a higher low—an ideal spot for re-entry.
🔹 Entry Zone:
Around $2.80
🎯 Take Profit Targets:
🥇 $3.40 – $3.60
🥈 $4.00 – $4.20
🥉 $5.00 – $5.20
🛑 Stop Loss:
Daily close below $2.20
📌 Strategy Notes:
Look for bullish confirmation (e.g., wick rejections, bullish engulfing candle) near $2.80
Structure remains intact as long as price holds above $2.20
EMA retests often precede strong continuation if trend strength remains
TradeCityPro | SUI: Bullish Push Faces Key Resistance Test👋 Welcome to TradeCity Pro!
In this analysis, I want to review the SUI coin for you. It's one of the DeFi layer-1 projects that was highly hyped in 2024 and has recently gained renewed attention due to some news from the project.
🔍 This project's coin, with the symbol SUI, has reached a market cap of $11.3 billion, ranking it 11th on CoinMarketCap.
📅 Daily Timeframe
As you can see in the daily timeframe, since the last analysis I shared in this channel, the price has rebounded from the support zone I highlighted and, after breaking the trendline, made a bullish leg up to 3.6402.
📊 A significant amount of buying volume has entered the market, and the RSI has entered Overbuy territory. These two factors drove the bullish move, and the 3.6402 resistance is a key level that has temporarily held off further price increases.
✔️ Currently, we’re seeing a few corrective candles that caused the price to reject from this resistance, but it's holding up well and still looks poised to move back toward this level.
🛒 For spot buying, if the price moves back toward this area, you can enter a position on a break of 3.6402. The next trigger is the break of 4.0866, and the main resistance ahead is 5.2689.
🔽 If a correction occurs, support levels are 2.7830 and 2.2495. If price retraces, these can serve either as short targets or long entry zones depending on the price reaction.
📉 Confirmation of trend reversal would come if the price fails to make a higher high above 3.6402 and breaks the current low. After that, we can consider opening a short position.
📝 Final Thoughts
This analysis reflects our opinions and is not financial advice.
Share your thoughts in the comments, and don’t forget to share this analysis with your friends! ❤️

SUI Drip Drip Driping DownSUI is looking more like it's 4th wave is going to go down a bit more before it can bounce up to $4.00. I really was hopeful that May 5th's $3.26 was it's recent retracement bottom... but it looks like we are about to revisit $3.26 and go even lower.
My target range is between $2.80 and $3.08, with my best guess as $2.88 as it will touch a previous high and will settle near the fib golden zone.
At the time I am posting this, the price is hovering around $3.24 and BTC is nearing 94k.
I think the market overall is going to be very nervious on 6 May, the day before the Fed's 7th May meeting.

SUI - A closer lookIn my previous SUI analysis, I currently have us in an impulse structure leading into the 5th wave.
Zoomed out, it seems we're still in a corrective structure. Looking to short at the TP of the long.

SUI Looks Bearish (2H)From the point where we placed the red arrow on the chart, it appears that the correction in SUI has begun.
An expansionary wave structure is visible, which could potentially push SUI toward the green zone.
Targets are marked on the chart. As long as the supply zone holds, the price may move toward the targets and the green box.
A 4-hour candle closing above the invalidation level will invalidate this analysis.
For risk management, please don't forget stop loss and capital management
When we reach the first target, save some profit and then change the stop to entry
Comment if you have any questions
Thank You

SUIUSDT Potential DownsidesHey Traders, in today's trading session we are monitoring SUI/USDT for a selling opportunity around 3.40 zone, SUI/USDT is trading in a downtrend and currently is in a correction phase in which it is approaching the trend at 3.40 support and resistance area.
Trade safe, Joe.

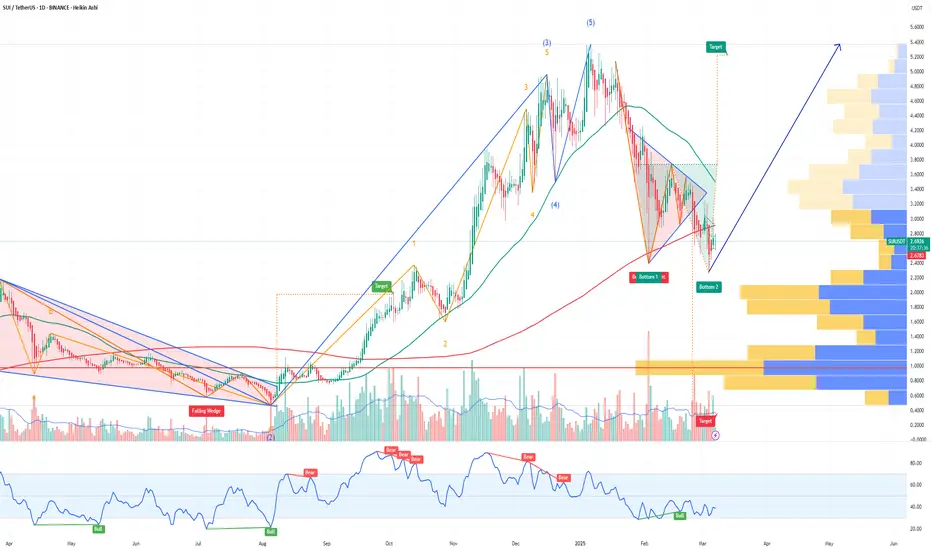
SUIUSD is consolidating ahead of massive Leg. Can it hit $9.500?Sui (SUIUSD) has completed Stage 1 of its recovery process following the April 07 bottom. That was a Higher Low on the 2-year Fibonacci Channel Up and having already broken above both the 1D MA50 (blue trend-line) and 1D MA200 (orange trend-line), the price is now consolidating.
This is fairly similar to what it did on September 20 2024, which was followed by a strong rise to the 1.0 Fib (previous High) where the price pulled-back to the 1D MA50. That was its final test before the peak forming rally just above the 1.5 Fibonacci extension.
As a result, we expect SUI to hit at least $9.500 on the long-term.
-------------------------------------------------------------------------------
** Please LIKE 👍, FOLLOW ✅, SHARE 🙌 and COMMENT ✍ if you enjoy this idea! Also share your ideas and charts in the comments section below! This is best way to keep it relevant, support us, keep the content here free and allow the idea to reach as many people as possible. **
-------------------------------------------------------------------------------
💸💸💸💸💸💸
👇 👇 👇 👇 👇 👇

SUI/USDT Long Entry at 3.507 (10x Leverage) | Strategy in PlayEntered a long position on CRYPTOCAP:SUI at 3.507 with 10x leverage. Current price action is hovering near entry. Watching key levels:
🔹 Target Zone: 3.8760+
🔻 Support Zone: ~3.25 (highlighted for potential SL zone)
🧠 TP (Take Profit) and SL (Stop Loss) will be updated as the move develops.
Keep an eye on price reaction around the support-resistance flip zone.

SUI sell pressure incoming can it hold the line?SUI unlocks could cause dilution-sell pressure; however, if the SUI bulls are strong enough, they may absorb the unlock. Momentum is overbought and could come down, which is a good recipe to buy the dip.
Full TA: Link in the BIO

Shorting Sui how Far Down Are We Going ? 3.3 -3.0 ? Here is my trade I just entered with stop loss and take profit zones 1 and 2. Let me know what you think
Kris/Mindbloome Exchange
Trade Smarter Live Better

Breaking: $PEPE on SUI Surg 129% to Reclaim $1.7 Mln Market CapThe first frog-themed memecoin on SUI network that is emulating the PEPE mascot meme has broken out of a cup and handle as we predicted pulling a 129% in gains.
This memecoin has turn out to be a massive shocker since we have predicted its breakout sitting at a $172k in market and has surge as high as 908% to reclaim $1,713,221 market cap enroute to the $3 million market cap- a level known as its all time high market cap.
With build up momentum, anticipated CEX listings, RSI at 67, and its NFT assets that was recently unveiled with a hard capped supply of 420, this Frog theme memecoin emulating the Ogee CRYPTOCAP:PEPE might just outpace the main pepe memecoin with a thriving and growing community of 2k members on Telegram, and about 4k on X (Formerly Twitter), $PEPESUI might just be the catalyst to a bullish campaign on the SUI ecosystem.
Data from CMC shows about 242.13% increase in 24 hours trading volume for $PEPESUI. While only available on platforms like CETUS, and few SUI DEX platform, delving on this asset could be a life changing decision.
About Pepe on Sui
Pepe on Sui is a meme coin project that leverages the Sui blockchain to create a unique and engaging digital asset. Launched in October 2024, the project combines the viral appeal of the Pepe the Frog meme with the technological advantages of the Sui blockchain. It aims to offer a fun and community-driven experience for its users while providing practical utility within the blockchain ecosystem.
Pepe on Sui Price Data
The Pepe on Sui price today is $0.000000004028 with a 24-hour trading volume of $195,267 USD. Pepe on Sui is up 41.42% in the last 24 hours. The current CoinMarketCap ranking is #3716, with a market cap of approx. $1.69 Million. The circulating supply is 420,690,000,000,000 and a max. supply of 420,690,000,000,000 PEPE coins.

SUI/USDT 1H: Markup Phase – Long Setup Above $3.60SUI/USDT 1H: Markup Phase – Long Setup Above $3.60
🚀 Follow me on TradingView if you respect our charts! 📈 Daily updates!
Current Market Conditions (Confidence Level: 8/10):
Price at $3.60, showing strong bullish momentum following recent accumulation phase.
Hidden bullish divergence on RSI confirms internal strength and supports upward continuation.
Smart Money accumulation completed, premium zone established at $3.80.
Trade Setup (Long Bias):
Entry: $3.60 – $3.62 zone.
Targets:
T1: $3.80
T2: $3.90
T3: $4.00
Stop Loss: $3.40 (below Fair Value Gap support).
Risk Score:
8/10 – Clear breakout structure supports bullish thesis, minor risk due to proximity to premium resistance zones.
Key Observations:
Strong support confirmed at $3.40 FVG level.
Volume profile indicates heavy accumulation below $3.60, now transitioning to expansion.
Distribution phase expected above $3.90 if targets are reached.
Market Makers likely preparing to offload positions near $4.00 zone.
Recommendation:
Long positions favored within $3.60 – $3.62 entry range with tight stop loss at $3.40.
Scale partial profits at $3.80 and $3.90 to secure gains, leaving runners towards $4.00.
Monitor price action closely near $3.80 for possible early rejection or continuation signals.
🚀 Follow me on TradingView if you respect our charts! 📈 Daily updates!

SUI UPDATEHello friends✌
As you can see, after a price drop, buyers were able to break the downtrend and form an ascending channel, which, given the entry of buyers, we can buy in batches with capital and risk management to move towards the specified goals.
*Trade safely with us*

Breaking: DeepBook Protocol ($DEEP) Surged 28% Amid Bullish FlagThe price DeepBook Protocol ( AMEX:DEEP ) token saw a notable uptick of 28% today amidst breaking out of a bullish flag pattern.
Built on the Sui blockchain, AMEX:DEEP coin has been on a bullish streak for the past 7 days with an uptick of 213.26% in 24 hours trading volume today. Similarly, the asset's market cap has risen 21.41% to reclaim the $700 million market cap.
As of the time of writing, AMEX:DEEP coin is up 6.23% trading within a bullish flag pattern. This altcoin has already broken the ceiling of the flag gearing for 80% surge.
About DeepBook Protocol
DeepBook is a decentralized central limit order book (CLOB) built on Sui. DeepBook leverages Sui's parallel execution and low transaction fees to bring a highly performant, low-latency exchange on chain. DeepBook’s main competitive edge is that it is fully on-chain.
DeepBook Protocol Price Data
The DeepBook Protocol price today is $0.234722 USD with a 24-hour trading volume of $465,843,629 USD. DeepBook Protocol is up 24.02% in the last 24 hours. The current CoinMarketCap ranking is #94, with a market cap of $717,779,555 USD. It has a circulating supply of 3,058,000,000 DEEP coins and a max. supply of 10,000,000,000 DEEP coins.

$PEPESUI Surged 580% to Reclaim the $1Mln Mkt Cap ThresholdThe $PEPESUI coin has surged 580% for the past 8 days to reclaim the $1 Million market cap threshold, enroute to $3 million market cap with an 80% surge as confirmation.
The 4-hour price chart depicts the formation of a cup and handle pattern, a pattern generally seen as a bullish pattern and for a project sitting at just $1.22 Million in market cap this SUI project might just be the catalyst for the 2025 bull run.
With anticipated CEX listings and the unveiling of their NFT's with a minimum supply of 420, $PEPESUI is poised to reclaim the $3 Million market cap and beyond with the growing hype and adoption of the CRYPTOCAP:SUI ecosystem, The blue frog might just outpaced the original CRYPTOCAP:PEPE token but only time shall tell.
As of the time of writing, CRYPTOCAP:PEPE Sui is up 22% trading within a bullish pattern forming the wedge of the cup formed. We might experience a respite before a major leap ahead.
About Pepe on Sui
Pepe on Sui is a meme coin project that leverages the Sui blockchain to create a unique and engaging digital asset. Launched in October 2024, the project combines the viral appeal of the Pepe the Frog meme with the technological advantages of the Sui blockchain. It aims to offer a fun and community-driven experience for its users while providing practical utility within the blockchain ecosystem.
Pepe on Sui Price Data
The Pepe on Sui price today is $0.000000002985 with a 24-hour trading volume of $56,415.76 USD. Pepe on Sui is up 16.61% in the last 24 hours. The current CoinMarketCap ranking is #4189, with a market cap of $0.000000002985. The circulating supply is 420,690,000,000,000 PEPE. supply of 420,690,000,000,000 PEPE coins.

Inverted Head and Shoulders Pattern🚨 SUI Forming Bullish Inverted Head and Shoulders Pattern 🚨
SUI appears to be forming a bullish inverted head and shoulders pattern. For confirmation of this bullish pattern, the price needs to break out above the neckline, which is marked in red.
📈 Technical Overview:
Pattern: Bullish Inverted Head and Shoulders
Neckline: Red resistance level
Confirmation: A breakout above the red neckline will confirm the bullish pattern.
🎯 Potential Move: Bullish continuation upon confirmation of the breakout.

SUIUSDT - Don't wait for pullback!SUI is the star of this season — on the 3-day chart, it just broke out of a falling wedge pattern with a massive green candle.
The price also reacted strongly to the 0.618 Fibonacci level, indicating there’s still plenty of upside potential ahead.
Don’t wait for pullbacks — coins like this rarely give clear entry opportunities, and any correction is usually very shallow.
It’s either you buy now, or regret it later.
Best regards Ceciliones 🎯

SUI/USDT Update - Approaching Channel Resistance! Let’s dive into the 1H chart for SUI/USDT.
Sui is riding a solid rising channel, showing strong bullish momentum!
Price has climbed from $2.25 since 22 April and is now at $3.59, with potential extention to the channel’s resistance at $4.00.
Key support holds at $3.00, with an intermediate level at $3.50.
If we break above $4.00, we could see a big move higher. But if rejected, expect a pullback toward $3.50 or $3.00.
Keep an eye on volume and price action at this resistance!

Trump's World Liberty Financial to add SUI to strategic reserve!CRYPTOCAP:SUI , a leading Layer-1 blockchain, has entered into a significant partnership with World Liberty Financial (WLFI), a decentralized finance (DeFi) platform affiliated with Donald Trump.
This collaboration involves integrating Sui's native token (SUI) into WLFI's "Macro Strategy" reserve, a strategic token fund designed to diversify holdings and support emerging blockchain projects.
The partnership also aims to explore product development opportunities leveraging Sui's technology.
WLFI's Macro Strategy reserve already includes prominent digital assets such as Bitcoin, Ethereum, and tokenized real-world assets like U.S. Treasury-backed tokens.
The addition of SUI reflects WLFI's focus on supporting innovative blockchain projects while expanding decentralized finance access to a broader audience.
The announcement of this partnership coincides with broader developments in the U.S. crypto landscape.
President Trump is expected to unveil details about a proposed "Crypto Strategic Reserve" during the White House Crypto Summit on March 7, 2025.
This reserve is anticipated to focus primarily on Bitcoin while also considering other digital assets
Trump-backed World Liberty Financial plans to add SUI to its strategic reserve.
I think the upside for SUI is Huge from here!
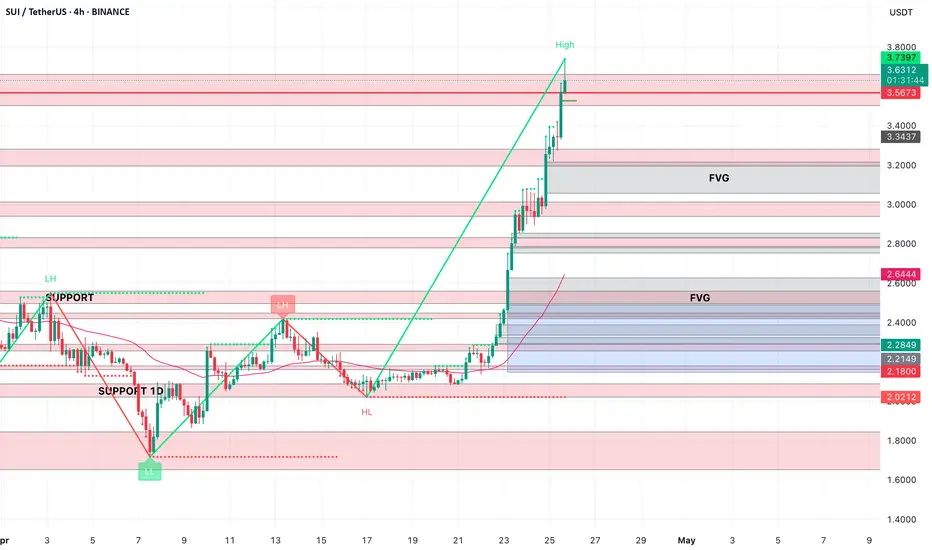
SUI AnalysisSUI/USDT - 4-Hour Chart Analysis: Potential Bullish Continuation
This analysis focuses on the 4-hour chart of SUI/USDT on Binance. Key observations include:
Current Price: SUI is trading at $3.6423, up 1.95% from the previous close.
Recent High: The recent high is $3.7397.
Support Levels: Key support levels are identified at $2.12 and $1.80. There's also a support zone labeled "SUPPORT 1D."
Fair Value Gap (FVG): There are two Fair Value Gaps (FVG) marked on the chart, one above the current price and one below, which could act as potential areas of interest.
Potential Bullish Trend: The chart suggests a potential continuation of the bullish trend, with the price moving upwards from the support levels.
Disclaimer: This is not financial advice. Please do your own research before making any trading decisions.