Sui - next target Sui is following Eth as most alts do.
Just an update on July 23rds chart targets (seen from a different lense).
SUIUSD

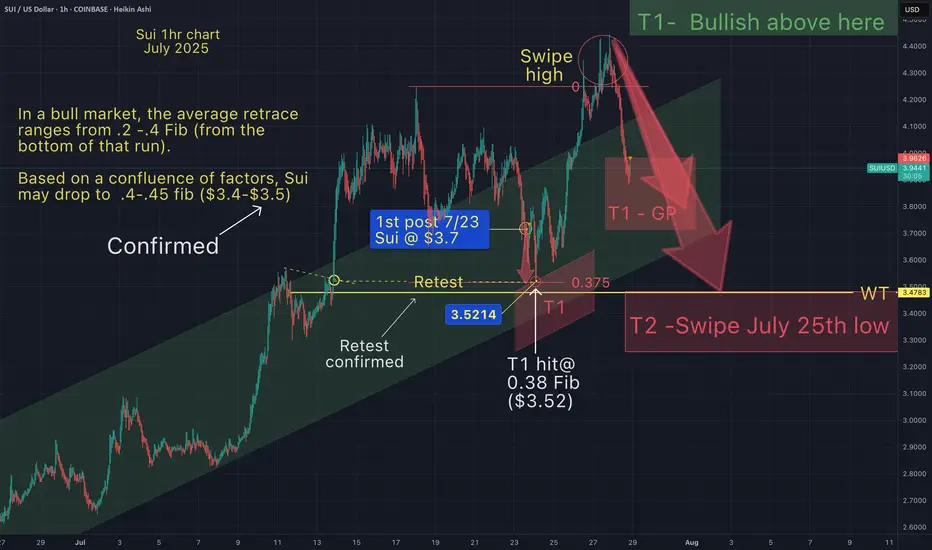
Sui next target (T2)As anticipated Sui would drop somewhere between the .2-.4 Fib (of the entire run).
As shown on the chart, Sui has hit the 3.8 Fib.
This was also expected because of the dotted yellow line indicating a breakout retest.
Also my price prediction on 7/23/25 was between $3.4 - $3.5.
So far Sui has hit my target within less than 1% @ $3.52.
Sui may bounce from here since it is in the golden pocket (red T1).
But I would not be surprised if Sui continues down to hit T2 (swipe recent low),
and liquidate the longs before starting its face melting pump upwards.
SUI new trend started!SUI / USDT
Price broke out after long accumulation range with good volume
Looks like a new bullish trend has started

SUI Breaks Out on Hype Surge — Momentum Cooling After Sharp PumpSUIUSDT 1H chart showing a clean breakout following renewed hype around SUI’s DeFi/NFT expansion. Over the past 48 hours, SUI gained ~15% as social buzz and bullish sentiment picked up — driven by strong ecosystem growth and analysts labeling it “ready for a second wave.”
Price broke above recent consolidation around the $3.95–$4.10 zone and surged to new local highs near $4.40. However, the first test of that high was immediately rejected, with the current candle showing signs of a minor cooldown. Stochastic RSI confirms this — hinting at potential for a short retracement or consolidation before continuation.
Key levels to watch:
$4.10–$4.00 zone (potential retest support)
$4.40 high as breakout resistance
Stoch RSI reset for a second leg
If buyers step in quickly on a retest, this breakout could extend into new territory. If not, we may see a revisit to the $4 zone before any further upside.

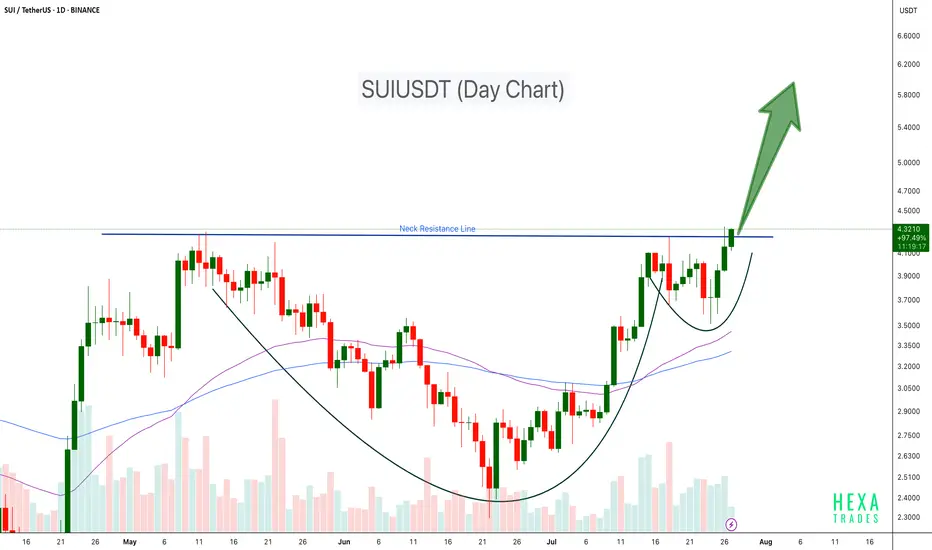
SUIUSDT Cup & Handle Breakout SUI has formed a classic Cup and Handle pattern on the daily chart and has now successfully broken above the neckline resistance around $4.30. This breakout could trigger a strong bullish continuation if volume sustains and retests hold.
Key Points:
Pattern: Cup and Handle
Breakout Level: ~$4.30 (neck resistance)
Potential Upside Target: $5.50 – $6.00+ based on pattern projection
Support Zone: $3.50
Confirmation: Sustained volume and close above neckline
Cheers
Hexa
#SUI/USDT potentail to 4.30 $#SUI
The price is moving within a descending channel on the 1-hour frame, adhering well to it, and is on its way to breaking strongly upwards and retesting it.
We have support from the lower boundary of the descending channel, at 3.85.
We have a downtrend on the RSI indicator that is about to be broken and retested, supporting the upside.
There is a major support area in green at 3.80, which represents a strong basis for the upside.
Don't forget a simple thing: ease and capital.
When you reach the first target, save some money and then change your stop-loss order to an entry order.
For inquiries, please leave a comment.
We have a trend to hold above the Moving Average 100.
Entry price: 3.99.
First target: 4.08.
Second target: 4.19.
Third target: 4.30.
Don't forget a simple thing: ease and capital.
When you reach your first target, save some money and then change your stop-loss order to an entry order.
For inquiries, please leave a comment.
Thank you.

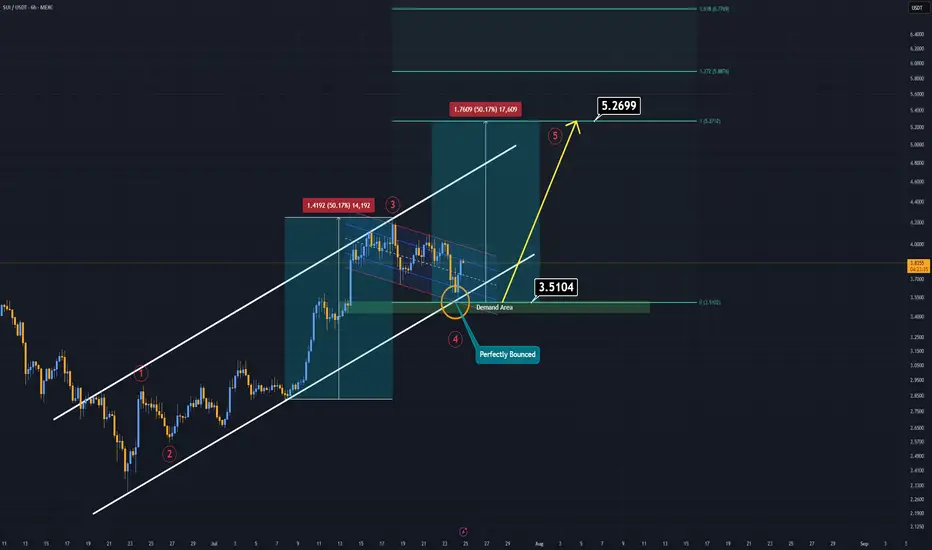
SUI Analysis (6H)If you're on the hunt for extreme risks and potentially high rewards — SUI might be calling your name.
Currently, SUI is trending within a well-respected ascending channel, and just today, it tapped both the demand zone and the lower boundary of this channel.
That’s what we call a double support, and it often signals a strong potential bounce.
SUI now appears to be forming a bullish flag pattern. If this formation breaks to the upside, it could trigger the fifth impulsive wave in line with Elliott Wave Theory.
In such a case, the main target is projected around $5.00–$5.20.
Extreme setups demand extreme conviction.
Good luck.
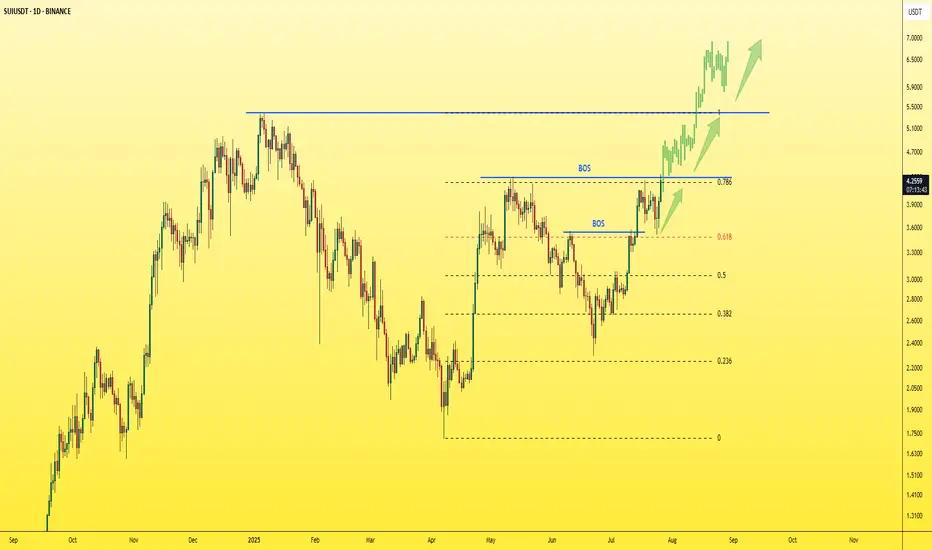
SUI - Just one step away from the explosion!The last candle on the daily chart just confirmed a BOS (Break of Structure) — a clear and strong sign of bullish continuation for the asset.
✅ This is a textbook entry for a long position.
🎯 Next target: $5 — and so far, no bearish signs in sight.
Best regards,
Ceciliones 🎯
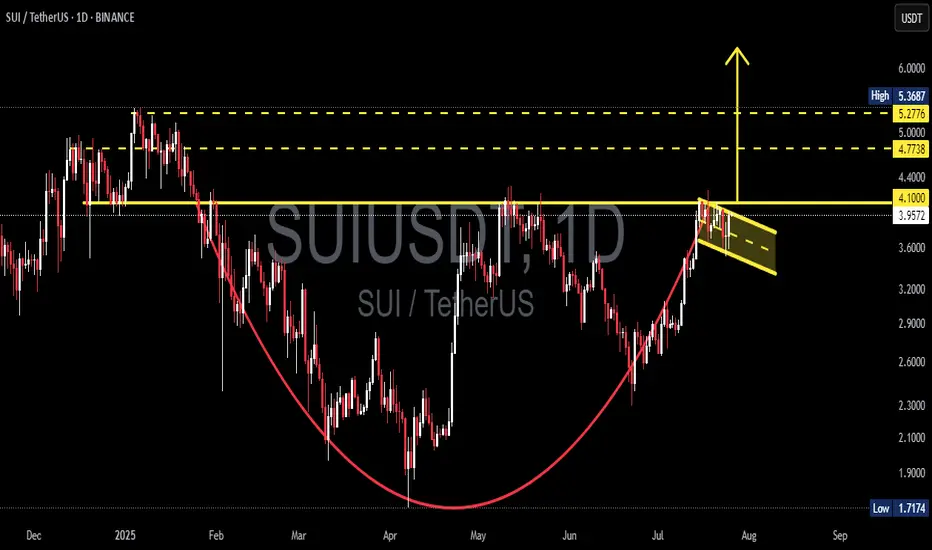
SUI/USDT Massive Cup and Handle Pattern Unfolding Is a Breakout?🧠 Technical Overview:
The daily chart of SUI/USDT showcases a textbook formation of the Cup and Handle pattern — a powerful bullish continuation signal that often precedes explosive upside moves.
The “Cup” took shape between January and July 2025, reflecting a deep rounding bottom. This indicates a long-term accumulation phase where bears gradually lose control.
The “Handle” is currently forming as a downward-sloping consolidation channel, often known as a bullish flag, which is typically the final pause before a breakout.
🔍 Key Technical Levels:
Current Price: $3.9661
Support Zone: $3.96
Major Resistance Levels to Watch:
$4.10 (handle resistance & breakout trigger)
$4.40 (local structural high)
$4.77 (previous high & fib extension zone)
$5.00 (psychological level)
$5.36 (measured move target from cup breakout)
---
🟢 Bullish Scenario: Breakout Incoming
If price breaks and closes above the handle resistance around $4.10, backed by increasing volume:
This confirms the Cup and Handle breakout.
Expect a rapid move toward $4.77 – $5.36 in the short to mid term.
The height of the cup projected upward gives a target of approximately +35% gain from breakout point.
🔔 Watch for:
Bullish engulfing candles
Volume spike during breakout
Break of upper trendline from the handle
---
🔴 Bearish Scenario: Breakdown Risk
If the price fails to hold the $3.96 support and breaks down from the handle channel:
Price may retest lower support zones near $3.60 or even $3.20
However, as long as the cup’s base at ~$2.50 holds, the macro bullish structure remains valid.
⚠️ Invalidation: A daily close below $3.60 would invalidate the short-term bullish setup.
---
📊 Pattern Psychology:
The Cup and Handle pattern reflects investor accumulation, shakeout, and renewed confidence. This is often seen in strong uptrending markets — and the current structure suggests that bulls are quietly preparing for a potential breakout.
---
📅 Timing Outlook:
Handle formations typically last between 1–3 weeks. If this timeline holds, a breakout could occur before mid-August 2025.
---
✅ Conclusion:
The technical setup for SUI/USDT is extremely compelling. With a strong Cup and Handle pattern nearing completion, and key resistance just overhead, traders should prepare for potential breakout conditions. A confirmed move above $4.10 could trigger a bullish wave toward $5.00+.
📌 Set alerts. Manage risk. And don’t ignore the volume.
#SUI #SUIUSDT #CryptoBreakout #CupAndHandle #BullishSetup #CryptoChartPatterns #AltcoinAnalysis #TechnicalAnalysis #BreakoutTrade
SUI : HODL BASKETHello friends🙌
🔊We have come to introduce a signal that can be a good option for your investment portfolio.
Given that the price is in the ascending channel and has good support from buyers, it is expected that this time the price will break the middle line of the channel and move to the ceiling of the channel and succeed in reaching ATH...
Don't forget about capital and risk management.⚠
🔥Follow us for more signals🔥
*Trade safely with us*
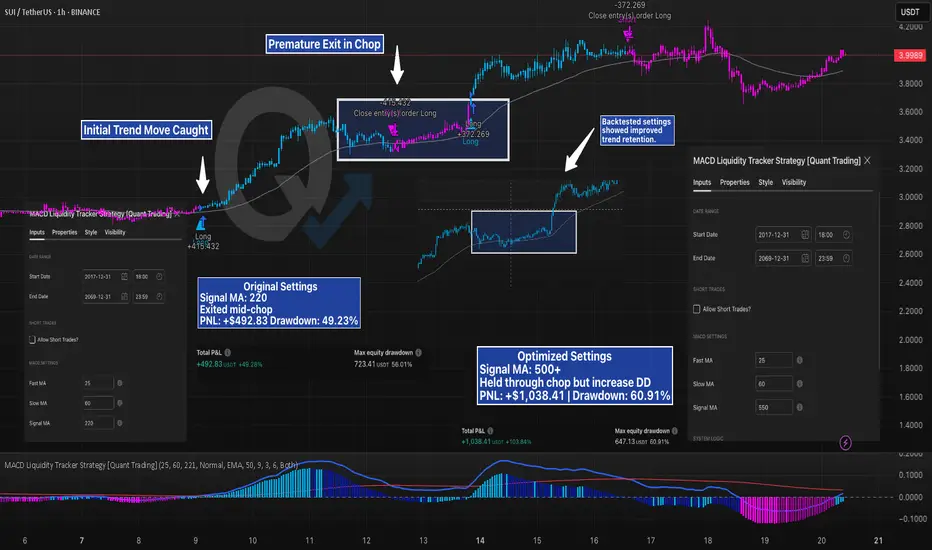
Mid-Chop Exit vs Trend Hold — How One Setting Changed EverythingSUI’s trend looked solid — but the strategy didn’t hold.
Using the MACD Liquidity Tracker Strategy with default settings (Signal MA = 220), the system caught the initial move well, but then exited during consolidation. It missed the continuation and had to re-enter late — resulting in more trades and reduced edge.
After running a few backtests, we increased the Signal MA to 550 to reduce early exits. The result:
Strategy held through the mid-trend chop
PNL more than doubled
Drawdown increased slightly, but the trade stayed intact
This is a perfect case study on how signal sensitivity affects trend behavior. Faster MAs respond quicker but tend to exit on noise. Slower MAs smooth it out — at the cost of larger swings.
Both versions are valid — but backtesting revealed which better fit this market structure.
No settings are one-size-fits-all — the key is understanding how each tweak behaves.
—
#SUIUSD #CryptoTrading #Backtesting #MACDStrategy #StrategyTweaks #LiquidityTracker #TradingEdge #QuantTradingPro #TradingView #TechnicalAnalysis
SUI: Calm Before the Wave 3 Surge?CRYPTOCAP:SUI is shaping up to be one of those charts that makes you lean in a little closer.
Right now, it appears to be sitting inside a potential wave 3, but something feels off. It hasn’t exploded yet. And when you’re looking for wave 3 behavior, that’s what you want: speed, commitment, follow-through. A clean surge, ideally in a straight line, that clears doubts and leaves the doubters behind.
We’re not seeing that yet. Right now the move is decipherable at many nested degrees making this move feel cautious.
And that opens the door to some possibilities:
It is a wave 3, just one that hasn’t lit the match yet.
We’re still nesting, multiple wave 1s and 2s stacking before the actual move hits.
Or it's a wave C of a Zig Zag.
As for levels, $4.20 stands out. Whether this turns into a rocket or a reset likely hinges on how price reacts there.
Stay nimble. If this is a true wave 3, it’ll leave no time for hesitation.
Be early, but not reckless.

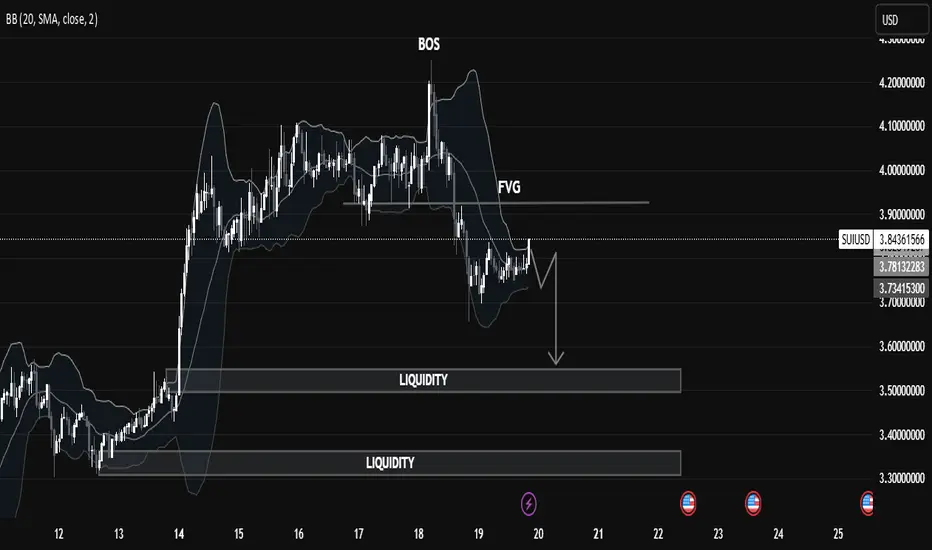
SUIUSD Liquidity Trap in Motion: Price Targeting Deeper Pools🧠 Market Structure Insight (SMC Framework)
🔍 1. Break of Structure (BOS):
The most recent BOS around the $3.95 level marked a bull trap, indicating a transition from bullish momentum to a distribution phase. This suggests institutional players offloaded liquidity at premium prices before initiating a markdown.
🕳️ 2. FVG (Fair Value Gap):
A visible Fair Value Gap (Imbalance) remains unmitigated above the current price action. This zone acted as a supply area, where price sharply moved down, leaving inefficiency in its trail—now serving as a potential point of rejection if revisited.
📌 Liquidity Zones:
Upper Liquidity Cleared: Price has swept highs before reversal (a sign of engineered liquidity grab).
Double Liquidity Pools Below:
First pool: Around $3.55 - $3.60
Second pool: Deep liquidity around $3.30 - $3.35
These levels are highly attractive for Smart Money to target next, suggesting continuation to the downside.
📉 Current Price Behavior:
Market is consolidating in a tight range just below FVG, signaling potential re-accumulation of sell orders.
The chart pattern suggests a potential lower high forming, likely to precede a bearish leg towards liquidity zones.
Bollinger Bands show compression, hinting at volatility expansion soon.
🎯 Trade Outlook (Not Financial Advice):
🔻 Bearish Bias:
Unless price breaks above the FVG zone with strong bullish momentum, the probability favors a bearish continuation targeting:
1st Target: ~$3.55
2nd Target (Deeper liquidity grab): ~$3.30
A rejection from FVG followed by a BOS to the downside would serve as confirmation for this bias.
📚 Educational Takeaway:
This chart is a clean illustration of Smart Money Concepts in play:
BOS > FVG > Liquidity Sweep
Price respects institutional footprints: grab liquidity, fill imbalances, then drive toward untouched liquidity zones.
Recognize market intent through structure shifts and imbalance reaction.
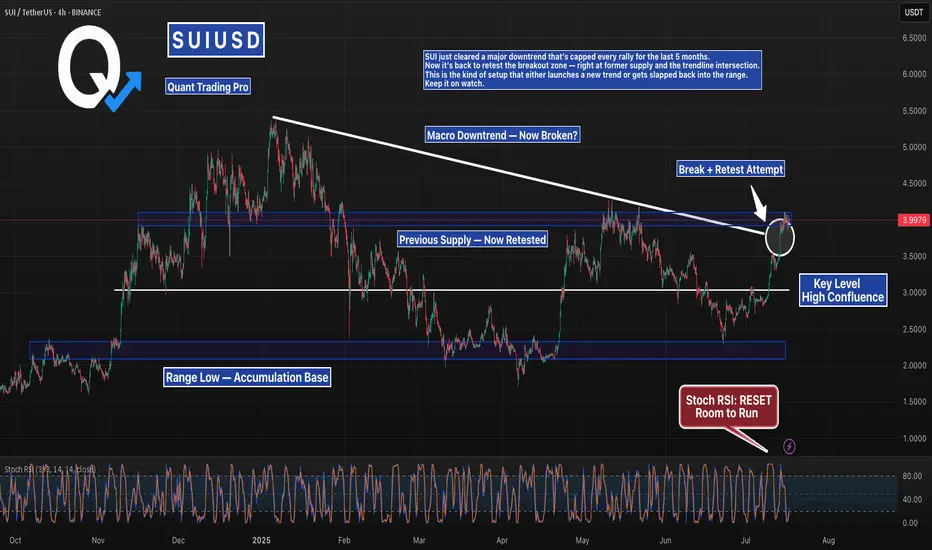
SUI Just Broke Its Downtrend — But Can It Hold?SUI just cleared a major downtrend that’s capped every rally for the last 5 months.
Now it’s back to retest the breakout zone — right at former supply and the trendline intersection.
This is the kind of setup that either launches a new trend or gets slapped back into the range.
Keep it on watch.
#SUI #SUIUSDT #CryptoBreakout #TrendlineTest #ChartAnalysis #BacktestEverything #TradingView #QuantTradingPro #CryptoTraders
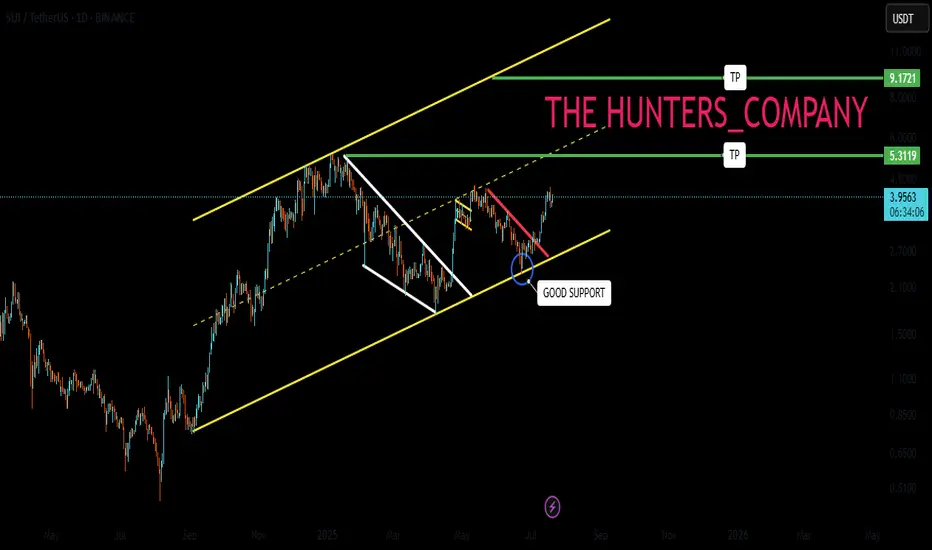
SUIUSDT Breaks Out of Triangle – Eyes on $10BINANCE:SUIUSDT daily chart has confirmed a breakout above a symmetric triangle resistance line within a larger ascending channel, signaling strong bullish momentum. Price has reclaimed the 100 and 200 EMAs, and the breakout is backed by rising volume. This setup opens the door for a potential rally toward the $10.00 level, with price currently holding above key structure support around $4.00. As long as this level holds, continuation toward the upper trendline remains likely. CRYPTOCAP:SUI

SUIUSD @ Retest Zone | Breakout Setup?SUI is consolidating in a potential bull flag above the previous resistance zone around $4.00.
Stoch RSI is low, trendline support is still intact, and a clean R:R setup presents itself with TP at $4.40 and SL at $3.80.
Watching for volume breakout confirmation before entry.
#SUIUSD #BullFlag #Crypto #SupportResistance #BreakoutSetup #TradingView #QuantTradingPro

SUI - Breakout of the year- SUI is currently trading near the resistance line. Price was reject around this resistance line in the previous pump.
- Given the current bullish market, price is expected to breakout from this resistance easily
Entry Price: 4.04
StopLoss: 3.2
TP1: 4.5059
TP2: 5.3810
TP3: 6.5106
TP4: 7.8772
TP5: 10+
Don't forget to set stoploss.
Stay tuned for more updates
Cheers
GreenCrypto

Will key support be held or broken today?Hello friends
According to the complete analysis we conducted on this currency, we concluded that the price correction can continue with the failure of the specified support and go to lower supports, but if buyers support the price in the support area, it can have a good rise.
Note that with capital and risk management, you can buy in steps in the specified support areas and move with it to the specified targets.
*Trade safely with us*

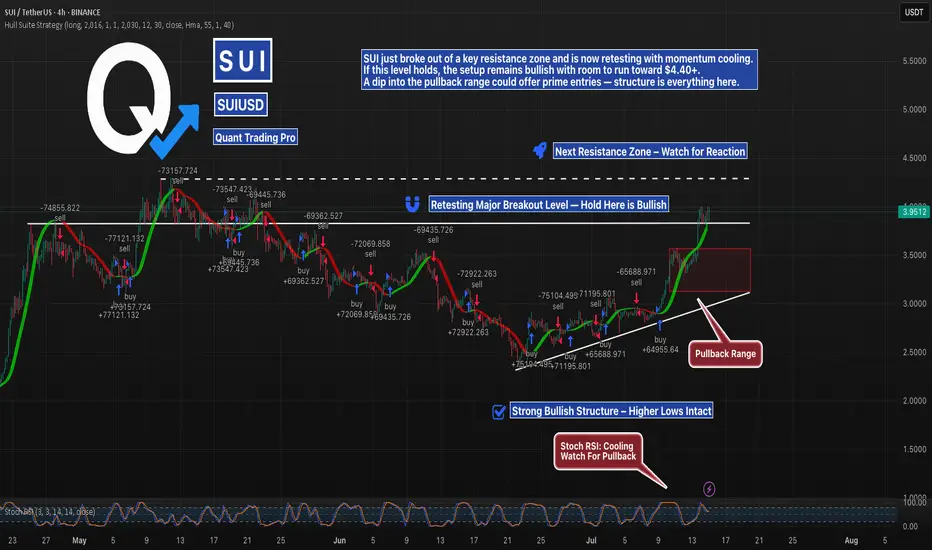
SUI Breakout Retest in Progress — Bulls Have the BallSUI has finally broken above major horizontal resistance and is now retesting that level, backed by a rising trendline of higher lows. With Stoch RSI cooling and the price sitting just above a prior range, this is the key decision zone.
If bulls defend the breakout, continuation toward $4.40+ is likely. If not, the pullback zone between $3.50–$3.00 becomes critical. Structure still favors the bulls — but confirmation is everything.
#SUIUSDT #CryptoBreakout #QuantTradingPro #TradingView #BacktestYourEdge #AltcoinSetup
SUI on its way to the teal pennants breakout targetSui has joined the bullishness here as it has brown up from the pennant and well on its way to the target. *not financial advice*

#SUI/USDT ready to surge 13% toward $3.72 target?#SUI
The price is moving within a descending channel on the 1-hour frame, adhering well to it, and is on its way to breaking it strongly upwards and retesting it.
We have a bounce from the lower boundary of the descending channel. This support is at 3.30.
We have a downtrend on the RSI indicator that is about to be broken and retested, supporting the upside.
There is a major support area in green at 3.20, which represents a strong basis for the upside.
Don't forget a simple thing: ease and capital.
When you reach the first target, save some money and then change your stop-loss order to an entry order.
For inquiries, please leave a comment.
We have a trend to hold above the 100 Moving Average.
Entry price: 3.44
First target: 3.53
Second target: 3.62
Third target: 3.72
Don't forget a simple thing: ease and capital.
When you reach the first target, save some money and then change your stop-loss order to an entry order.
For inquiries, please leave a comment.
Thank you.

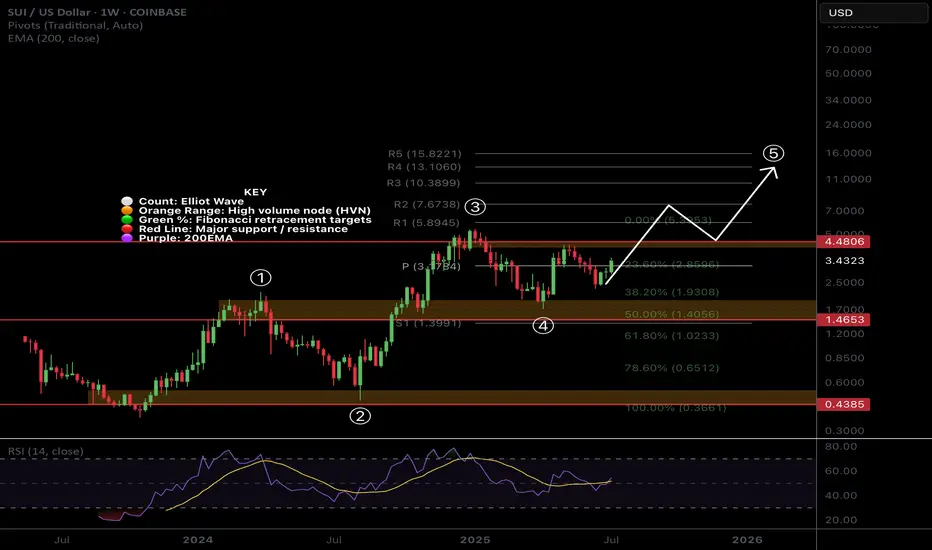
$SUI Wave 3 to Continue with a Strong Weekly CloseCRYPTOCAP:SUI printed a great weekly candle that will be closing today above the weekly pivot point with RSI trying to flip bullishly.
Price found support at 0.5 Fibonacci retracement and High Volume Node.
Wave 4 penetrated wave 1 which we potentially have a ending or leading diagonal Elliot Wave count limiting the potential upside with my current terminal target being around $10-13. Wave 4 could also actually be another wave 2 which would give us ridiculous targets but this is my preferred count for now.
Safe trading
DeGRAM | SUIUSD got out of the channel📊 Technical Analysis
● Price pierced the four-week falling-channel roof and the apex of a contracting triangle, turning 2.88 support into a launchpad and carving a sequence of higher lows.
● Breakout measured move and channel mid-band converge at 3.15; a close above there exposes the next horizontal barrier and channel top at 3.46. Risk is framed by the former triangle base at 2.88 and major swing floor 2.69.
💡 Fundamental Analysis
● Sui’s on-chain TVL has climbed >15 % since 25 Jun after zkLogin main-net rollout and Mysten Labs’ new developer grants, underpinning demand despite broad market lethargy.
✨ Summary
Long 2.90-3.05; hold above 3.15 targets 3.46. Invalidate on a 4 h close below 2.88.
-------------------
Share your opinion in the comments and support the idea with a like. Thanks for your support!
