SUI new trend started!SUI / USDT
Price broke out after long accumulation range with good volume
Looks like a new bullish trend has started
Suiusdt

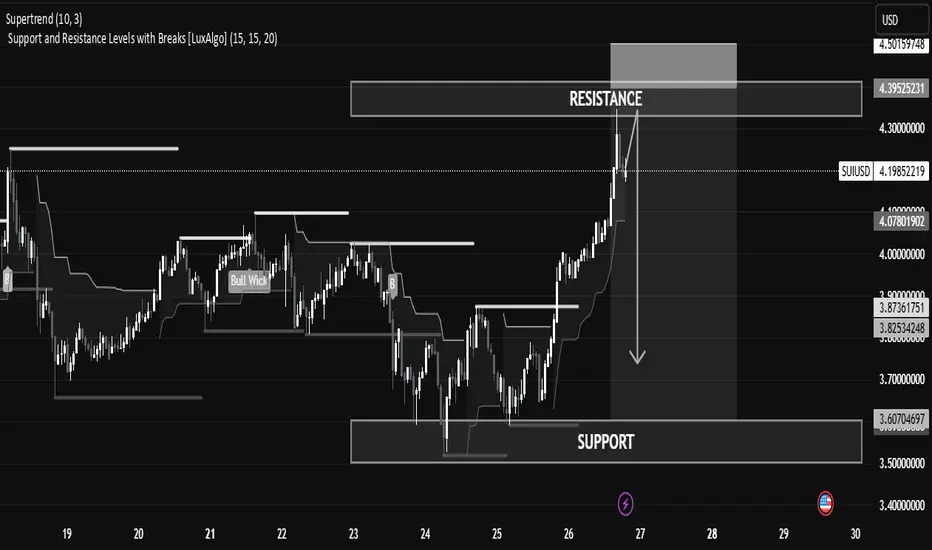
SUI/USD Technical Analysis – Potential Reversal Zone IdentifiedSUI/USD Technical Analysis – Potential Reversal Zone Identified
The current SUI/USD price action shows a strong bullish impulse reaching into a well-defined resistance zone, suggesting a potential pullback or reversal in the short term.
🔍 Key Levels
Resistance Zone: Between 4.30 – 4.39 USD, currently being tested after a strong bullish run. This is a historical supply area where price previously reversed.
Support Zone: Found between 3.60 – 3.70 USD, where price consolidated and accumulated before initiating the current rally.
Current Price: 4.2044 USD, slightly below the resistance zone, showing early signs of rejection.
📊 Technical Indicators & Structure
Supertrend (10,3): Bullish signal still active, suggesting trend strength, though traders should be cautious near resistance.
Break of Structure (BoS): Clean upward breaks suggest buyer dominance, but profit booking or sell-side liquidity may emerge near resistance.
Volume & Momentum: Impulse candles show strength, but volume tapering near resistance could indicate exhaustion.
📘 Educational Perspective
This setup highlights the importance of trading within key zones:
Buying at support, where demand is strong.
Monitoring resistance for signs of exhaustion or reversal patterns like wicks, doji, or bearish engulfing.
Risk Management Tip: In such cases, aggressive traders might short from resistance with tight stops, while conservative traders wait for confirmation (e.g., break and retest of the support or resistance).
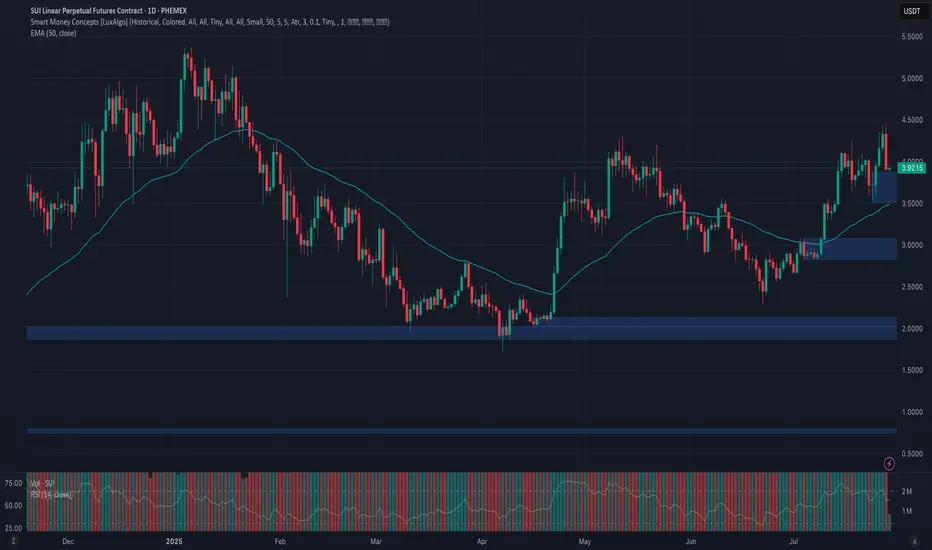
Phemex Analysis #100: Pro Tips for Trading Sui (SUI)Sui ( PHEMEX:SUIUSDT.P ) has swiftly emerged as one of the most promising Layer 1 blockchains, well-known for its focus on scalability, high throughput, and developer-friendly infrastructure. Recently, Sui has attracted significant attention thanks to its growing DeFi ecosystem, strategic partnerships, and community enthusiasm.
Over the past 2 weeks, SUI showed robust bullish activity, rising more than 30% to break key resistance around $4.3, and it’s now trading at around $3.9. The current price action indicates a potential continuation of bullish momentum, yet traders remain cautious about possible retracements and volatility.
Let’s carefully examine a few likely scenarios for SUI and determine how traders can capitalize strategically.
Possible Scenarios
1. Short-term Retracement (Healthy Pullback)
Following the recent rapid price rise, SUI might experience a short-term correction toward previous resistance-turned-support near $3.6. A low-volume retracement to this level could represent a healthy pause before the next bullish leg.
Pro Tips:
Buying the Dip: Closely watch support around $3.6; a successful retest on lower volume could present an ideal buying opportunity.
Volume Monitoring: Pay close attention to volume levels during the pullback—a low-volume dip indicates healthy profit-taking rather than bearish reversal.
2. Bullish Breakout (Pushing Higher!)
If SUI maintains bullish momentum and successfully holds above recent support around $3.8, it may continue to target higher resistance levels. Strong buying volume accompanying further gains could send SUI towards key resistance zones around $5.0 and potentially breaking previous all-time-high $5.37.
Pro Tips:
Entry Signals: Consider buying positions on a high-volume breakout confirmation above $4.45, signaling bullish continuation.
Profit Targets: Plan partial profit-taking around $5.0 and $5.37 resistance zones to lock in gains.
3. Bearish Scenario (Deeper Correction)
If broader market sentiment turns negative or if buying volume significantly weakens, SUI could break below $3.6, signaling bearish pressure. In this scenario, deeper corrections towards support levels at $2.8 or potentially $2.3 may occur.
Pro Tips:
Short Opportunities: Experienced traders could consider shorting or reducing exposure if SUI decisively breaks below the key $3.6 support level on increased selling volume.
Accumulation Strategy: Long-term investors can strategically accumulate positions near stronger support zones around $2.8 and $2.3 after confirming price stabilization.
Conclusion
Sui (SUI) currently offers compelling trading opportunities driven by recent bullish activity and increasing ecosystem growth. Traders should stay alert for critical breakout levels ($4.45) and monitor essential support areas ($3.6) closely. By applying disciplined trading approaches, setting clear profit targets, and managing risk prudently, traders can navigate SUI’s volatility with greater confidence and potentially maximize gains.
🔥 Tips:
Armed Your Trading Arsenal with advanced tools like multiple watchlists, basket orders, and real-time strategy adjustments at Phemex. Our USDT-based scaled orders give you precise control over your risk, while iceberg orders provide stealthy execution.
Disclaimer: This is NOT financial or investment advice. Please conduct your own research (DYOR). Phemex is not responsible, directly or indirectly, for any damage or loss incurred or claimed to be caused by or in association with the use of or reliance on any content, goods, or services mentioned in this article.
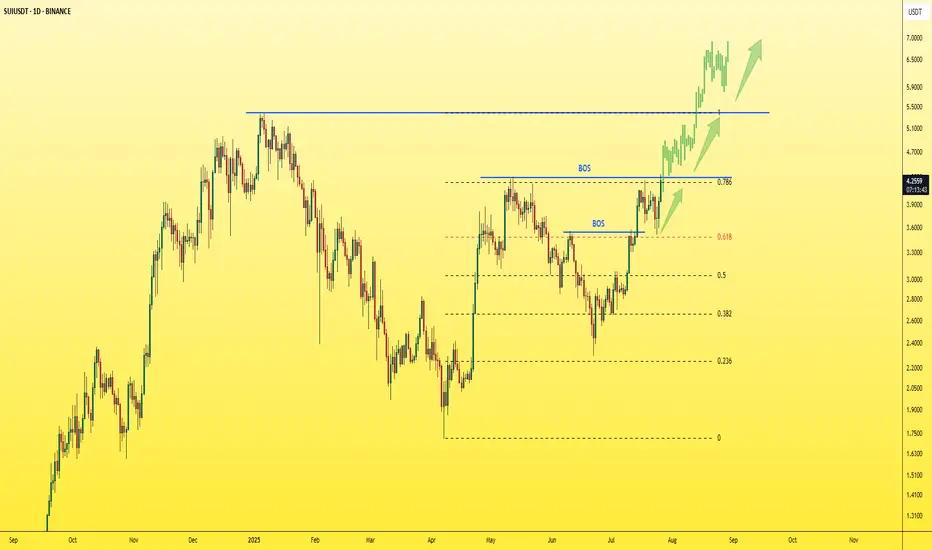
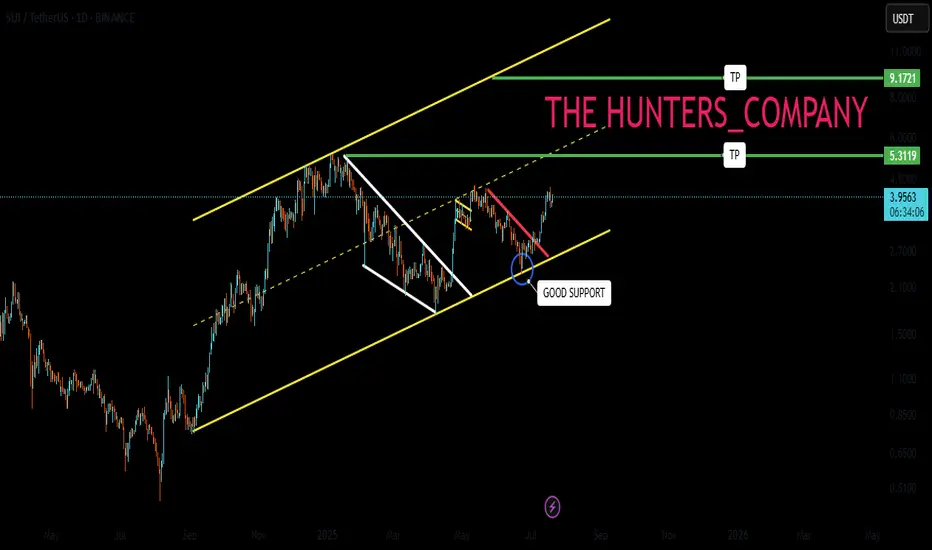
SUI to $5.31? Chart Says It’s 22% Away!SUI is shaping up beautifully on the daily chart. After spending weeks in a consolidation zone, the price has finally broken out with strong momentum and reclaimed bullish territory. The CM_EMA TrendBars are showing green, which confirms a positive directional shift. This indicates the bulls are now back in control.
The most recent breakout has pushed SUI above a key structure level near $3.93, turning previous resistance into new support. What’s impressive is that price didn’t just break this level — it retested it and bounced sharply, suggesting strong buyer interest. This kind of price action is typically seen before continuation moves.
Currently, the setup shows a clean bullish structure. Price is holding firmly above the moving average and is supported by recent higher highs and higher lows. If this momentum continues, SUI could be on its way toward the next major resistance zones, clearly marked on your chart as Profit Target 1 ($5.014) and Profit Target 2 ($5.312).
Volume seems steady, not explosive, but enough to support a sustainable climb — which is ideal for swing setups. This gives the chart a healthy look, especially in the context of the wider altcoin recovery theme.
Now, let's talk about risk. The Stop-Loss is logically placed at $3.602, just below the most recent breakout level and the prior base structure. If the price breaks below this zone, it would likely invalidate the current bullish setup.
🎯 Trading Idea Based on Chart Setup:
• Entry: $4.213 (current zone)
• Stop-Loss: $3.602
• TP1: $5.014 — near-term resistance
• TP2: $5.312 — full extension target
• Risk-to-Reward: ~2.36 on TP2 💹
This is a favorable setup for swing traders with clear levels and a clean chart structure. The EMAs are aligned bullishly, and the breakout has followed a strong trend resumption. If the market conditions continue supporting altcoins, SUI has the potential to outperform in the coming weeks.
In summary, SUI is in a confirmed uptrend, riding strong momentum after a clean breakout. As long as price holds above $3.93 and especially above the stop at $3.60, the path of least resistance remains upward.


SUI Breaks Out on Hype Surge — Momentum Cooling After Sharp PumpSUIUSDT 1H chart showing a clean breakout following renewed hype around SUI’s DeFi/NFT expansion. Over the past 48 hours, SUI gained ~15% as social buzz and bullish sentiment picked up — driven by strong ecosystem growth and analysts labeling it “ready for a second wave.”
Price broke above recent consolidation around the $3.95–$4.10 zone and surged to new local highs near $4.40. However, the first test of that high was immediately rejected, with the current candle showing signs of a minor cooldown. Stochastic RSI confirms this — hinting at potential for a short retracement or consolidation before continuation.
Key levels to watch:
$4.10–$4.00 zone (potential retest support)
$4.40 high as breakout resistance
Stoch RSI reset for a second leg
If buyers step in quickly on a retest, this breakout could extend into new territory. If not, we may see a revisit to the $4 zone before any further upside.

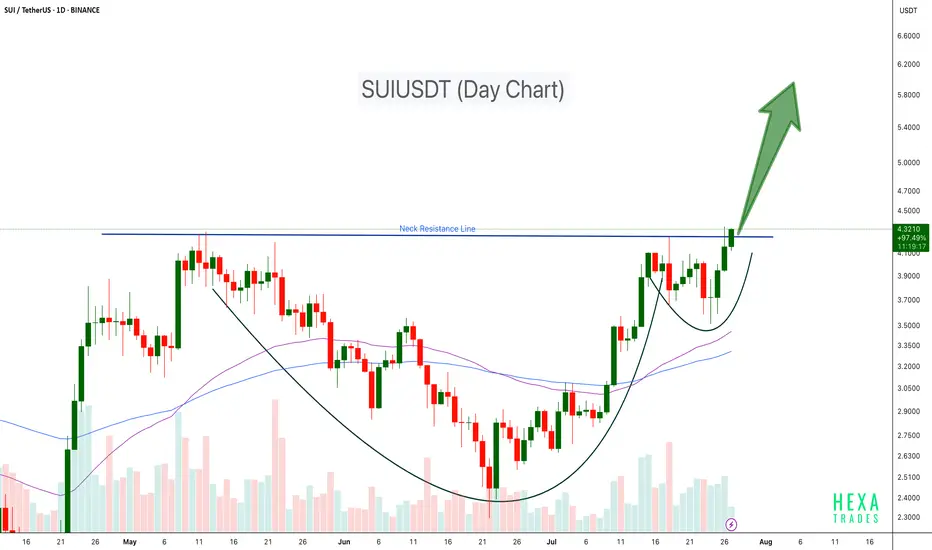
SUIUSDT Cup & Handle Breakout SUI has formed a classic Cup and Handle pattern on the daily chart and has now successfully broken above the neckline resistance around $4.30. This breakout could trigger a strong bullish continuation if volume sustains and retests hold.
Key Points:
Pattern: Cup and Handle
Breakout Level: ~$4.30 (neck resistance)
Potential Upside Target: $5.50 – $6.00+ based on pattern projection
Support Zone: $3.50
Confirmation: Sustained volume and close above neckline
Cheers
Hexa
SUI Swing Buy / Long SetupSui is on Strong and decision Order block on 1 day Timeframe, If we break this then SUI will take correction till recent weekly low. If we hold this then new ath. Book some or 80% on mentioned area, rest hold till 6$.

SUI Price Idea
Be Carefull and Full Patient on SUI today because if the price break and closing under Choch Line the probability to go down is possible, but if break the line without closing below the line we can wait for the choch on the low Time Frame for buy opportunity
#staysafu

SUI / USDT : Looking bullish SUI/USDT chart shows a breakout from a descending trendline, confirming upward momentum. Current price tests the resistance zone around $4.00. BTC is receiving support from the FVG, indicating short-term bullish potential.
Bullish Scenario: If price breaks above the resistance zone, a rally towards $4.50 to $5.00 is possible. Watch for confirmation of higher highs on shorter timeframes.
Invalid Setup: If price fails to break the resistance and falls back below $3.50, the bullish setup would be invalidated.
Pro Tip: Always wait for a clear confirmation candle above the resistance zone before entering a trade to minimize risk.

#SUI/USDT potentail to 4.30 $#SUI
The price is moving within a descending channel on the 1-hour frame, adhering well to it, and is on its way to breaking strongly upwards and retesting it.
We have support from the lower boundary of the descending channel, at 3.85.
We have a downtrend on the RSI indicator that is about to be broken and retested, supporting the upside.
There is a major support area in green at 3.80, which represents a strong basis for the upside.
Don't forget a simple thing: ease and capital.
When you reach the first target, save some money and then change your stop-loss order to an entry order.
For inquiries, please leave a comment.
We have a trend to hold above the Moving Average 100.
Entry price: 3.99.
First target: 4.08.
Second target: 4.19.
Third target: 4.30.
Don't forget a simple thing: ease and capital.
When you reach your first target, save some money and then change your stop-loss order to an entry order.
For inquiries, please leave a comment.
Thank you.

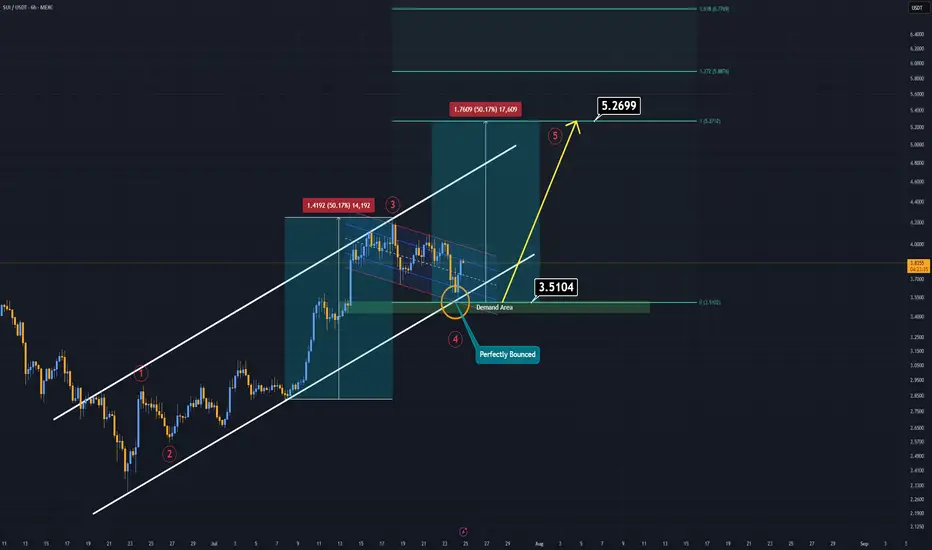
SUI Analysis (6H)If you're on the hunt for extreme risks and potentially high rewards — SUI might be calling your name.
Currently, SUI is trending within a well-respected ascending channel, and just today, it tapped both the demand zone and the lower boundary of this channel.
That’s what we call a double support, and it often signals a strong potential bounce.
SUI now appears to be forming a bullish flag pattern. If this formation breaks to the upside, it could trigger the fifth impulsive wave in line with Elliott Wave Theory.
In such a case, the main target is projected around $5.00–$5.20.
Extreme setups demand extreme conviction.
Good luck.
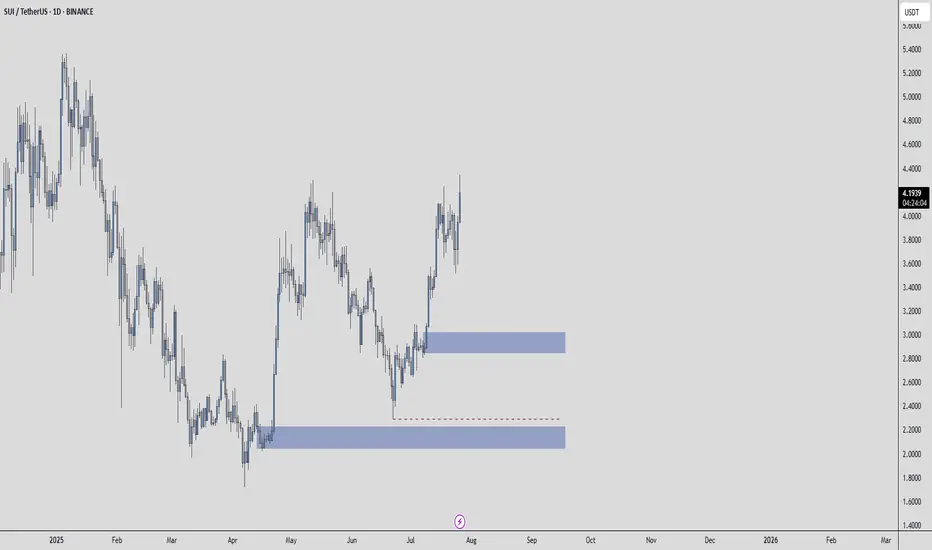
SUIUSDT – A Setup Worth WatchingThe blue box isn't just a zone, it’s a place where value and timing intersect.
🟦 Context
If price enters this area with control:
It aligns with past volume cluster support
A clean 1H break and confirmation may unlock high R:R potential
Structure + patience = confidence
📌 Execution Plan
🧭 No need to predict.
Just observe:
✅ Does the blue box hold with absorption or slowdown?
✅ Does CDV remain constructive?
✅ Does the 1H chart break and confirm direction?
If yes, there’s asymmetry on your side.
And that’s when smart trades happen.
"It’s not about being early. It’s about being right when it matters."
— And that starts with a prepared eye and a defined plan.
📌I keep my charts clean and simple because I believe clarity leads to better decisions.
📌My approach is built on years of experience and a solid track record. I don’t claim to know it all but I’m confident in my ability to spot high-probability setups.
📌If you would like to learn how to use the heatmap, cumulative volume delta and volume footprint techniques that I use below to determine very accurate demand regions, you can send me a private message. I help anyone who wants it completely free of charge.
🔑I have a long list of my proven technique below:
🎯 ZENUSDT.P: Patience & Profitability | %230 Reaction from the Sniper Entry
🐶 DOGEUSDT.P: Next Move
🎨 RENDERUSDT.P: Opportunity of the Month
💎 ETHUSDT.P: Where to Retrace
🟢 BNBUSDT.P: Potential Surge
📊 BTC Dominance: Reaction Zone
🌊 WAVESUSDT.P: Demand Zone Potential
🟣 UNIUSDT.P: Long-Term Trade
🔵 XRPUSDT.P: Entry Zones
🔗 LINKUSDT.P: Follow The River
📈 BTCUSDT.P: Two Key Demand Zones
🟩 POLUSDT: Bullish Momentum
🌟 PENDLEUSDT.P: Where Opportunity Meets Precision
🔥 BTCUSDT.P: Liquidation of Highly Leveraged Longs
🌊 SOLUSDT.P: SOL's Dip - Your Opportunity
🐸 1000PEPEUSDT.P: Prime Bounce Zone Unlocked
🚀 ETHUSDT.P: Set to Explode - Don't Miss This Game Changer
🤖 IQUSDT: Smart Plan
⚡️ PONDUSDT: A Trade Not Taken Is Better Than a Losing One
💼 STMXUSDT: 2 Buying Areas
🐢 TURBOUSDT: Buy Zones and Buyer Presence
🌍 ICPUSDT.P: Massive Upside Potential | Check the Trade Update For Seeing Results
🟠 IDEXUSDT: Spot Buy Area | %26 Profit if You Trade with MSB
📌 USUALUSDT: Buyers Are Active + %70 Profit in Total
🌟 FORTHUSDT: Sniper Entry +%26 Reaction
🐳 QKCUSDT: Sniper Entry +%57 Reaction
📊 BTC.D: Retest of Key Area Highly Likely
📊 XNOUSDT %80 Reaction with a Simple Blue Box!
📊 BELUSDT Amazing %120 Reaction!
📊 Simple Red Box, Extraordinary Results
📊 TIAUSDT | Still No Buyers—Maintaining a Bearish Outlook
📊 OGNUSDT | One of Today’s Highest Volume Gainers – +32.44%
📊 TRXUSDT - I Do My Thing Again
📊 FLOKIUSDT - +%100 From Blue Box!
📊 SFP/USDT - Perfect Entry %80 Profit!
📊 AAVEUSDT - WE DID IT AGAIN!
I stopped adding to the list because it's kinda tiring to add 5-10 charts in every move but you can check my profile and see that it goes on..
SUI - Just one step away from the explosion!The last candle on the daily chart just confirmed a BOS (Break of Structure) — a clear and strong sign of bullish continuation for the asset.
✅ This is a textbook entry for a long position.
🎯 Next target: $5 — and so far, no bearish signs in sight.
Best regards,
Ceciliones 🎯
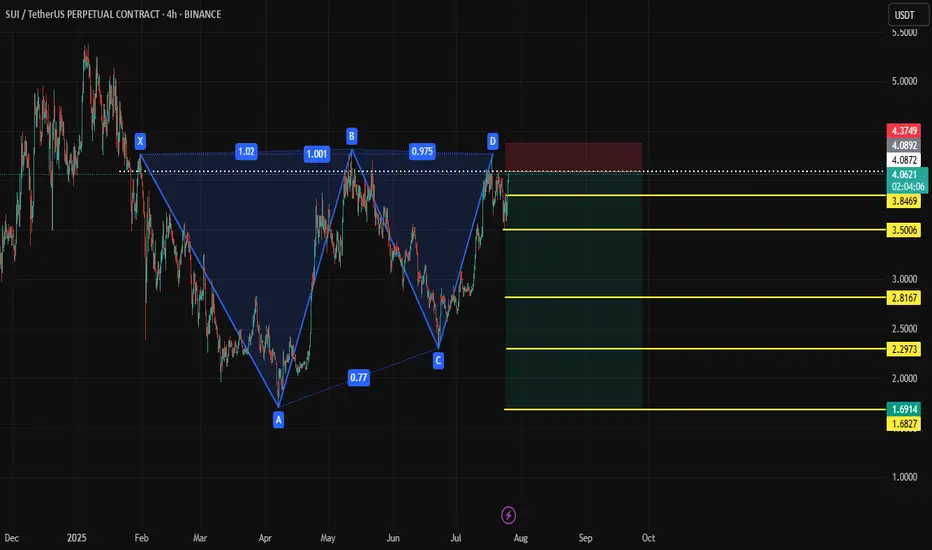
SUI Shortanalysis for sui bearish pattern
Short Entry: $4.10 – $4.20
Stop-Loss: $4.35+
Target 1: $3.60
Target 2: $3.10
Target 3 (Full XA move): ~$1.75 (aggressive)
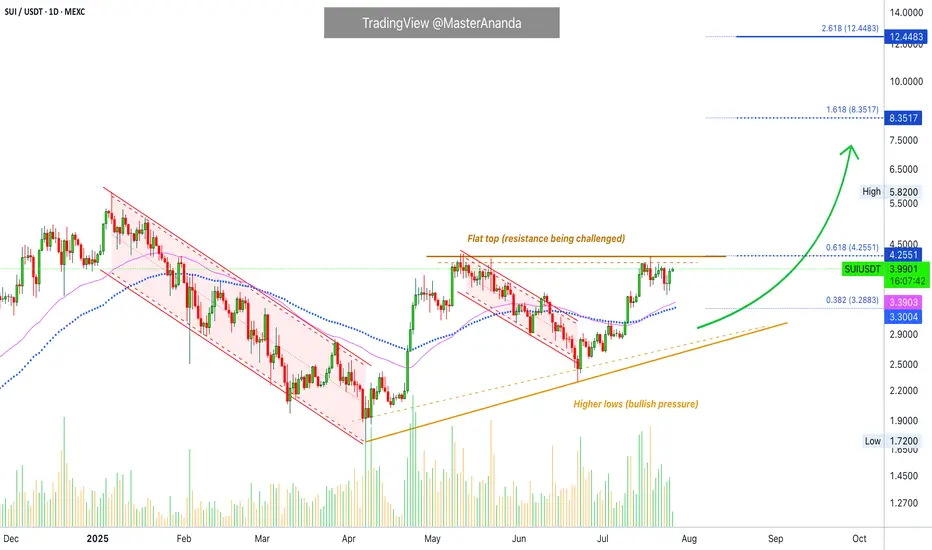
Sui Works To Break Resistance · Play To Win · No StressA flat bottom is bullish because support can be confirmed as found when sellers (bears) fail to move prices past a certain point. A flat bottom produces the double-bottom and triple-bottom reversal signals. When the bottom is flat, depending on the phase the market is going through, we can easily say bullish. A flat top is not bearish, it is a completely different story.
A flat top does not confirm resistance being found and thus a new bearish wave. We need context, it all depends on the phase of the market cycle. A flat top with a rising bottom is bullish. Resistance has been found and is being challenged. It is getting weaker because the action is converging towards the resistance point based on the rising bottom.
Here we have a flat top with a rising bottom (higher lows). The market is bullish. SUIUSDT has been bullish and growing since late 2024. This is the content we need. A bullish tendency, a rising market and resistance being challenged more than once starts to reveal a picture. Next this resistance won't have enough strength to hold. Next time SUI moves up it will continue rising to produce a new all-time high and this will unleash a price discovery phase.
SUIUSDT is trading above EMA55 and EMA89. The last challenge of resistance produced a rejection but this rejection did not lead to a test of the above mentioned support. Another signal of strength.
Sellers cannot push prices lower because buyers are active, or simply put, there are not enough sellers to start and thus the retraces become smaller and shorter. Price dynamics favoring the bulls.
The lows are getting higher, the top remains the same. When the low meets the top that is when resistance breaks. Sui is going up, it will continue to grow; the targets on the chart can be hit short-term.
There is no sense of urgency, but a major advance can be happening within days.
Are you ready to trade and hold? Prices going up aiming high trading requires no effort.
The effort is mental, the mind can be trained to succeed and avoid stress. Mental stress = lack of knowledge. If you know prices are going up and you feel certain about it, no effort is required to win because the mind doesn't have to struggle with questions relating to the strength of your position. The mind does not need to answer, should I buy or should I hold? Since you know prices are going up based on the chart, you can sit back and relax watching your profits grow. Reading relaxes the mind. Knowledge is food for the soul. The more you learn, the more you know the wiser you become. Wise means effortless. Trading can be effortless if you read the right stuff. Play to win. Plan before trading and you already won.
Answer the question before the situation shows up. That's it, you've just removed the complexity out of the game. When there is no complexity, there is no mental stress. Since you are sitting on a chair in front of a device, trading becomes effortless. To trade with peace in your mind you just need the right knowledge and that is what you are getting here. No stress.
Continue reading and watch your profits grow. Increase your peace, free up your time and enjoy better results.
Namaste.
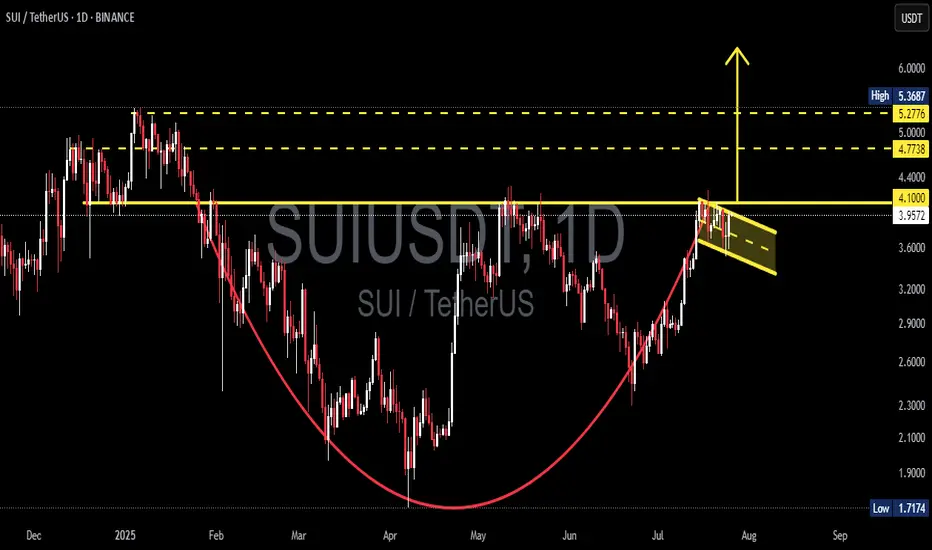
SUI/USDT Massive Cup and Handle Pattern Unfolding Is a Breakout?🧠 Technical Overview:
The daily chart of SUI/USDT showcases a textbook formation of the Cup and Handle pattern — a powerful bullish continuation signal that often precedes explosive upside moves.
The “Cup” took shape between January and July 2025, reflecting a deep rounding bottom. This indicates a long-term accumulation phase where bears gradually lose control.
The “Handle” is currently forming as a downward-sloping consolidation channel, often known as a bullish flag, which is typically the final pause before a breakout.
🔍 Key Technical Levels:
Current Price: $3.9661
Support Zone: $3.96
Major Resistance Levels to Watch:
$4.10 (handle resistance & breakout trigger)
$4.40 (local structural high)
$4.77 (previous high & fib extension zone)
$5.00 (psychological level)
$5.36 (measured move target from cup breakout)
---
🟢 Bullish Scenario: Breakout Incoming
If price breaks and closes above the handle resistance around $4.10, backed by increasing volume:
This confirms the Cup and Handle breakout.
Expect a rapid move toward $4.77 – $5.36 in the short to mid term.
The height of the cup projected upward gives a target of approximately +35% gain from breakout point.
🔔 Watch for:
Bullish engulfing candles
Volume spike during breakout
Break of upper trendline from the handle
---
🔴 Bearish Scenario: Breakdown Risk
If the price fails to hold the $3.96 support and breaks down from the handle channel:
Price may retest lower support zones near $3.60 or even $3.20
However, as long as the cup’s base at ~$2.50 holds, the macro bullish structure remains valid.
⚠️ Invalidation: A daily close below $3.60 would invalidate the short-term bullish setup.
---
📊 Pattern Psychology:
The Cup and Handle pattern reflects investor accumulation, shakeout, and renewed confidence. This is often seen in strong uptrending markets — and the current structure suggests that bulls are quietly preparing for a potential breakout.
---
📅 Timing Outlook:
Handle formations typically last between 1–3 weeks. If this timeline holds, a breakout could occur before mid-August 2025.
---
✅ Conclusion:
The technical setup for SUI/USDT is extremely compelling. With a strong Cup and Handle pattern nearing completion, and key resistance just overhead, traders should prepare for potential breakout conditions. A confirmed move above $4.10 could trigger a bullish wave toward $5.00+.
📌 Set alerts. Manage risk. And don’t ignore the volume.
#SUI #SUIUSDT #CryptoBreakout #CupAndHandle #BullishSetup #CryptoChartPatterns #AltcoinAnalysis #TechnicalAnalysis #BreakoutTrade
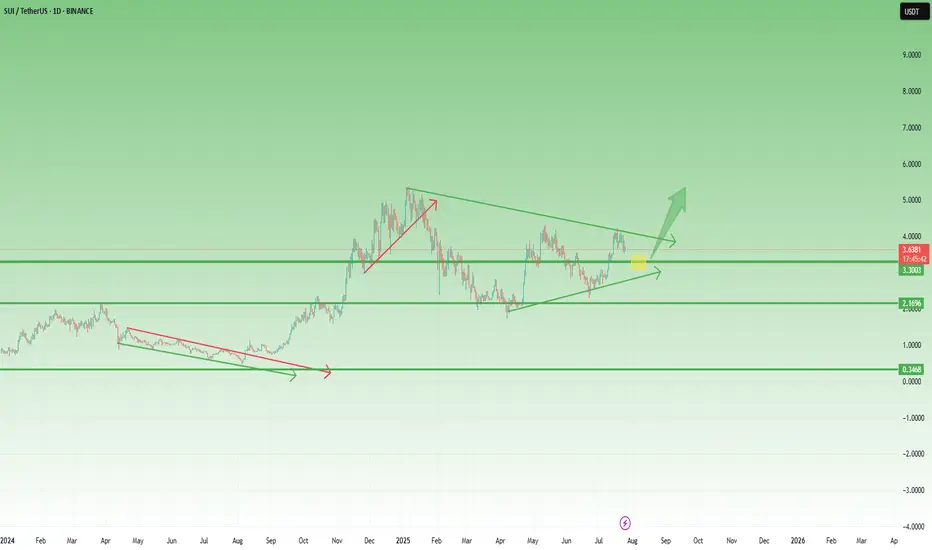
SUI – Preparing for a Breakout? Symmetrical Triangle in PlaySince the beginning of the year, SUI has been consolidating inside a classic symmetrical triangle — marked by higher lows and lower highs, a sign of tightening price action and growing pressure.
This kind of structure doesn’t last forever.
Usually, it ends with a strong breakout — especially if supported by volume.
🔍 What to watch:
- A break above the upper trendline could trigger a strong move, with potential targets in the $5 area and even a new ATH, if altcoins enter a real revival phase.
- On the flip side, $2.80 remains the key support level.
As long as it holds, bulls remain in control of the structure.
📍 My game plan:
I’m watching the $3.25 area as a potential buy zone —a great spot inside the pattern, offering tight risk and strong upside if the breakout comes.
Until then, it’s all about patience.
Pressure is building. The triangle is tightening.
And the market is waiting for a reason to move.
TradeCityPro | SUI Eyes Breakout with Bullish Momentum Rising👋 Welcome to TradeCity Pro!
In this analysis, I want to review the SUI coin for you. It’s one of the Layer1 projects in the crypto space, currently ranked 13 on CoinMarketCap with a market cap of $13.66 billion.
📅 Daily Timeframe
On the daily timeframe, a lot has changed for SUI since the previous analysis. After breaking the descending trendline, it has started a new bullish trend.
✔️ In the first bullish leg after breaking the trendline, the price reached the 4.0866 zone, and now after a correction, it’s moving upward again.
📈 The 4.0866 level is a very important resistance. In fact, we can draw a resistance range between 3.6402 and 4.0866, as the price tends to behave erratically within this zone.
⭐ Currently, the price has re-entered this range and if 4.0866 is broken, the bullish wave could continue. The first target for this wave could be 5.2689.
🔼 So, if 4.0866 is broken, I highly recommend opening a long position, because if the price truly breaks this level (and it’s not a fake breakout), then the minimum target would be 5.2689.
📊 If the buying volume continues to increase as it is now, and the RSI breaks above 76.64, the chances of breaking 5.2689 will also rise, and the price may even set a new ATH.
👀 I already have an open position on this coin based on lower timeframe triggers, and I’m currently waiting to see the reaction to 4.0866. Based on my entry, if the price moves toward 5.2689, the risk-to-reward ratio will be very high. That’s why I’ve kept part of my position open to potentially capture that move.
🛒 For spot buying, we can also use a futures strategy — meaning if 4.0866 breaks, we open a futures position targeting 5.2689, and then use the profit from that position to buy SUI in spot, gradually building our spot portfolio.
✨ If you are looking at this coin only for spot, the main trigger is the breakout of 5.2689. But be careful — if the price moves aggressively, it might not give you a proper entry trigger, and entering from that area might be difficult.
📝 Final Thoughts
This analysis reflects our opinions and is not financial advice.
Share your thoughts in the comments, and don’t forget to share this analysis with your friends! ❤️

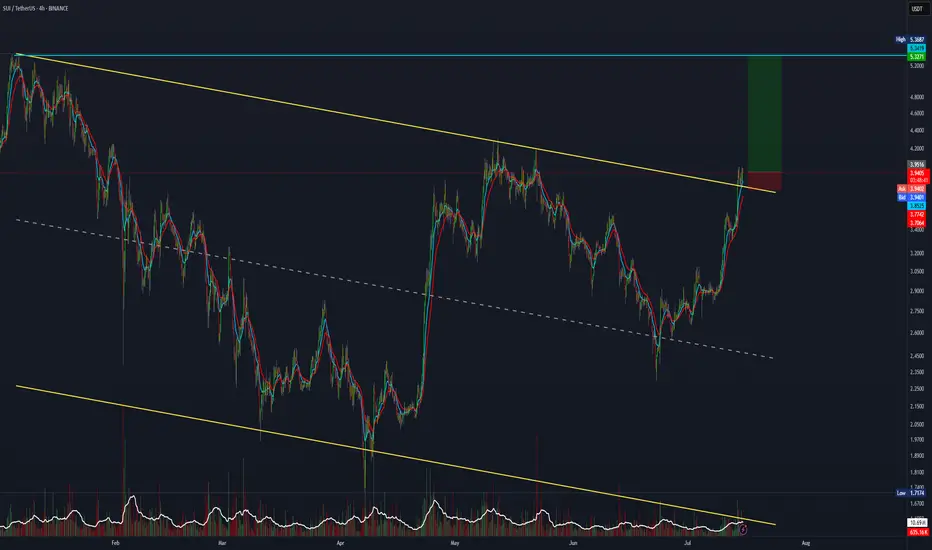
SUI trade setup with a 7:1 risk-to-reward ratio.SUI has broken out and retested the major channel. If you're bullish, this 7:1 R:R setup is worth considering.
Entry: 3.94
Stop Loss: 3.77
Target: 5.30.
SUI : HODL BASKETHello friends🙌
🔊We have come to introduce a signal that can be a good option for your investment portfolio.
Given that the price is in the ascending channel and has good support from buyers, it is expected that this time the price will break the middle line of the channel and move to the ceiling of the channel and succeed in reaching ATH...
Don't forget about capital and risk management.⚠
🔥Follow us for more signals🔥
*Trade safely with us*
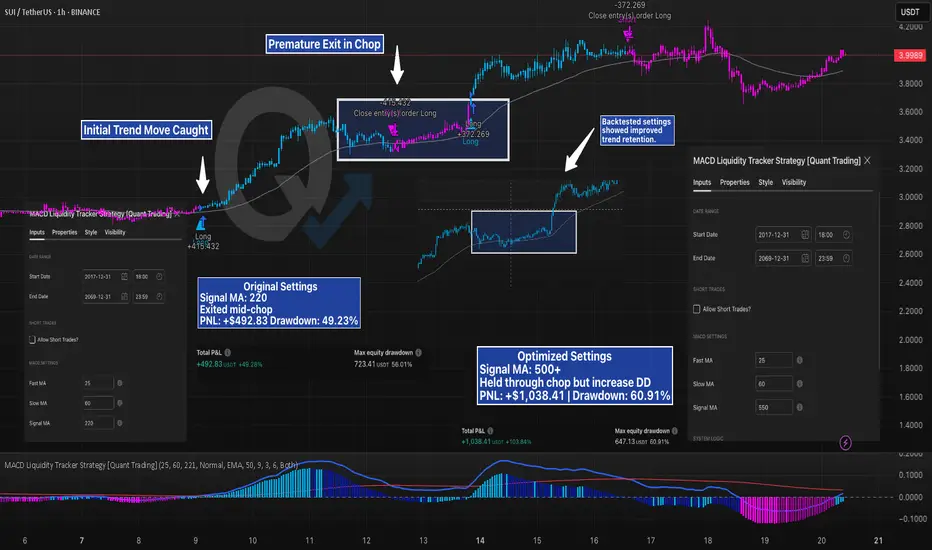
Mid-Chop Exit vs Trend Hold — How One Setting Changed EverythingSUI’s trend looked solid — but the strategy didn’t hold.
Using the MACD Liquidity Tracker Strategy with default settings (Signal MA = 220), the system caught the initial move well, but then exited during consolidation. It missed the continuation and had to re-enter late — resulting in more trades and reduced edge.
After running a few backtests, we increased the Signal MA to 550 to reduce early exits. The result:
Strategy held through the mid-trend chop
PNL more than doubled
Drawdown increased slightly, but the trade stayed intact
This is a perfect case study on how signal sensitivity affects trend behavior. Faster MAs respond quicker but tend to exit on noise. Slower MAs smooth it out — at the cost of larger swings.
Both versions are valid — but backtesting revealed which better fit this market structure.
No settings are one-size-fits-all — the key is understanding how each tweak behaves.
—
#SUIUSD #CryptoTrading #Backtesting #MACDStrategy #StrategyTweaks #LiquidityTracker #TradingEdge #QuantTradingPro #TradingView #TechnicalAnalysis
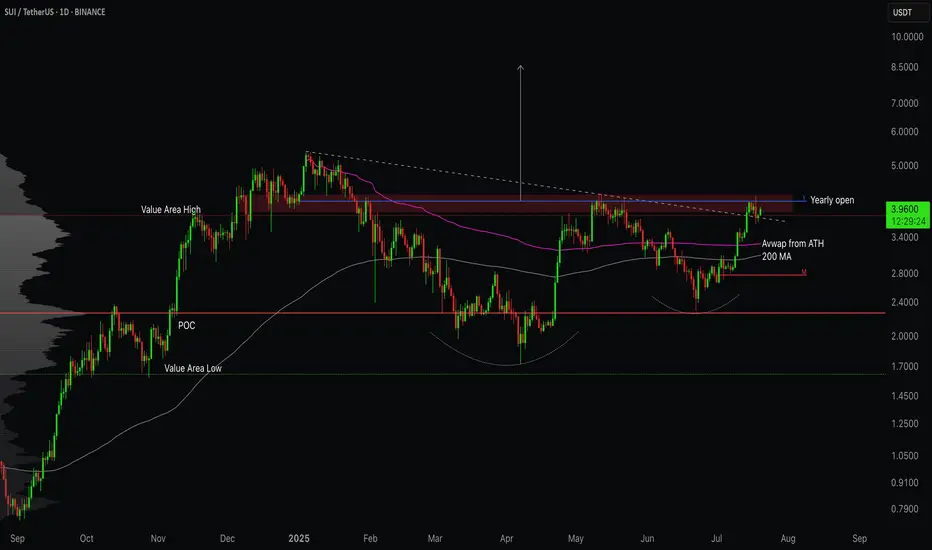
SUI/USDT - Testing the Top of ValueSUI is back in focus as price pushes into a critical zone of resistance that has capped previous rallies. With key moving averages reclaimed and volume shifting in favour of bulls, the question now is simple - can it break free, or is this another trap before rotation lower?
Let’s break down the current structure and what comes next!
SUI is trading at a critical inflection point after staging a strong recovery off the March and April lows . The broader context shows a market transitioning from a bearish phase into a more constructive accumulation structure. The recent price action has been guided largely by reclaiming key areas of previous acceptance and value.
However, sellers are still active at the upper bounds of this range. The next few sessions will determine whether SUI transitions into full breakout mode or requires further consolidation below resistance.
⦿ Volume Profile
The Value Area Low (VAL) is anchored around $1.62 . This area marked the exhaustion point for sellers, triggering the current recovery leg.
The Point of Control (POC), which represents the highest traded volume zone, sits at approximately $2.27 . This zone acted as a magnet for price through May and June and is now firmly reclaimed, reinforcing its importance as a structural support.
The Value Area High (VAH) comes in at $3.82 . Price has recently reclaimed this level, which suggests buyers have shifted control of the auction. Acceptance above the VAH often implies that the previous range is no longer valid and a new range expansion could be underway.
⦿ Key Technical Insights
Several technical levels align with this recovery. The 200-day MA and the anchored VWAP from the all-time high converge between $3.00 and $3.50. This area has been successfully reclaimed and held, adding further conviction to the bullish case.
Above current prices, $4.12 represents the Yearly Open and a clear horizontal supply level. The market has shown hesitation here, as expected. The price action suggests sellers are attempting to defend this zone, but the overall structure remains bullish as long as higher lows are maintained.
Support levels to monitor include $3.82, the Value Area High, and $3.50, where both the VWAP and the 200-day Moving Average provide dynamic support. Below that, the POC at $2.27 remains a crucial level of last defense for bulls.
⦿ Market Structure
Structurally, the market has transitioned from a downtrend into a rounded bottom formation, which typically precedes more sustained uptrends. The higher low structure since the March lows confirms this shift. The recent push above both the POC and VAH further validates the strength of this reversal.
Volume has supported this breakout. We saw clear expansion through the $3.00 handle, suggesting conviction among buyers. The visible consolidation just below $4.12 reflects natural supply pressure but not yet evidence of distribution.
⦿ Scenarios to Consider
1. Bullish Scenario:
If buyers manage to establish acceptance above $4.12, particularly with daily closes through this level, the path higher opens cleanly. The low-volume node between $4.12 and approximately $5.00 suggests limited resistance in this zone. Price could expand swiftly toward $5.36 to $6.00 as a first target.
2. Healthy Pullback Scenario:
Should price reject the $4.12 zone, a pullback toward $3.82 or even $3.50 would be healthy and expected. As long as the structure of higher lows remains intact and price holds above the reclaimed POC at $2.27, this pullback would likely serve as a base for the next leg higher.
3. Bearish Breakdown Scenario:
A sustained loss of $3.00 would be the first real warning sign for bulls. Breaking below the POC at $2.27 would suggest a failed breakout and could see the price cycle back toward the lower end of the volume profile, targeting $2.26 or even the Value Area Low at $1.62. However, given current strength, this scenario looks less likely unless broader market sentiment shifts.
I’m primarily focused on bullish scenarios or potential pullbacks, as the current market looks stronger compared to a few months ago. I believe we’re likely to see some decent long opportunities moving forward.
Let me know your thoughts in the comments! 👇
⚠️ Disclaimer
As always, this post is purely for educational purposes. I am not a financial advisor, and nothing here should be taken as financial advice. Always consult your financial advisor before making any investment or trading decisions. Or at the very least, consult your cat. 🐱