SUI Set for a 30% Move? Key Trade Setup InsideSUI/USDT is displaying a strong bullish recovery pattern on the daily chart. The pair has formed a textbook V-shaped reversal, bouncing sharply from the Support Level 2 at $1.7169. The trend has shifted from bearish to bullish, supported by the Auto Trend Line indicator which confirms the uptrend.
🔵 Bullish Structure Highlights
• Price has broken above the intermediate Support Level at $3.1691, converting it into a potential support zone.
• Current price action is hovering around $4.01, with bullish momentum aiming toward the ATH Resistance at $5.38.
• The sharp upward leg is part of a clear V-shaped recovery, suggesting a continuation toward previous highs.
🟢 Trade Setup (Bullish Swing Trade)
Trade Element Level (USD)
Entry Zone $3.73 – $4.01
Stop Loss $3.71
Take Profit $5.38
Risk:Reward ~4.6 R:R (approx.)
📌 Rationale
• The price is approaching a key psychological level and former resistance zone at $5.38, making it a logical profit target.
• A tight stop-loss at $3.71, just below recent consolidation, helps manage downside risk.
• The trend structure supports a bullish continuation pattern, likely driven by breakout traders.
⚠️ Risk Consideration
• If price closes below $3.71, the bullish structure may break down, invalidating the setup.
• Traders should always assess market conditions and manage leverage appropriately.
Suiusdt

SUI Scalp Long Setup – Low Leverage | High RR Trade Idea🔹 SUI Scalp Long Setup – Low Leverage | High RR Trade Idea 🚀
🟢 Entry: CMP $4
📉 Leverage: Low (Recommended)
🎯 Targets:
• TP1 – $4.0400
• TP2 – $4.0800
• TP3 – $4.1200
• TP4 – $4.2000
• TP5 – $4.2800
• TP6 – $4.3600
🔻 Stop Loss: 1hr or 2hr candle close below $3.9200
⚠️ Risk & Disclaimer:
This is a short-term scalp trade setup based on current market structure and price action.
• Use strict risk management.
• Trade with capital you can afford to lose.
• Not Financial Advice – Always DYOR (Do Your Own Research).
• Market conditions can change quickly – stay alert.

Market in Crab Mode, but $SUI Still within Trend – Bidding at $2Bidding CRYPTOCAP:SUI under $2.1.
Although the market looks weak right now, this seems like a simple retrace into a good area. If it manages to hold the weekly trend, I don't see any problem with placing bids in this zone.
I believe BTC will need to create a new yearly low around the 75-76k range for my bids to trigger. For now, I'm fine with waiting.
Still think March will be mostly sideways or down. BINANCE:SUIUSDT

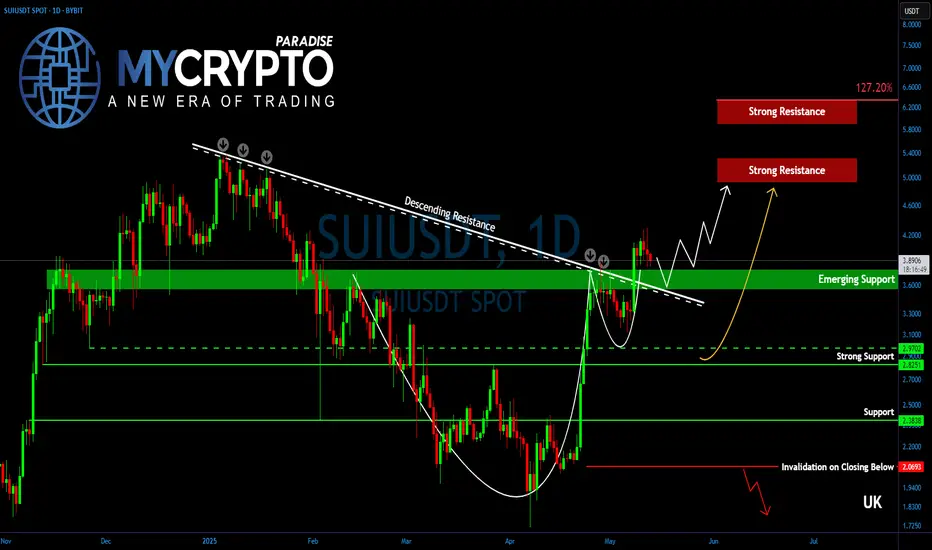
SUI Ready to Explode? Here’s What Happens NextYello, Paradisers! Is #SUI preparing for a fresh 52-week high? With a powerful pattern breakout and a golden cross in play, this could be the beginning of something big.
💎#SUIUSDT remains one of the strongest-performing altcoins in the current market cycle. The chart structure is now showing a cup and handle formation, paired with a clean breakout above a long-term descending trendline resistance—a combination that typically precedes strong bullish momentum.
💎At this stage, SUI is solidifying a newly-formed support zone between $3.80 and $3.60. If this support continues to hold, bulls are likely to drive price higher toward the $4.20 target, followed by a push into the $5.00 to $5.30 zone. This range marks the first major resistance cluster, as well as the previous all-time high region, and may trigger aggressive short-term profit-taking.
💎However, if bullish momentum remains intact, SUI could continue its rally toward the 127.20% Fibonacci extension level at $6.30. This is where caution becomes essential, as it represents a major technical target where price could stall or reverse.
💎Adding fuel to the fire, SUI has also confirmed a Golden Cross formation on the daily timeframe, with the EMA-50 crossing above the EMA-200. This is a powerful trend reversal signal that often acts as a driving force behind prolonged bullish movements.
Paradisers, strive for consistency, not quick profits. Treat the market as a businessman, not as a gambler.
MyCryptoParadise
iFeel the success🌴
SUI Pullback in Motion — Here’s Where the Smart Money Loads UpSUI is showing signs of exhaustion after failing to convincingly reclaim recent highs. Today’s price action delivered a strong clue: a sweep of the key high at $4.274 followed by a sharp rejection — Swing Failure Pattern (SFP).
Momentum is fading as volume dries up, and bulls have lost control of major levels:
❌ Yearly Open at $4.1225
❌ Weekly Level at $4.0921
This suggests a deeper correction may be underway before SUI can attempt another leg higher.
📌 Liquidity & Fib Levels in Focus
There’s still significant liquidity resting below the $3.80 zone — and the market often seeks to sweep such areas before reversing. Taking the Fib retracement from the $3.12 low to the $4.2989 high, we can identify two critical zones for a potential long entry:
0.5 Fib Retracement → $3.7095
This level not only sits just below the $3.80 liquidity shelf but also provides a strong technical anchor. If SUI finds support here, it could offer a solid long opportunity.
🎯 Trade Setup from the 0.5 Fib ($3.7095)
Entry: Around $3.71
Stop-Loss: $3.612
Target 1: $3.90 → R:R ≈ 2:1
Target 2: $4.587 (0.786 Fib Retracement) → R:R ≈ 9:1
Key Note: Watch the volume on the bounce — strong reaction = continuation potential; weak reaction = deeper retrace risk
🔸 Golden Pocket (0.618–0.666) Zone → $3.57-$3.52
If the 0.5 Fib bounce fails or lacks volume confirmation, price may dig deeper into the golden pocket — a historically strong reversal area. This zone becomes your next high-probability long setup to monitor.
🧠 Summary & Strategy
SUI showed rejection via SFP at key high ($4.274)
Lacking volume for immediate continuation
Next key long opportunity: $3.71 (0.5 Fib), SL at $3.612
If weak, watch $3.57 (golden pocket) as secondary entry
R:R potential ranges from 2:1 up to 9:1 depending on bounce strength
Let price come to you. Monitor reactions at each zone and don’t trade blindly into weakness. This is where patience and precision pay off. 💡
___________________________________
If you found this helpful, leave a like and comment below! Got requests for the next technical analysis? Let me know.

SUI Surfing Down to Support$4.10 is proving to be the current level of resistance.
I was really hopeful there was more runway up after reaching the $4.00 mark.
Note: This analysis is valid only if SUI falls below $4.07.
SUI is hitting resistance in the $4.00 to $4.10 range, so we may see some short-term rejection before the next move up to $4.20 and beyond.
With all of the good news regarding crypto deregulation in the U.S. and the innovation milestones at SUI, any move down toward $2.40 will likely be very short-lived.

SUI Cup & Handle formation!!!Consider the following narative, what currently looks like the completion of wave 5 after hitting $4.27 and now retracing to around $4.00, is actually a short pause or consolidation within a larger wave 5.
In Elliott Wave theory, waves occur in fractals, meaning:
A smaller 5-wave move (e.g., on a 1H chart) can be part of a larger Wave 3 or 5 on a higher timeframe (e.g., daily).
What looks like the “end” of Wave 5 may actually be the end of only a minor subwave within a much larger Wave 5.
Shown here is the 12 hour time frame and the Y-axis of the chart is set to logrithmic.
There is a cup and handle formation forming, and the current price range of $4.00 to $4.27 is actually the little pause... just like there was a little pause in the middle of wave 3.
This means we likely have more runnway to move further up to surpase $5.00.
On Monday morning the 12th of May, when the CME opens, and everyone's short on ETH gets liquidated there will be a huge jolt to the market.
Also... if certain members of the U.S. political narative get their act together and pass the stable bill reform on Monday, the crypto market will be doing a happy dance.
HOWEVER... if we fail to hold $3.90, then the move down will likely be near the $3.50 range that many people are predicting and that will be the handle of a larger cup & handle. If we hold above $3.90 then the bottom of wave 4 was the handle.

SUI Elliott Wave Meets Fibonacci: Wave 5 Setup ExplainedSUI has once again delivered a textbook display of wave structure, Fibonacci precision, and anchored VWAP interaction. After finishing Wave 4, price surged upward, tagging key fib levels and now consolidating at a critical decision point. The next high-probability trade opportunity is forming — and it’s one worth watching closely.
📈 Recap of the Current Move
After completing Wave 4, SUI surged right into the golden pocket — the 0.618 Fibonacci retracement of the entire 90-day downtrend (measured from the $5.3687 high to the $1.7174 low). That golden 0.618 sits at $3.9739, with price currently hovering just below at around $3.965.
In our previous analysis, we noted SUI’s tendency to respect trend-based Fib extensions. That pattern is holding beautifully.
Projecting from Wave 1 to Wave 2 of the current impulse wave, price once again nailed the 2.618 Fib extension — at exactly $4.10. That extension aligned perfectly with the 0.65 retracement of the 90-day wave at $4.0907, forming a significant resistance confluence.
2.618-1.618 fib:
The result? A healthy ~7% rejection, pulling SUI back into a support zone formed by three previously broken swing highs — $3.875, $3.8121, and $3.7666 — now acting as support.
🔺 Wave 4 Structure: Triangle Formation & Key Retest Levels
SUI has now been consolidating for ~1.5 days, and price structure shows a developing triangle — a classic Elliott Wave Wave 4 pattern.
But while triangles often resolve higher, we can’t ignore the Fibonacci roadmap:
The 1.618 trend-based Fib extension (drawn from Wave 1 → Wave 2) sits at $3.7619.
This level aligns almost perfectly with the key swing high at $3.7666.
In the previous Wave 3–4 sequence, price also retested the 1.618 extension — a pattern that could repeat now again.
So, despite the bullish triangle breakout potential, there’s still a high likelihood that price dips slightly to retest the 1.618 Fib zone at $3.76–$3.77.
📊 Anchored VWAP Confluence: Even More Support
To further strengthen this thesis, we’ve anchored VWAP from the recent swing low at $3.12. That VWAP (yellow line) now sits at $3.745 — just beneath the 1.618 Fib and in perfect confluence with the swing high cluster.
This creates a tight demand pocket between $3.74 and $3.77, where four technical tools align:
→ 1.618 trend-based Fib extension
→ Anchored VWAP from $3.12
→ Broken swing highs now acting as support
→ 0.382 Fib Retracement of Wave 3
This is where smart money looks to accumulate — not at the top of the triangle, but where liquidity gets transferred.
🧠 Outsmarting the Crowd: Trap & Trigger
Many breakout traders are positioning within the triangle, with stop-losses just beneath. If price dips into the $3.74–$3.77 range, it would sweep those stops and fill orders from traders waiting patiently at this confluence.
This creates a classic “switching hands” moment: breakout longs are stopped out, and Fibonacci-aligned buyers step in just as price hits the sweet spot.
To be part of the 1% in trading, you need to be thinking one step ahead — not where price is now, but where it needs to go to trap the many and reward the few.
🎯 Long Trade Setup
Entry Zone:
$3.77 preferred
Laddered from $3.76–$3.74
Stop-Loss Options:
Tight: Below $3.70 (2% buffer)
Loose: Below $3.52 (golden pocket of previous Wave 3)
Targets:
Conservative: $4.28
Primary: $4.41
Aggressive Extension: $4.5873 (0.786 retracement of full 90-day move)
R:R Potential:
Tight SL: ~2.5:1
Loose SL: 6:1+
📆 Weekend Trading Note
We’re currently in weekend session flow — often thinner liquidity and more prone to wicks. While the structure is strong, wait for confirmation and avoid FOMO entries at the top of the triangle.
✅ Wrapping It Up
SUI remains in a clean, bullish market structure and continues to respect Fibonacci and trend-based extensions to the letter. With price above key swing highs, holding structure, and anchored VWAP adding confluence, the $3.74–$3.77 zone is setting up as a high-probability entry for the next wave.
Smart money doesn’t chase — it anticipates. Be the 1% who sees beyond the triangle and understands where the real opportunity lies.
Happy Trading!
___________________________________
If you found this helpful, leave a like and comment below! Got requests for the next technical analysis? Let me know.

SUI/USDT Potential UpsidesHey Traders, in today's trading session we are monitoring SUI/USDT for a buying opportunity around 3.65 zone, SUI/USDT is trading in an uptrend and currently is in a correction phase in which it is approaching the trend at 3.65 support and resistance area.
Trade safe, Joe.

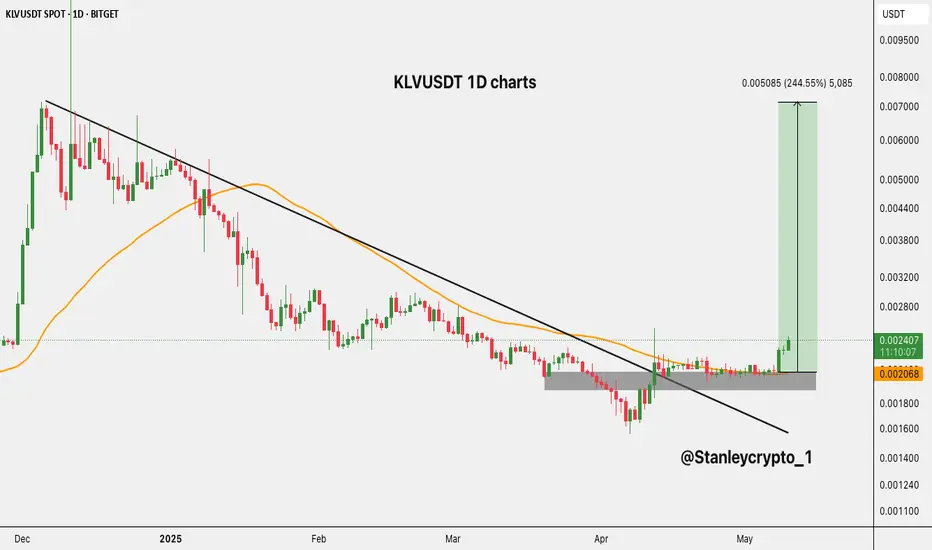
$KLV Breakout Alert!$KLV Breakout Alert!
Klever $KLV has officially broken out of its long-term downtrend line on the daily chart!
After months of consolidation in a tight accumulation zone, bulls have stepped in hard.
- Clean breakout from descending resistance
- Strong base formed around $0.00195–$0.00206
- Potential upside target: $0.007500 +244%
This move looks explosive.
Watch closely for continuation! DYRO, NFA
SUIUSDT Scalp Tradewait for to take out the downside liquidation first then enter invalidation 15m closing below the bullish ob, reclaim of 15m ob again also a long trigger. tp sl mentioned enjoy

$APT/USDT 12H Charts$APT/USDT – Long Trade Setup
- Entry Zone: CMP
Targets:
• TP1: $6.80
• TP2: $8.20
• TP3: $10.83
Stop Loss: $4.85
- Leverage Suggestion: Use 3–5x leverage max.
Breakout from long-term downtrend with bullish momentum building.
Trade with proper risk management!

#SUI/USDT#SUI
The price is moving within a descending channel on the 1-hour frame and is expected to break and continue upward.
We have a trend to stabilize above the 100 moving average once again.
We have a downtrend on the RSI indicator that supports the upward move with a breakout.
We have a support area at the lower limit of the channel at 3.82, which acts as strong support from which the price can rebound.
Entry price: 3.90
First target: 4.10
Second target: 4.32
Third target: 4.52

#SUI/USDT#SUI
The price is moving within a descending channel on the 1-hour frame and is expected to break and continue upward.
We have a trend to stabilize above the 100 moving average once again.
We have a downtrend on the RSI indicator that supports the upward move with a breakout.
We have a support area at the lower boundary of the channel at 3.35, which acts as strong support from which the price can rebound.
Entry price: 3.43
First target: 3.62
Second target: 3.80
Third target: 4.00

BTC.D : READY FOR ALT-SEASONHi Guys, Hope You well
As you can see, the trend is finally breaking and the downtrend is starting again for the growth of the altcoins in the market. I hope you get the best profits from this alt season, which may be the last alt season and the best in this market cycle.
SecondChanceCrypto
⏰ 9/May/26
⛔️DYOR

SUI all aboard...!!! The SUI train is leaving the station!Looks like retracement wave 4 has finished around $3.12, and we are now in wave 5. Wave 3 can never be the shortest of waves 1, 3, and 5. But wave 5 is often 0.618 or 1.0 times the length of wave 1 or wave 3.
Today, a bullish announcement that U.S. banks can legally custody crypto for clients was made.
I think this is the catalyst that will cause wave 5 to be almost as big as wave 3.
Also BTC at the time of this writing is 99K+ and nearing the psychological milestone of 100k!
The SUI train has left the station!

SUI/USDT: From Base Building to BreakoutSUI’s daily chart embodies textbook base‐and‐breakout dynamics. Having bottomed near $1.91, reclaimed key demand at $2.28, and smashed through successive dynamic resistances, the chart now projects a clear path toward prior supply at $4.60 and beyond. That said, every breakout merits healthy skepticism: a retest of the $3.35–3.60 zone—and its ability to hold—will be the acid test of true strength.
Next Steps for the Trader/Investor: monitor volume and price action in the coming sessions, be ready to buy on a clean retest, and manage risk tightly below invalidation levels. If SUI can sustain above $4.00 and flip former resistance into support, we may be witnessing the dawn of its next up-cycle.

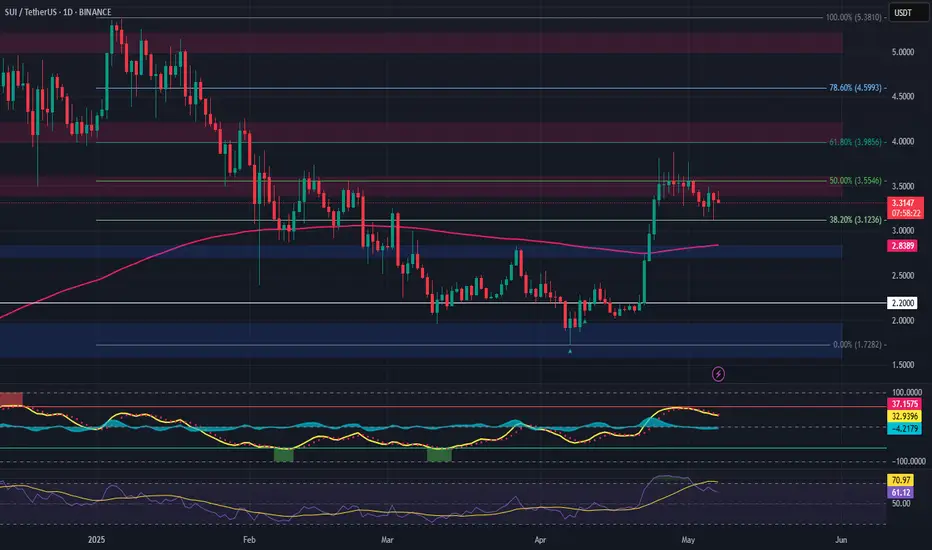
Sui: Your Altcoin ChoiceThe action is happening right above 0.786 Fib. retracement level support. Above it, the actual level wasn't hit and this is a signal of strength.
I looked at this chart when the action was happening above 0.618 and mentioned that it could drop further before the start of the next bullish wave. See what happened, as soon as the next support gets challenged, volume goes up. This is significant volume in comparison with the daily average. The highest volume since November 2024.
This volume signal can be easily translated as support found. Support found means that the down-move is no more. The down-move being over invariably leads to change. Change means the market won't be dropping no more. If it was going down, soon, SUIUSDT should start to grow. That's my conclusion based on the data coming from the chart.
Even if prices move a bit lower, the bullish bias still remains. There is an ending diagonal on the chart. This pattern tends to show up before a change of trend. The correction is over. It is only a matter of time before the next bullish wave.
Thanks a lot for your amazing and continued support. It is truly appreciated.
It is not possible to project an accurate ATH for this pair because the chart is too young. Relevant numbers for 2025 are $9.42 and $15.24.
Namaste.

SUI ANALYSIS📊 #SUI Analysis
✅There is a formation of Descending Channel Pattern in daily time frame in #SUI .
Also there is a perfect breakout and retest. Now we can expect a bullish move. If the price successful retest the major support zone then we will see more bullish move
👀Current Price: $3.89
🎯 Target Price : $4.25
⚡️What to do ?
👀Keep an eye on #SUI price action and volume. We can trade according to the chart and make some profits⚡️⚡️
#SUI #Cryptocurrency #Breakout #TechnicalAnalysis #DYOR

$Bitcoin approaching ATHBitcoin approaching ATH 👀
CRYPTOCAP:BTC breaks out of a multi-month descending triangle and flips key resistance into support.
Now pushing toward the $110K zone, a consolidation range is expected just below the all-time high.
Momentum looks strong.
ATH, retest soon?

SUI – Long Trade Setup After Trend ReversalSUI has broken out of its downtrend, hitting all prior upside targets and now pulling back toward a key support area and the 200-day EMA, potentially forming a higher low—an ideal spot for re-entry.
🔹 Entry Zone:
Around $2.80
🎯 Take Profit Targets:
🥇 $3.40 – $3.60
🥈 $4.00 – $4.20
🥉 $5.00 – $5.20
🛑 Stop Loss:
Daily close below $2.20
📌 Strategy Notes:
Look for bullish confirmation (e.g., wick rejections, bullish engulfing candle) near $2.80
Structure remains intact as long as price holds above $2.20
EMA retests often precede strong continuation if trend strength remains
TradeCityPro | SUI: Bullish Push Faces Key Resistance Test👋 Welcome to TradeCity Pro!
In this analysis, I want to review the SUI coin for you. It's one of the DeFi layer-1 projects that was highly hyped in 2024 and has recently gained renewed attention due to some news from the project.
🔍 This project's coin, with the symbol SUI, has reached a market cap of $11.3 billion, ranking it 11th on CoinMarketCap.
📅 Daily Timeframe
As you can see in the daily timeframe, since the last analysis I shared in this channel, the price has rebounded from the support zone I highlighted and, after breaking the trendline, made a bullish leg up to 3.6402.
📊 A significant amount of buying volume has entered the market, and the RSI has entered Overbuy territory. These two factors drove the bullish move, and the 3.6402 resistance is a key level that has temporarily held off further price increases.
✔️ Currently, we’re seeing a few corrective candles that caused the price to reject from this resistance, but it's holding up well and still looks poised to move back toward this level.
🛒 For spot buying, if the price moves back toward this area, you can enter a position on a break of 3.6402. The next trigger is the break of 4.0866, and the main resistance ahead is 5.2689.
🔽 If a correction occurs, support levels are 2.7830 and 2.2495. If price retraces, these can serve either as short targets or long entry zones depending on the price reaction.
📉 Confirmation of trend reversal would come if the price fails to make a higher high above 3.6402 and breaks the current low. After that, we can consider opening a short position.
📝 Final Thoughts
This analysis reflects our opinions and is not financial advice.
Share your thoughts in the comments, and don’t forget to share this analysis with your friends! ❤️

SUI Drip Drip Driping DownSUI is looking more like it's 4th wave is going to go down a bit more before it can bounce up to $4.00. I really was hopeful that May 5th's $3.26 was it's recent retracement bottom... but it looks like we are about to revisit $3.26 and go even lower.
My target range is between $2.80 and $3.08, with my best guess as $2.88 as it will touch a previous high and will settle near the fib golden zone.
At the time I am posting this, the price is hovering around $3.24 and BTC is nearing 94k.
I think the market overall is going to be very nervious on 6 May, the day before the Fed's 7th May meeting.
