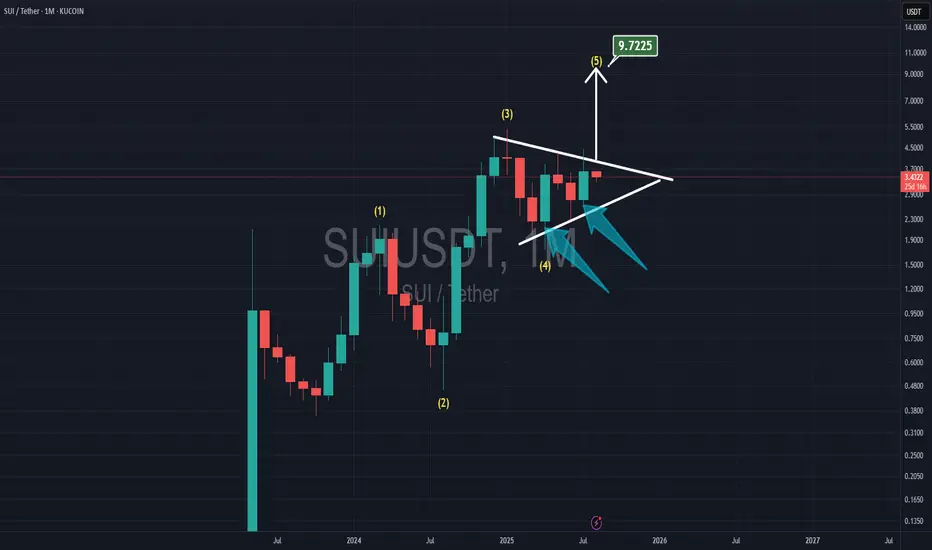
SUI TO $10.00With Elliot waves count, now SUI is in the 5th wave.
It has 2 bullish monthly candles for April & July, and SUI is playing inside the triangle which shows me with the breakthrough the resistance, the target is at $10
Suiusdtidea
#SUI/USDT 4H: Broke out of a falling wedge with bullish momentum#SUI/USDT 4H: Broke out of a falling wedge with bullish momentum, now holding an ascending trendline. Watch for a retest around $3.40–$3.20. Holding above this zone targets $4.00 and $4.80. A break below $3.00 invalidates the setup.

SUI Swing Buy / Long SetupSui is on Strong and decision Order block on 1 day Timeframe, If we break this then SUI will take correction till recent weekly low. If we hold this then new ath. Book some or 80% on mentioned area, rest hold till 6$.

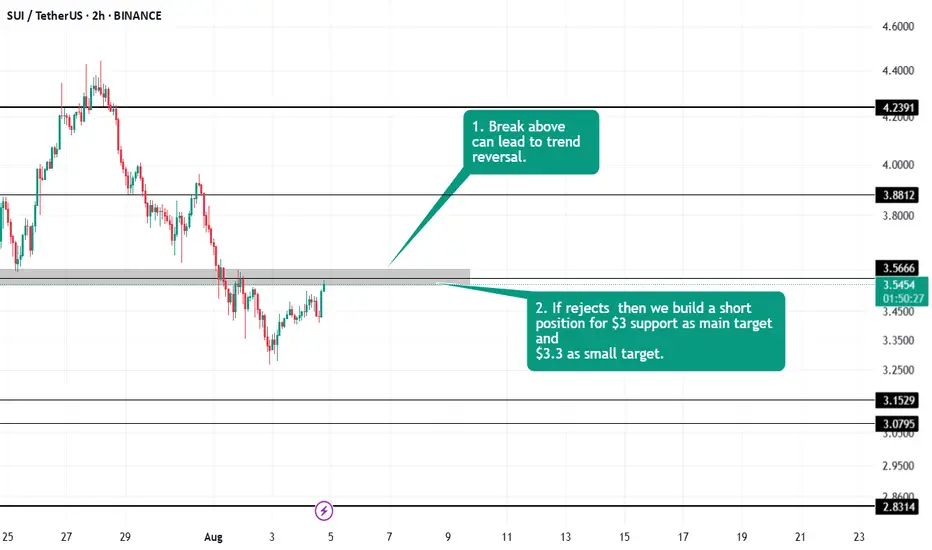
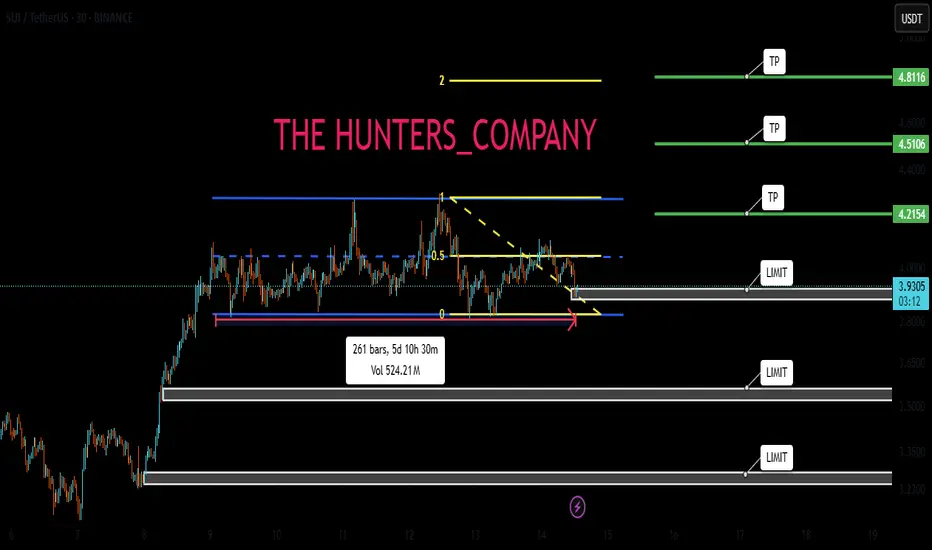
#SUI TRADE PLAN Closely monitoring the trade. Would update once a decision candle is formed.
Keep watching

SUI / USDT : Looking bullish SUI/USDT chart shows a breakout from a descending trendline, confirming upward momentum. Current price tests the resistance zone around $4.00. BTC is receiving support from the FVG, indicating short-term bullish potential.
Bullish Scenario: If price breaks above the resistance zone, a rally towards $4.50 to $5.00 is possible. Watch for confirmation of higher highs on shorter timeframes.
Invalid Setup: If price fails to break the resistance and falls back below $3.50, the bullish setup would be invalidated.
Pro Tip: Always wait for a clear confirmation candle above the resistance zone before entering a trade to minimize risk.

SUI new trend started!SUI / USDT
Price broke out after long accumulation range with good volume
Looks like a new bullish trend has started

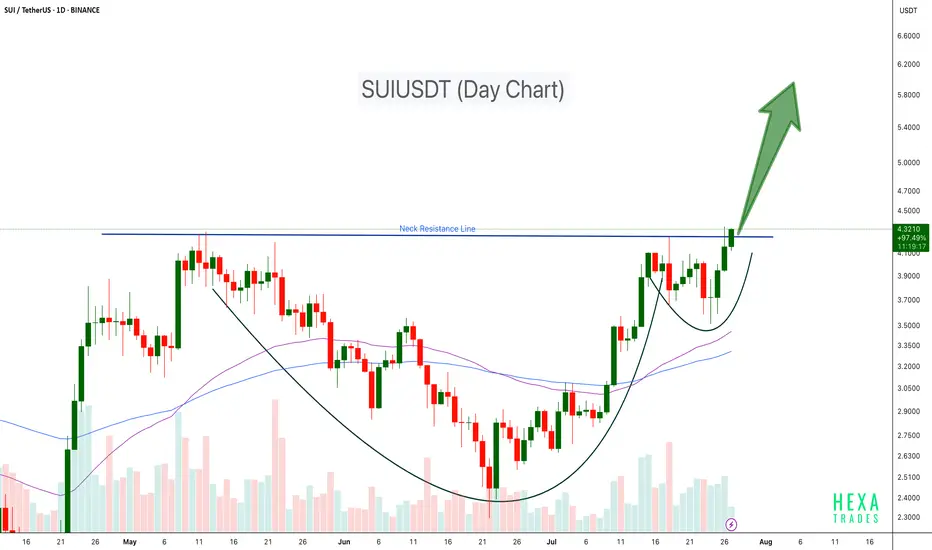
SUIUSDT Cup & Handle Breakout SUI has formed a classic Cup and Handle pattern on the daily chart and has now successfully broken above the neckline resistance around $4.30. This breakout could trigger a strong bullish continuation if volume sustains and retests hold.
Key Points:
Pattern: Cup and Handle
Breakout Level: ~$4.30 (neck resistance)
Potential Upside Target: $5.50 – $6.00+ based on pattern projection
Support Zone: $3.50
Confirmation: Sustained volume and close above neckline
Cheers
Hexa
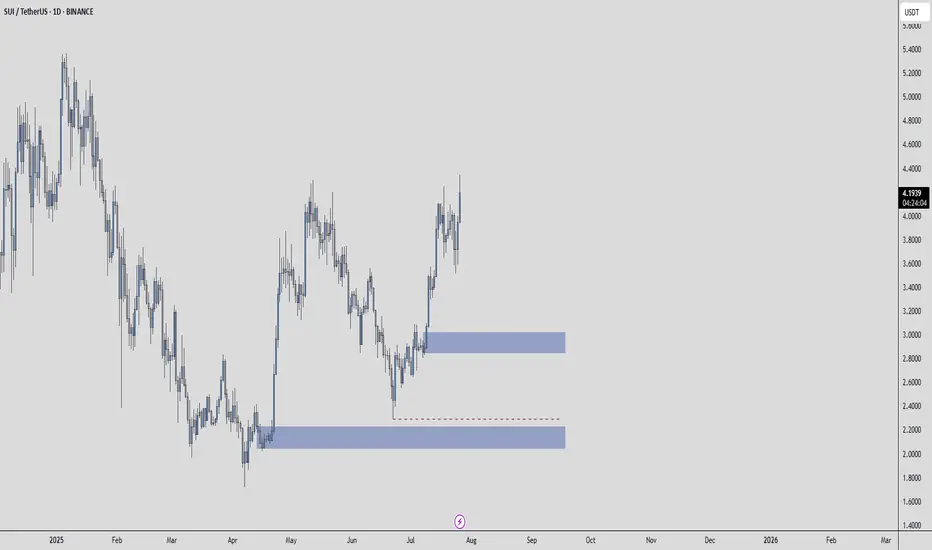
SUIUSDT – A Setup Worth WatchingThe blue box isn't just a zone, it’s a place where value and timing intersect.
🟦 Context
If price enters this area with control:
It aligns with past volume cluster support
A clean 1H break and confirmation may unlock high R:R potential
Structure + patience = confidence
📌 Execution Plan
🧭 No need to predict.
Just observe:
✅ Does the blue box hold with absorption or slowdown?
✅ Does CDV remain constructive?
✅ Does the 1H chart break and confirm direction?
If yes, there’s asymmetry on your side.
And that’s when smart trades happen.
"It’s not about being early. It’s about being right when it matters."
— And that starts with a prepared eye and a defined plan.
📌I keep my charts clean and simple because I believe clarity leads to better decisions.
📌My approach is built on years of experience and a solid track record. I don’t claim to know it all but I’m confident in my ability to spot high-probability setups.
📌If you would like to learn how to use the heatmap, cumulative volume delta and volume footprint techniques that I use below to determine very accurate demand regions, you can send me a private message. I help anyone who wants it completely free of charge.
🔑I have a long list of my proven technique below:
🎯 ZENUSDT.P: Patience & Profitability | %230 Reaction from the Sniper Entry
🐶 DOGEUSDT.P: Next Move
🎨 RENDERUSDT.P: Opportunity of the Month
💎 ETHUSDT.P: Where to Retrace
🟢 BNBUSDT.P: Potential Surge
📊 BTC Dominance: Reaction Zone
🌊 WAVESUSDT.P: Demand Zone Potential
🟣 UNIUSDT.P: Long-Term Trade
🔵 XRPUSDT.P: Entry Zones
🔗 LINKUSDT.P: Follow The River
📈 BTCUSDT.P: Two Key Demand Zones
🟩 POLUSDT: Bullish Momentum
🌟 PENDLEUSDT.P: Where Opportunity Meets Precision
🔥 BTCUSDT.P: Liquidation of Highly Leveraged Longs
🌊 SOLUSDT.P: SOL's Dip - Your Opportunity
🐸 1000PEPEUSDT.P: Prime Bounce Zone Unlocked
🚀 ETHUSDT.P: Set to Explode - Don't Miss This Game Changer
🤖 IQUSDT: Smart Plan
⚡️ PONDUSDT: A Trade Not Taken Is Better Than a Losing One
💼 STMXUSDT: 2 Buying Areas
🐢 TURBOUSDT: Buy Zones and Buyer Presence
🌍 ICPUSDT.P: Massive Upside Potential | Check the Trade Update For Seeing Results
🟠 IDEXUSDT: Spot Buy Area | %26 Profit if You Trade with MSB
📌 USUALUSDT: Buyers Are Active + %70 Profit in Total
🌟 FORTHUSDT: Sniper Entry +%26 Reaction
🐳 QKCUSDT: Sniper Entry +%57 Reaction
📊 BTC.D: Retest of Key Area Highly Likely
📊 XNOUSDT %80 Reaction with a Simple Blue Box!
📊 BELUSDT Amazing %120 Reaction!
📊 Simple Red Box, Extraordinary Results
📊 TIAUSDT | Still No Buyers—Maintaining a Bearish Outlook
📊 OGNUSDT | One of Today’s Highest Volume Gainers – +32.44%
📊 TRXUSDT - I Do My Thing Again
📊 FLOKIUSDT - +%100 From Blue Box!
📊 SFP/USDT - Perfect Entry %80 Profit!
📊 AAVEUSDT - WE DID IT AGAIN!
I stopped adding to the list because it's kinda tiring to add 5-10 charts in every move but you can check my profile and see that it goes on..
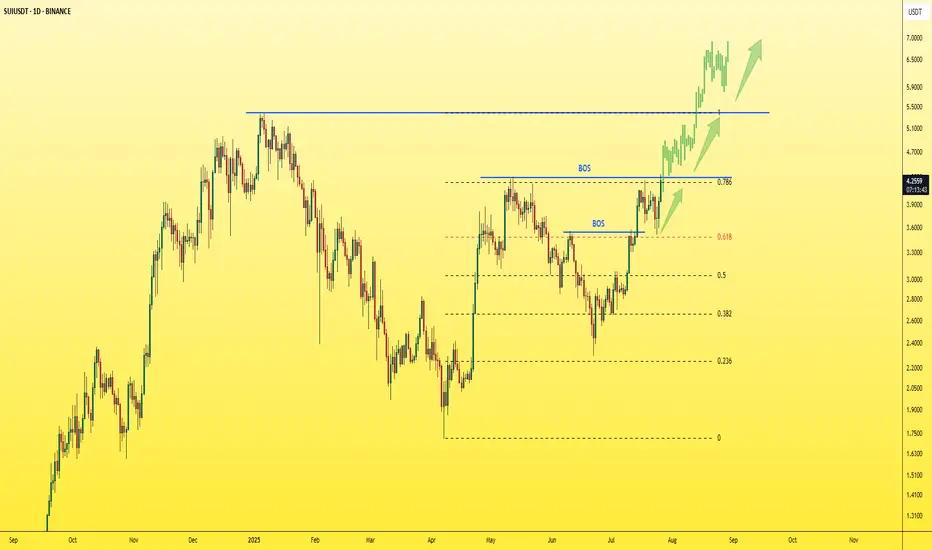
SUI - Just one step away from the explosion!The last candle on the daily chart just confirmed a BOS (Break of Structure) — a clear and strong sign of bullish continuation for the asset.
✅ This is a textbook entry for a long position.
🎯 Next target: $5 — and so far, no bearish signs in sight.
Best regards,
Ceciliones 🎯
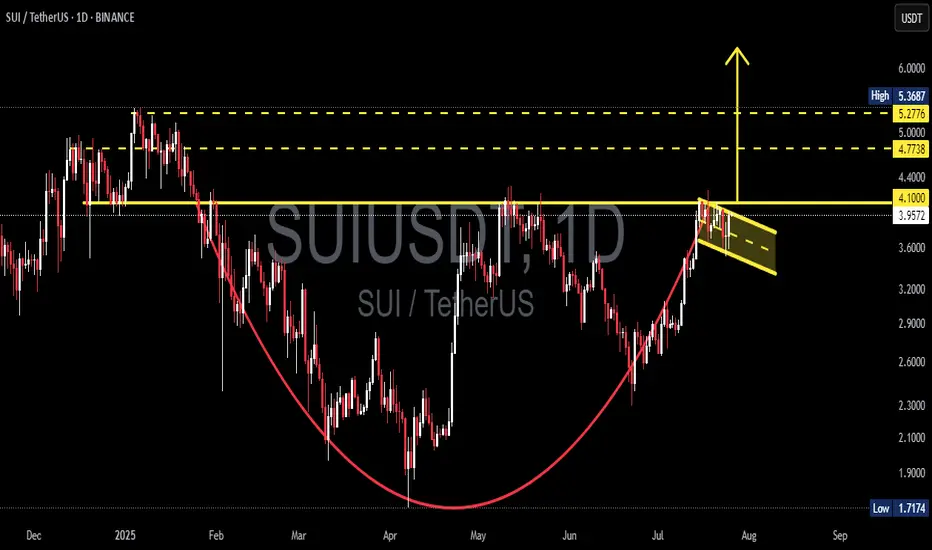
SUI/USDT Massive Cup and Handle Pattern Unfolding Is a Breakout?🧠 Technical Overview:
The daily chart of SUI/USDT showcases a textbook formation of the Cup and Handle pattern — a powerful bullish continuation signal that often precedes explosive upside moves.
The “Cup” took shape between January and July 2025, reflecting a deep rounding bottom. This indicates a long-term accumulation phase where bears gradually lose control.
The “Handle” is currently forming as a downward-sloping consolidation channel, often known as a bullish flag, which is typically the final pause before a breakout.
🔍 Key Technical Levels:
Current Price: $3.9661
Support Zone: $3.96
Major Resistance Levels to Watch:
$4.10 (handle resistance & breakout trigger)
$4.40 (local structural high)
$4.77 (previous high & fib extension zone)
$5.00 (psychological level)
$5.36 (measured move target from cup breakout)
---
🟢 Bullish Scenario: Breakout Incoming
If price breaks and closes above the handle resistance around $4.10, backed by increasing volume:
This confirms the Cup and Handle breakout.
Expect a rapid move toward $4.77 – $5.36 in the short to mid term.
The height of the cup projected upward gives a target of approximately +35% gain from breakout point.
🔔 Watch for:
Bullish engulfing candles
Volume spike during breakout
Break of upper trendline from the handle
---
🔴 Bearish Scenario: Breakdown Risk
If the price fails to hold the $3.96 support and breaks down from the handle channel:
Price may retest lower support zones near $3.60 or even $3.20
However, as long as the cup’s base at ~$2.50 holds, the macro bullish structure remains valid.
⚠️ Invalidation: A daily close below $3.60 would invalidate the short-term bullish setup.
---
📊 Pattern Psychology:
The Cup and Handle pattern reflects investor accumulation, shakeout, and renewed confidence. This is often seen in strong uptrending markets — and the current structure suggests that bulls are quietly preparing for a potential breakout.
---
📅 Timing Outlook:
Handle formations typically last between 1–3 weeks. If this timeline holds, a breakout could occur before mid-August 2025.
---
✅ Conclusion:
The technical setup for SUI/USDT is extremely compelling. With a strong Cup and Handle pattern nearing completion, and key resistance just overhead, traders should prepare for potential breakout conditions. A confirmed move above $4.10 could trigger a bullish wave toward $5.00+.
📌 Set alerts. Manage risk. And don’t ignore the volume.
#SUI #SUIUSDT #CryptoBreakout #CupAndHandle #BullishSetup #CryptoChartPatterns #AltcoinAnalysis #TechnicalAnalysis #BreakoutTrade
SUI – Preparing for a Breakout? Symmetrical Triangle in PlaySince the beginning of the year, SUI has been consolidating inside a classic symmetrical triangle — marked by higher lows and lower highs, a sign of tightening price action and growing pressure.
This kind of structure doesn’t last forever.
Usually, it ends with a strong breakout — especially if supported by volume.
🔍 What to watch:
- A break above the upper trendline could trigger a strong move, with potential targets in the $5 area and even a new ATH, if altcoins enter a real revival phase.
- On the flip side, $2.80 remains the key support level.
As long as it holds, bulls remain in control of the structure.
📍 My game plan:
I’m watching the $3.25 area as a potential buy zone —a great spot inside the pattern, offering tight risk and strong upside if the breakout comes.
Until then, it’s all about patience.
Pressure is building. The triangle is tightening.
And the market is waiting for a reason to move.
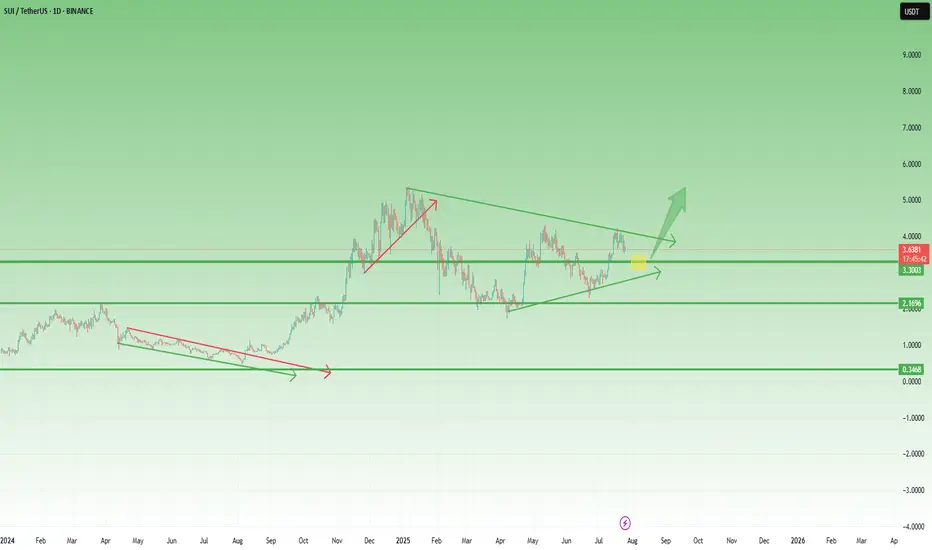
SUI : HODL BASKETHello friends🙌
🔊We have come to introduce a signal that can be a good option for your investment portfolio.
Given that the price is in the ascending channel and has good support from buyers, it is expected that this time the price will break the middle line of the channel and move to the ceiling of the channel and succeed in reaching ATH...
Don't forget about capital and risk management.⚠
🔥Follow us for more signals🔥
*Trade safely with us*
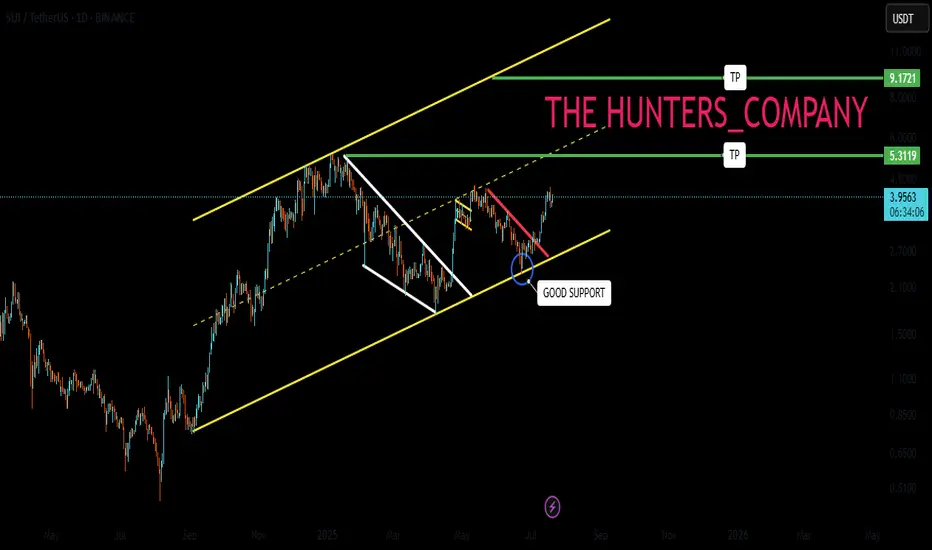
SUIUSDT Breaks Out of Triangle – Eyes on $10BINANCE:SUIUSDT daily chart has confirmed a breakout above a symmetric triangle resistance line within a larger ascending channel, signaling strong bullish momentum. Price has reclaimed the 100 and 200 EMAs, and the breakout is backed by rising volume. This setup opens the door for a potential rally toward the $10.00 level, with price currently holding above key structure support around $4.00. As long as this level holds, continuation toward the upper trendline remains likely. CRYPTOCAP:SUI

Will key support be held or broken today?Hello friends
According to the complete analysis we conducted on this currency, we concluded that the price correction can continue with the failure of the specified support and go to lower supports, but if buyers support the price in the support area, it can have a good rise.
Note that with capital and risk management, you can buy in steps in the specified support areas and move with it to the specified targets.
*Trade safely with us*

Sui update hello friends👋
✅️Considering the drop we had, now the price has reached an important and good support and the price has been supported by the buyers and the downward trend line has broken and the ceiling has been raised. Considering this, it was possible to enter into the transaction with capital and risk management and move to the specified goals with it.
🔥Join us for more signals🔥
*Trade safely with us*

Will suffering be broken today?Hello friends
Given the good price rise, you can see that the price has entered a range, which indicates that it is gathering strength for its next move.
Now we can buy in steps with risk and capital management and move with it to the specified targets.
*Trade safely with us*
SUIUSDT Forming Falling WedgeSUIUSDT is currently showing a very strong bullish technical setup as it forms a classic falling wedge pattern, which is widely known in crypto trading for its high probability of signaling a reversal to the upside. The pattern, combined with increasing volume, is suggesting that buyers are stepping in to absorb the remaining supply. With an expecting gain projection of 90% to 100%+, this crypto pair is gaining a lot of attention from traders looking for high-reward opportunities in the altcoin market.
SUI is an emerging project that has been gaining momentum thanks to its innovative technology and scalable blockchain infrastructure. The community around SUI continues to grow, fueled by new partnerships, ecosystem development, and increased investor confidence. This fundamental growth aligns well with the technical breakout setup, making the current price action even more interesting for swing traders and long-term holders alike.
The support zone that has formed around the base of the wedge pattern appears to be holding firmly, providing a solid foundation for a potential rally. If SUIUSDT manages to confirm its breakout and attract further buying volume, traders could see a strong move toward the next resistance levels. Monitoring on-chain activity, sentiment, and overall market conditions will be key to navigating this move efficiently.
✅ Show your support by hitting the like button and
✅ Leaving a comment below! (What is You opinion about this Coin)
Your feedback and engagement keep me inspired to share more insightful market analysis with you!

#SUI Ready to Grow up?#SUI
The price is moving within a descending channel on the 1-hour frame and is expected to break and continue upward.
We have a trend to stabilize above the 100 moving average once again.
We have a downtrend on the RSI indicator that supports the upward break.
We have a support area at the lower boundary of the channel at 2.83, acting as strong support from which the price can rebound.
We have a major support area in green that pushed the price higher at 2.75.
Entry price: 2.87.
First target: 2.95.
Second target: 3.04.
Third target: 3.14.
To manage risk, don't forget stop loss and capital management.
When you reach the first target, save some profits and then change your stop order to an entry order.
For inquiries, please comment.
Thank you.

SUIUSDT3.19$ best price for pollback need for pump BINANCE:SUIUSDT . but for trust bullish trend, need for breaked 3.29$.
Best support: 3.025 - 2.91 $
Best resistance: 3.29 - 3.393 - 3.563 $
Contorl Risk management for trades.

SUIUSDT 1D Analysis SUI ~ 1D Analysis
#SUI Buy gradually from this support block with short term target of at least 15%+, Long term target $11

Sweep. Reaction. Shift. That’s not noise — that’s the model inBINANCE:SUIUSDT just tapped the lower boundary of its STB 5M, and the market responded instantly.
This wasn’t support. This was engineered liquidity — and it triggered precisely where Smart Money waits.
Here’s the structure:
Price ran the range low and tagged the STB, aligning with 0.618 at 3.1833
This reaction builds into a reclaim of the 1H OB — the same inefficiency that broke structure last time
Next draw is the 0.382 retracement at 3.2631, then 3.3124 — both short-term targets
If volume and structure align, the full reprice to 3.3922 becomes the higher-timeframe objective
Anything below 3.1265 breaks the current long bias — invalidation is clear.
Execution map:
Longs are valid as long as price holds above 3.183
TP1: 3.2631
TP2: 3.3124
Full target: 3.3922
Invalidation: Close below 3.1265
Price isn’t turning because of hope. It’s rotating because it fulfilled its algorithmic sweep.
More setups like this — clean, intentional, and early — are in the profile description.

SUI analysis In this video I go through the recent bullish trend in SUI and anticipate where I think the retrace will take us for a possible long entry . I also highlight a possible short setup off of the Value area high if it comes in .
Tools used in the video TR Pocket / Fibs , Volume Profile and Pivots .
Appreciate your support any questions then please leave them in the comments
Have a great day
