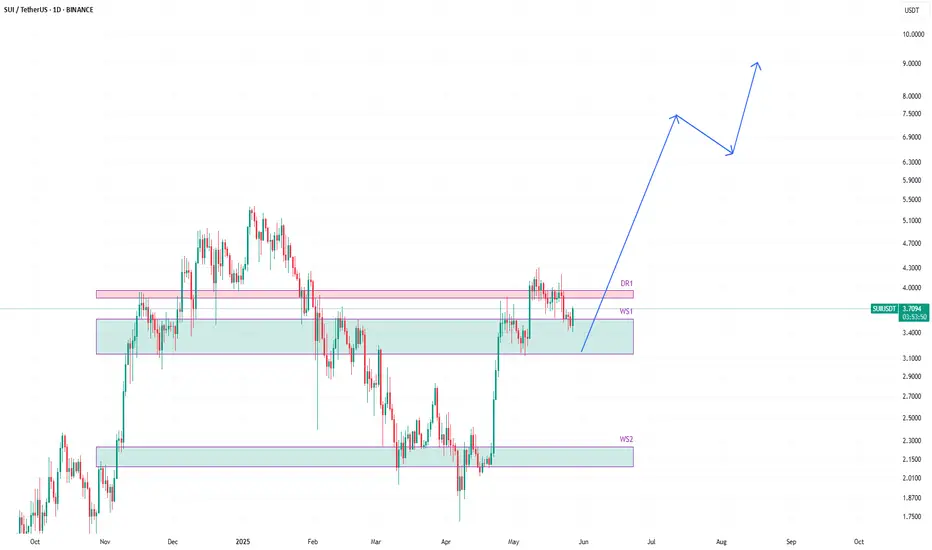
SUIUSDT likely to head higher towards 9$SUIUSDT is very bullish. I think this is just a pullback on this upward journey that it started at the begninning of april 2025.
The price is currently trading around weekly support WS1. It is possible that it might retrace further, but upward journey for this one in coming weeks in highly likely.
A good bounce from weekly support, we can already witness, and this could be the start of the journey already.
But as mentioned before, some further retracement before resuming upwards joeuney cannot be ruled out.
I am slowly adding this one as I am pretty confident that this one is going to do well in the coming weeks/months.
What do you think?
Suiusdtidea
#SUI/USDT#SUI
The price is moving within a descending channel on the 1-hour frame, adhering well to it, and is heading for a strong breakout and retest.
We are seeing a bounce from the lower boundary of the descending channel, which is support at 3.64.
We have a downtrend on the RSI indicator that is about to be broken and retested, supporting the upward trend.
We are looking for stability above the 100 Moving Average.
Entry price: 3.70
First target: 3.77
Second target: 3.84
Third target: 3.96

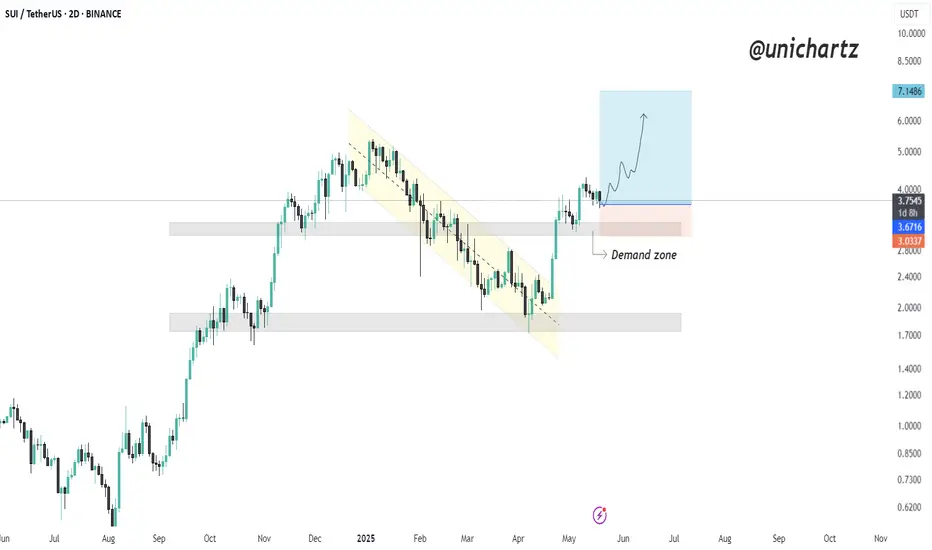
SUI Retesting Demand Zone After Bullish BreakoutSUI has broken out of a downward channel after weeks of selling pressure, signaling a major shift in momentum.
The price found strong support at the demand zone, then made an impulsive move up — confirming bullish intent.
DYOR, NFA
SUI📈 SUI/USDT 4H Analysis
SUI is moving strong in an ascending channel, now testing key resistance at 3.71 🚀
🟢 Support Levels:
🔹 3.47 – recent pullback
🔹 3.15 – channel bottom
🔴 Resistance Levels:
🔹 3.71 – under pressure
🔹 4.27 – next target
🔹 4.64 – strong resistance
🔹 4.83 – major zone
📊 Bulls holding the ground as long as the trend stays intact!

SUI Structure Complete – Time for Pain or Profit?Yello Paradisers, have you noticed how calm #SUIUSDT has been lately? Feels like nothing’s happening... but that's exactly how the market sets the trap before it strikes. The recent price action has lulled many into a false sense of comfort, trading tightly in a sideways structure after a strong impulsive leg. But behind that calm surface, a bigger move is loading — and only those who can read the structure properly will be prepared for it.
💎#SUI has now completed its 5-wave Elliott impulse, finishing with a classic Ending Diagonal in the fifth wave, which very often signals the final push before a correction. Given the current price action, we are likely in the early formation of an ABC corrective structure, most probably a Zigzag or Flat formation. This transition is crucial — many traders misinterpret this as the start of a new trend and get trapped. But as professionals, we know that this is not the time to rush into positions. This early corrective phase often includes fakeouts and liquidity grabs, punishing both longs and shorts before clarity returns.
💎SUI has been trading with high volatility compression, coming off a significant bullish breakout that began around early April. The rally initiated with a textbook Leading Diagonal, moved into a sharp Wave 3 impulsive expansion, and finally started to slow down into what looked like exhaustion through Wave 5. During this phase, price carved out a Contracting Triangle (Falling Wedge), providing a resting phase before the final fifth wave. But right after the Ending Diagonal was completed, momentum has stalled, and now we're entering a very tricky part of the market cycle — the corrective phase.
💎Zooming out, the entire structure has unfolded in a methodically clean and technically sound manner. Wave 1 kicked off the move with a Leading Diagonal, signaling the early stages of bullish initiation. This was followed by a shallow Wave 2 retracement, which is typical of fast, trending markets. Wave 3 then expanded with strong bullish momentum, confirming the impulse. After that, Wave 4 transitioned into a Contracting Triangle (Falling Wedge) — a classic consolidation pause before the final push. Finally, Wave 5 wrapped up the sequence with an Ending Diagonal, a clear sign of momentum exhaustion. This full five-wave development marks a textbook impulsive structure, and strongly suggests that we are now entering a critical transition phase, where the market moves from trending into correction. These are often the most deceptive parts of the cycle — known for shakeouts, liquidity traps, and emotional whiplash for those who act too soon.
💎Looking ahead, the next probable strong move depends on how price reacts around the key S/R level at $3.006. If this zone holds and the correction stays controlled above it, we can prepare for a powerful continuation leg back toward the $4.20 resistance, and potentially challenge the major resistance at $4.80–$5.00. However, if the correction unfolds deeper, a full retest of the $2.40–$2.00 range is absolutely on the table. This zone aligns with macro demand levels and could act as a reload zone for the next major impulse. But only once the correction completes.
💎One of the main hurdles SUI now faces is breaking cleanly above $4.20 — this is the near-term barrier where supply pressure remains strong. Beyond that, $4.75–$5.00 is a macro resistance zone that needs significant volume and structure to crack. Until then, any sharp move upward could just be part of a larger fakeout inside the corrective pattern.
💎On the downside, our key invalidation level sits just below $3.00. A 12H candle close below $3.006 would confirm that the support zone is lost and shift our bias into a much deeper retracement phase. This would invalidate any early bullish setups and bring the $2.40–$2.00 zone in play, with liquidity likely waiting beneath that structure.
This is the point where the weak hands get shaken out and smart money reloads. If you're aiming for long-term success, wait for high-probability setups and protect your capital. Strive for consistency, not quick profits. Treat the market as a businessman, not as a gambler.
MyCryptoParadise
iFeel the success🌴

SUI Looks Ready for the Next Leg Up | Bullish Structure IntactClean structure, clean bounce 💪
SUI holding trendline + previous support zone
Breakout from triangle = next wave incoming? 🚀
Let’s see how it plays out!
#SUI #CryptoAnalysis #TechnicalAnalysis

SUI Set for a 30% Move? Key Trade Setup InsideSUI/USDT is displaying a strong bullish recovery pattern on the daily chart. The pair has formed a textbook V-shaped reversal, bouncing sharply from the Support Level 2 at $1.7169. The trend has shifted from bearish to bullish, supported by the Auto Trend Line indicator which confirms the uptrend.
🔵 Bullish Structure Highlights
• Price has broken above the intermediate Support Level at $3.1691, converting it into a potential support zone.
• Current price action is hovering around $4.01, with bullish momentum aiming toward the ATH Resistance at $5.38.
• The sharp upward leg is part of a clear V-shaped recovery, suggesting a continuation toward previous highs.
🟢 Trade Setup (Bullish Swing Trade)
Trade Element Level (USD)
Entry Zone $3.73 – $4.01
Stop Loss $3.71
Take Profit $5.38
Risk:Reward ~4.6 R:R (approx.)
📌 Rationale
• The price is approaching a key psychological level and former resistance zone at $5.38, making it a logical profit target.
• A tight stop-loss at $3.71, just below recent consolidation, helps manage downside risk.
• The trend structure supports a bullish continuation pattern, likely driven by breakout traders.
⚠️ Risk Consideration
• If price closes below $3.71, the bullish structure may break down, invalidating the setup.
• Traders should always assess market conditions and manage leverage appropriately.

SUI Scalp Long Setup – Low Leverage | High RR Trade Idea🔹 SUI Scalp Long Setup – Low Leverage | High RR Trade Idea 🚀
🟢 Entry: CMP $4
📉 Leverage: Low (Recommended)
🎯 Targets:
• TP1 – $4.0400
• TP2 – $4.0800
• TP3 – $4.1200
• TP4 – $4.2000
• TP5 – $4.2800
• TP6 – $4.3600
🔻 Stop Loss: 1hr or 2hr candle close below $3.9200
⚠️ Risk & Disclaimer:
This is a short-term scalp trade setup based on current market structure and price action.
• Use strict risk management.
• Trade with capital you can afford to lose.
• Not Financial Advice – Always DYOR (Do Your Own Research).
• Market conditions can change quickly – stay alert.

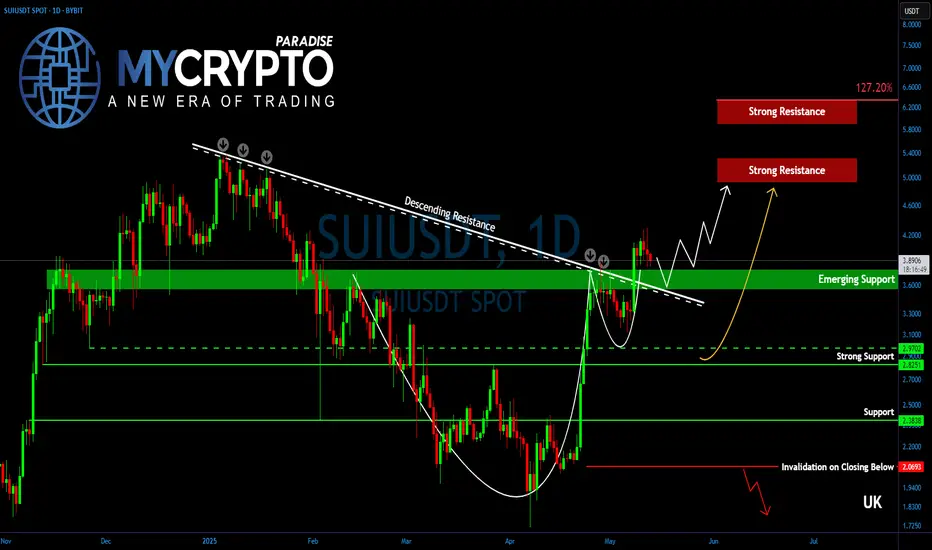
SUI Ready to Explode? Here’s What Happens NextYello, Paradisers! Is #SUI preparing for a fresh 52-week high? With a powerful pattern breakout and a golden cross in play, this could be the beginning of something big.
💎#SUIUSDT remains one of the strongest-performing altcoins in the current market cycle. The chart structure is now showing a cup and handle formation, paired with a clean breakout above a long-term descending trendline resistance—a combination that typically precedes strong bullish momentum.
💎At this stage, SUI is solidifying a newly-formed support zone between $3.80 and $3.60. If this support continues to hold, bulls are likely to drive price higher toward the $4.20 target, followed by a push into the $5.00 to $5.30 zone. This range marks the first major resistance cluster, as well as the previous all-time high region, and may trigger aggressive short-term profit-taking.
💎However, if bullish momentum remains intact, SUI could continue its rally toward the 127.20% Fibonacci extension level at $6.30. This is where caution becomes essential, as it represents a major technical target where price could stall or reverse.
💎Adding fuel to the fire, SUI has also confirmed a Golden Cross formation on the daily timeframe, with the EMA-50 crossing above the EMA-200. This is a powerful trend reversal signal that often acts as a driving force behind prolonged bullish movements.
Paradisers, strive for consistency, not quick profits. Treat the market as a businessman, not as a gambler.
MyCryptoParadise
iFeel the success🌴
SUI/USDT Long Entry at 3.507 (10x Leverage) | Strategy in PlayEntered a long position on CRYPTOCAP:SUI at 3.507 with 10x leverage. Current price action is hovering near entry. Watching key levels:
🔹 Target Zone: 3.8760+
🔻 Support Zone: ~3.25 (highlighted for potential SL zone)
🧠 TP (Take Profit) and SL (Stop Loss) will be updated as the move develops.
Keep an eye on price reaction around the support-resistance flip zone.

#SUIUSDT: Will Bulls Continue The Move Upwards of $8?The price of BINANCE:SUIUSDT has been bullish since completing its accumulation phase and is currently in the distribution phase. It has shown a strong change of character, with a steady move. However, a short-term correction is expected to fill the gap that the price has left behind.
In a bullish scenario, prices often continue their upward trend without making corrections, and this could be the case with this crypto pair as well. At the moment, we recommend monitoring the price momentum and entering trades according to your trading plan.
We have set three targets based on your bias, but please note that these are not a confirmation of buy or sell. They are simply our overview of the trade and are limited to the knowledge and experience of our traders.
Wishing you good luck and safe trading!
Thank you for your unwavering support! 😊
If you’d like to contribute, here are a few ways you can help us:
- Like our ideas
- Comment on our ideas
- Share our ideas
Team Setupsfx_
❤️🚀

SUIUSDT - Don't wait for pullback!SUI is the star of this season — on the 3-day chart, it just broke out of a falling wedge pattern with a massive green candle.
The price also reacted strongly to the 0.618 Fibonacci level, indicating there’s still plenty of upside potential ahead.
Don’t wait for pullbacks — coins like this rarely give clear entry opportunities, and any correction is usually very shallow.
It’s either you buy now, or regret it later.
Best regards Ceciliones 🎯

SUI whats the target ?SUI / USDT
SUI is just following my scenario 2 in previous analysis.. click here
What next ? :
With current big price surge we are looking for previous ATH , after that the main resistances are: 7$ and 9$/10$
They are considered very strong resistance but if the price could overcome them we will see SUI flying like never before
Always do risk management
Make your plan and dont FOMO
Best of wishes

SUI/USDT:BUYHello friends
Due to the price correction, we can buy in two designated areas in a stepwise manner. Elite with capital and risk management.
*Trade safely with us*

SUI Breaks Key Trendline – Bullish Reversal in MotionCRYPTOCAP:SUI has broken above the descending resistance line, confirming a trend reversal after weeks of downward movement. This breakout came after price bounced from a strong support zone, establishing a higher low structure.
The breakout is also supported by a move above the 50 EMA, adding strength to the bullish case.
DYOR, NFA

SUIUSDT 1DSUI ~ 1D Analysis
#SUI If you lose the opportunity for Coin CRYPTOCAP:AVAX 2021, don't lose Coin #Sui 2025. This coin will follow #Avax success in 2021

SUI/USDT:BUY LIMITHello friends
Due to the heavy price drop, it can be seen that the buyers have supported the price well at the specified support and by hitting higher ceilings and floors, they are giving us a sign that they have good strength. Now we can buy in steps with capital and risk management and move to the specified targets.
Don't forget to save profit on each target.
*Trade safely with us*

SuiUsdt Trade setup 12-15% upside ??recent impluse momentum with a formation of HL on 1h could be a sign of trend change
trade entry at2.300 to 2.350 demand zone further up at 2.5 can be the potential pullback area and could then face resistance at 2.65
and considering the down side risk at 2.200 can be the stop loss as it is recent low that bulls will try to defend

#SUI/USDT#SUI
The price is moving within a descending channel on the 1-hour frame and is expected to continue lower.
We have a trend to stabilize below the 100 moving average once again.
We have a downtrend on the RSI indicator, supporting the upward move with a break above it.
We have a resistance area at the upper limit of the channel at 2.55.
Entry price: 2.52
First target: 2.40
Second target: 2.32
Third target: 2.20

SUI/USDT long/buyBy utilizing Fibonacci retracement levels, historical patterns, , we can formulate a hypothesis that the market might follow a similar trajectory if bullish sentiment prevails.

SUI Rebounds from Key Demand Zone – Bullish Continuation Ahead?SUI has recently bounced from a key supply and demand zone between the 0.618 ($2.36) and 0.786 ($1.52) Fibonacci retracement levels, showing strong buyer interest in this range. This zone also coincides with a previous resistance line that has now flipped into support, adding further confluence to this area as a significant level for trend continuation.
After pulling back from its recent high around $5.44, SUI respected the 0.618 Fib level and has begun to recover, currently trading around $2.71. If momentum continues, the next resistance levels lie at the 0.5 ($2.95) and 0.382 ($3.54) Fib levels, followed by a potential move back toward the $4.26 zone.

SUI - Last Growth Ahead Before Bear MarketHello, Skyrexians!
It's time to update BINANCE:SUIUSDT idea. Last time we pointed out that wave 3 has been finished and correction incoming. Now we are seeing this correction. Today we got the indicating that correction is over and we can see the great growth soon.
Let's look at the weekly chart. Here we can see the Elliott waves structure. Wave 3 has been finished at the recent top. Awesome oscillator gives us the hint that bull run will continue, but now that much because we have only wave 5 ahead which has a target $5-7 in the next 3-6 months. The strong confirmation that correction is over is the green dot on the Bullish/Bearish Reversal Bar Indicator below the alligator's lines.
Best regards,
Skyrexio Team
___________________________________________________________
Please, boost this article and subscribe our page if you like analysis!

SUIUSDT 5DSUI ~ 5D Analysis
#SUI Buy and hold, coin blue chip that might be included in the Top 10 Marketcap list.
Target $10 ++
