SUIUSDT: Breakout + Retest = Lift-Off Soon!BINANCE:SUIUSDT has shown impressive strength, bouncing back with solid volume after hitting a major weekly support level. This bullish reaction suggests a potential move toward higher highs, making it an attractive opportunity for long-term investors. Entering a position in the spot market and holding for the long term could yield significant gains.
On the 4-hour chart, SUI is forming an ascending triangle pattern. After breaking out, it has successfully retraced and is now gearing up for a strong swing move. Traders can consider entering at this level and look to book profits as the price climbs higher. As always, managing risk with a proper stop loss is crucial.
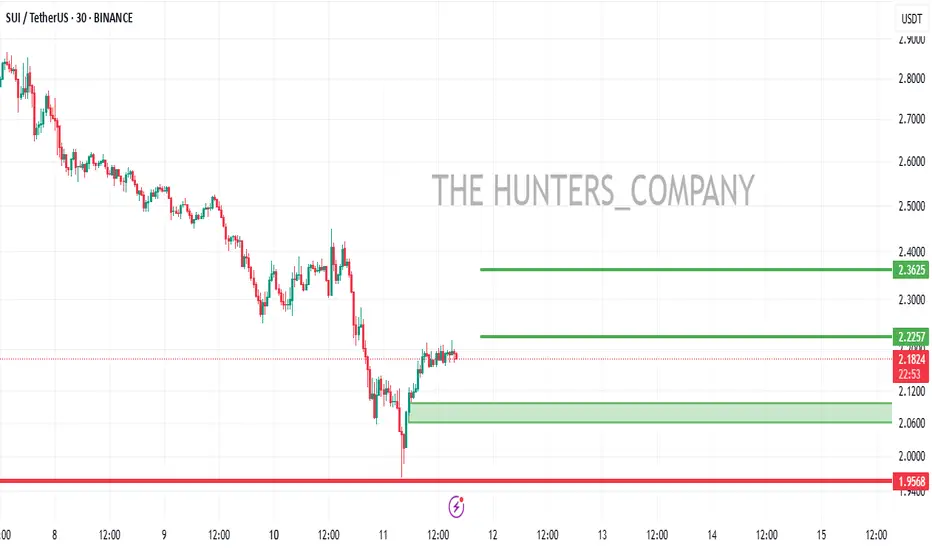
BINANCE:SUIUSDT Currently trading at $2.4
Buy level : Above $2.4
Stop loss : Below $2.15
Target : $3.5
Max leverage 3x
Always keep stop loss
Follow Our Tradingview Account for More Technical Analysis Updates, | Like, Share and Comment Your thoughts
Suiusdtidea

SUI/USDTHello friends
Due to the recent decline, we have found a good support area for you, if it is reached, you can buy and move to the specified targets.
*Trade safely with us*
#SUI/USDT#SUI
The price is moving in a descending channel on the 1-hour frame and is adhering to it well and is heading to break it upwards strongly and retest it
We have a bounce from the lower limit of the descending channel, this support is at a price of 2.36
We have a downtrend on the RSI indicator that is about to break and retest, which supports the rise
We have a trend to stabilize above the Moving Average 100
Entry price 2.44
First target 2.51
Second target 2.64
Third target 2.78

SUI/USDT UPDATE Hello friends
Given the floor that the price has made, we now see the power of buyers in the price reversal, and given the power of buyers, we can make purchases, of course, in stages and with capital management and move with it to the specified goals.
*Trade safely with us*

SUIUSDT 8HSUI ~ 8H Analysis
#SUI On the time frame 8H, Selling pressure on this coin seems to have been completed. Buy after successfully penetrating this resistant line with a minimum target of 10%+.

A GREAT OPPORTUNITY JUST CAME UP! LONGS OR SHORTSHi everyone!
While everyone believes that SUI/USDT is the real deal, Our experienced team has another opinion!
While SUI shows accumulative signals and bullish pattern to confuse all of us the retail traders..
We working very hard guys for you in order to reach the financial freedom!
SUI/USDT is about to crash!!!
And we talk at least for a 30% drop.. Yes you read very well!
Now here is the thing.. You have to manage your risk!
You have to be prepared for a 20% pump, that's why you are not opening big positions straight away. Spread your capital for every 5%.. And when the price will reach 2.41 disappear.. Take your profits and enjoy them, as we will do!
Stay tuned for more..

Sui Important level ! We have retraced to BISI near Equilibrium and close to OTE level
This zone is a market maker accumulation zone
Remember this when we are in bullish trend they will hunt Longs !
we can still see lower prices - we can hit previous weekly candle low
Don't be scared of these type of moves
5.6$ soon !

SUI | ALTS | BULLISH Chart Pattern?A bullish chart pattern is forming on SUI in the daily chart.
It should be noted that this patter is still premature - meaning that it's not yet completed and there is not yet the confirmation that we need to act on it:
Don't miss the most recent update on XRP here:
_________________________
COINBASE:SUIUSD

SUI Sustains Above Key Support: A Trend Breakout to Watch..!SUI has maintained a key support level following a false breakout while simultaneously breaking out of the downtrend. You can consider taking a long position at the current or 3.370 levels, with a stop loss set at 3.000. The first target is at 4.000, the second at 4.500, and the third at 5.000, respectively.

#SUI/USDT#SUI
The price is moving in a descending channel on the 1-hour frame and is adhering to it well and is heading to break it strongly upwards and retest it
We have a bounce from the lower limit of the descending channel, this support is at a price of 2.70
We have a downtrend on the RSI indicator that is about to break and retest, which supports the rise
We have a trend to stabilize above the Moving Average 100
Entry price 3.196
First target 3.36
Second target 3.56
Third target 3.83

Trendline Flip: Bullish Setup for SUI/USDTSUI/USDT is finding strong support at the trendline, which has now flipped from resistance to support. This trendline, previously acting as a key resistance, has been successfully retested after the breakout, confirming its role as a new support level.
Additionally, the price is holding above the key supply and demand zone, further strengthening the bullish outlook. If this support holds, we could see a potential upward move as bullish momentum builds from this critical level.
DYOR, NFA

Is SUI Bottoming Out? Bulls Show Immense Strength at Key Levels!Yello, Paradisers! Could this be the moment #SUIUSDT finally locks in a strong bottom? The price has just retested a major breakout level, leaving behind a long lower wick—a clear sign of aggressive buying at lower levels. The question is, are the bulls ready to take full control? Let’s break it down.
💎#SUI is currently sitting on multiple layers of strong protection, reinforcing the possibility of a long-term bottom and reversal. The first key level is at $3.05, where moderate support has formed. Since November 12th, SUI has not closed a single session below the $3.00 mark, proving that bulls are fiercely defending this zone.
💎But that’s not all. An even more critical support region lies between $2.45 and $2.30—this was the major breakout zone that fueled the last explosive rally. This area is further fortified by the 200-day moving average (MA-200), making it an incredibly tough level for sellers to crack. Any bearish move into this zone will likely face serious resistance, forcing sellers to think twice before pressing lower.
💎Meanwhile, bulls are flexing their strength, successfully rejecting a deeper downturn. If this momentum holds, SUI is well-positioned to test the $4.20 - $4.50 resistance zone next. But here’s the real game-changer: a breakout above this level, backed by strong volume, could trigger a major upside move, setting SUI up for a run toward $6.80 - $7.20.
Paradisers, as always, patience and precision are key in this market. This isn’t a time for reckless trades—let the levels guide you, trade strategically, and stay disciplined.
MyCryptoParadise
iFeel the success🌴

SUIUSDT TRADE IDEA WITH EXPLAINATION.SUIUSDT is clean here but we have to wait for long orders to be filled, MSS done and now market is coming down to grab the trendline liquidity and internal FVG liquidity. After taking that liquidity market will go up from here as bullish MSS done.

SUISUI / USDT
SUI broke down big ascending channel pattern and also moving average which indicates a bearish momentum price action
As long as its maintaining the current structure Its looks like its targeting these key levels in my chart
Keep an eye on it

#SUI/USDT #SUI
The price is moving in a descending channel on the 1-hour frame and is adhering to it well and is heading to break it upwards strongly
We have a bounce from the lower limit of the descending channel, this support is at a price of 3.60
We have a downtrend on the RSI indicator that is about to be broken, which supports the rise
We have a trend to stabilize above the Moving Average 100
Entry price 3.59
First target 3.80
Second target 4.01
Third target 4.23

VanEck Predicts SUI Could Rally 326% to $16 by End-2025. Really?Global asset manager VanEck has projected a massive 4X rally for Sui (SUI) by the end of 2025, forecasting a potential price surge to $16—a 326% gain from its current $3.75.
According to VanEck’s recent analysis comparing Sui and Aptos (APT) in the smart contract platform (SCP) sector, the firm estimated that Sui could capture 5.5% of the SCP market, which it expects to hit $1.1 trillion by late 2025. This growth aligns with US M2 money supply expansion targets, a key macroeconomic driver.
Why Sui is Positioned for a Breakout:
📌 DeFi Strength – Sui ranks 4th in DEX trading volume after Solana, Ethereum, and Arbitrum, showcasing strong market adoption.
📌 Massive Interest – Sui is the 3rd most searched blockchain (Google Trends), trailing only Solana and Ethereum.
📌 Technical Support – SUI’s January correction found demand at $3.5, leading to a 12% rebound to $4.1 at press time.
With a strong recovery, SUI could re-enter its ascending channel from November, reinforcing the bullish thesis. If the SCP sector expands as projected, SUI’s growth potential remains significant.
Can SUI achieve this 4.26X rally by year-end? If demand holds steady, this could be one of 2025’s biggest breakout tokens! 🚀

SUI/USDT 1H: Bulls in Control – Targeting $4.70 Next!SUI/USDT 1H Chart Analysis
🚀 Follow me on TradingView if you respect our charts 📈
Current Market Structure:
Bullish trend confirmed after breaking $4.14 resistance.
RSI: 61, showing strength but not overbought yet.
Momentum: Strong breakout from previous range, confirming continuation.
Trade Setup (Confidence 8/10):
Entry: $4.14 - $4.15 (on retest).
Targets:
T1: $4.35
T2: $4.50
T3: $4.70 (previous swing high).
Stop Loss: $3.95 (below recent swing low).
Risk Score: 7/10 (moderate risk )
Smart Money Analysis:
Accumulation phase complete between $3.60 - $3.80.
Institutional buying pressure visible in volume profile.
No significant bearish divergences present.
Market Makers likely targeting liquidity around $4.70 - $4.80.
Key Levels:
Support: $4.14, $3.95, $3.80.
Resistance: $4.35, $4.50, $4.70.
Recommendation:
Long positions favorable within the $4.14 - $4.15 range.
Monitor volume confirmation for continued bullish momentum.
Maintain tight stops below $3.95 to limit downside risk.
Confidence Level: 8/10 for bullish continuation.
🚀 Follow me on TradingView if you respect our charts! 📈

SUIUSDT - Heavy correction ahead!3d chart shows breakdown of major trendline , bearish retest complete!
continuation of decline
The downtrend is expected to continue toward the 0.786 Fibonacci level.
If the price fails to hold this level, the decline is likely to extend further into the highlighted support zone on the chart
Best regards Ceciliones 🎯

Skyrexio | SUI Is In Huge Trouble, Be CarefulHello, Skyrexians!
The best crypto of 2024 is BINANCE:SUIUSDT , while other altcoins dumped significantly this asset set the ATH every day. This growth caused a lot of optimism and not SUI almost doesn't have haters. It means that price action needs to be cooled off and we will explain you why.
On the daily time frame you can see the entire impulse which consists of 5 waves. This is the complete impulse because of divergence on the Awesome oscillator. This is extremely bearish sign especially in conjunction with the Bullish/Bearish Reversal Bar Indicator which has already printed two red dots. You can check its accuracy before. For example it catches perfectly the bottoms of waves 2 and 4.
These red dots does not mean that we will see the bear market, but major correction is in progress. The logical target is 0.61 Fibonacci at $1.35.
Best regards,
Skyrexio Team
___________________________________________________________
Please, boost this article and subscribe our page if you like analysis!

#SUI/USDT Ready to go higher#SUI
The price is moving in a descending channel on the 1-hour frame and sticking to it well
We have a bounce from the lower limit of the descending channel, this support is at 4.30
We have a downtrend on the RSI indicator that is about to break, which supports the rise
We have a trend to stabilize above the moving average 100
Entry price 4.38
First target 4.53
Second target 4.70
Third target 4.86

SUI is playing inside a rising channelAs #SUI is playing inside a long term rising channel , with bearish divergences on Daily time frame , the we should be careful with that

BUYI sold my SUI last week because the daily MACD had been forming a very clear negative divergence. It is my profit taking rule - sell some when clear negative divergence appears in the 4H or daily. I followed my rule, but I ended up buying back yesterday.
I usually rely on the interaction between MACD and Stochastics to gauge the strength/weakness of the price move. Both indicators were clearly showing the downward move. However, RSI was stubbornly refusing to go below 50 level and RSI slow MA (Orange line) stayed horizontal and eventually started to tilt up. I started to look at the price action in the lower high frames and I could see the price was refusing to move below the bottom parallel channel.
My general bias for SUI is extremely bullish. Both fundamentals and technical set up support its long term upside move. The price may be choppy around $4.95 zone (the previous month high/previous week mid) and the price may retraced when it reaches the resistance area, but there are many layers of buy blocks sitting below. It is also good the 4 hour candle moved above and is now departing from EMA 21. The 4H MACD hasn't entered the bull zone, however, MACD lines are getting wider and wider apart as it approaches the bull zone, therefore, even though it is not confirmed MACD is in the bull zone, the probability for it to eventually enter the bull is high.
There are enough signs for bullishness. I am regretting that I sold my SUI. I followed my rule but I feel it was an unnecessary move especially I wasn't trading. That massive negative divergence in the daily chart shook my nerves! Now I bought back SUI and I plan to ride it during this Bitcoin cycle.

SOLD SUI and waiting for re-entryI had been accumulating SUI since last Sept when it broke above $1.0. But yesterday I sold my SUI position. It is probably not a good idea for many, but I did.
My overall bias for SUI is extremely bullish and I believe it will go much higher once BTC decides to move up. However, both daily RSI and MACD were forming a very clear negative divergence over two months. On top of that, the price tried to reach ATH, but failed, retested the previous higher high but failed. It gave me a sign of the weaking, so I sold it.
Now, I am going to wait for an opportunity to buy back. My rules for a long entry are as follows:
I use two time frames - weekly/daily and daily/4h.
My first rule for long:
1) MACD in the higher timeframe needs to be in the bull territory which is above 0. The angle of MACD is not important. It needs to be in the bull zone.
2) Stochastics (9,3,3) in the higher timeframe needs to reset and stochastics lines need to cross and start to move upwards. It cannot be in the overbought territory. If these two conditions are met in the higher time frame, I go to the lower time frame to start looking for an exact entry point.
3) MACD lines in the lower timeframe properly cross and enter the bullzone or cross and move upwards above the bull zone. Green vertical lines I drew in the chart are good examples.
4) Stochastics (9,3,3) in the lower timeframe cannot be in the overbought territory.
5) if the price is taking off from the critical area such as EMA21and resistance/horizontal/trendline, it even confirms it is a good area of entry.
