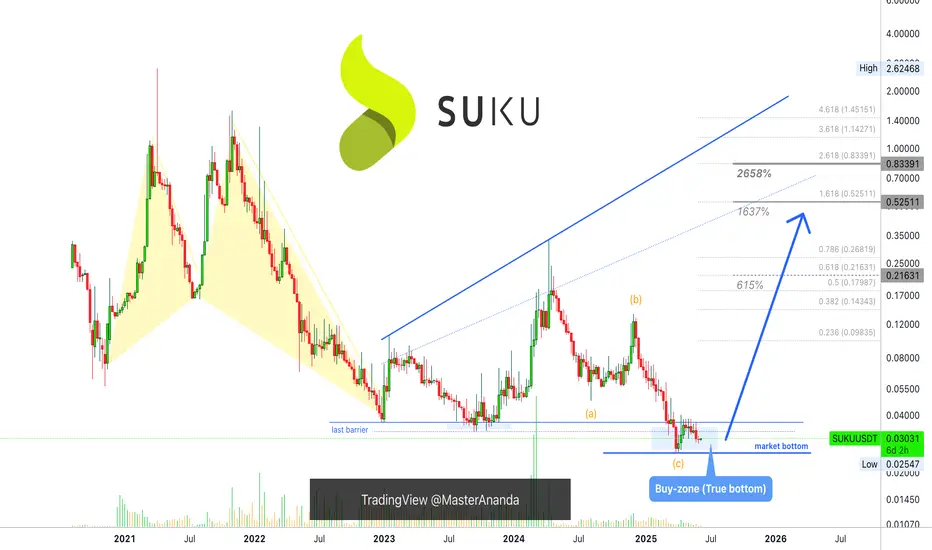
Suku, High Targets Only (615% - 2,658% Profits Potential)Between late 2023 through mid-2024, SUKUUSDT produced a 900%+ bullish wave. The action in late 2024 was a non-event.
Here we can clearly see how a pair that grew strongly in 2023 performed poorly in 2024. Those that performed poorly in 2023 did great in late 2024. But still, this isn't bull market type of action.
SUKU can grow more than 900% in a transition year, this is awesome. How much can it grow in a bull market year when everything goes wild? Great question. Growth potential is huge.
I am showing some targets here, strong targets but the possibilities exist for this pair to grow even more than what is shown on the chart. This is a small cap. and small cap. projects can do awesome when the bull market is in full force. Right now, we are not there yet.
SUKUUSDT is trading at the bottom, true bottom; the lowest prices ever in its entire history. This is simply great. You can't go wrong buying when prices are low. No planning needed, just buy and hold.
Risk becomes very limited, it can be counted in time, nothing more. While the reward potential can be extraordinary, off the chart.
A spot trader can simply buy and accumulate. If you are reading this now, you have great timing. The only time better than now was in early April, but the retrace pushed prices back near the same level, so everything is good.
Three months from now you will be dealing with a completely different market, you will be surprised to see how fast things change. Now everything is low and depressed, in a several months, you won't even be able to imagine that such a situation as now is even possible. Everybody who missed the train will be thinking, "why didn't I buy back then?"
Take action now.
Thanks a lot for your continued support.
Namaste.
SUKUUSDT
SUKUUSD long opportunitySUKU is above the daily sma.
Consolidating after the impulsive move.
Entry, targets and stop loss are shown on the chart.
Good luck

SUKU could see 75% here, >200% if breakoutQuick post - SUKU is at the bottom of a daily chart falling wedge. OBV has been rising throughout its entire drop since first being listed on Coinbase.
A move from here towards top of wedge could easily do 65-75%, and a falling wedge breakout could lead to significantly more ~260-280%. much more if we see continuation following if such a move were to occur.

SUKU: a promising project and chart.Suku is on of the 100 blockchain start ups listed on forbes. It's currently very low in capitalization and this give us a good long opportunity!
The cap is currently 40$M, this means that at 6.30$ the cap would be around 600$M. I think this is higly achievable for a project of this kind.
Suku is a service kind of project, this means they let companies use their network to give customers a new way of approach to the world of services. This goes from supply chain, interoperability to DeFi.
It's also a project in partnership with hedera hashgraph and suku network will be integrated in hedera network, this will make suku safer, scalable and fast than ever, making it one of the best project in the crypto world.
This project is a gem and it's very discounted right now.
Technical analysis:
Suku price is following this trendline for long time now, it looks very solid.
If this is the bottom the fibonacci extensions would take it to around 6$ during the next bounce. It's a high target but it's definitely reachable in the medium-term. And remember that low volume preceed expansion!
Here for you, as always, CryptoSoap!

SUKU Say Goodbye to cheap prices, say hello to MOONSUKU looks like it's ready for an absolute rocket mission to mars. It's been oversold for a while now and seems to have broken out. Now it is retesting the trendline it's been following for a long time!
Now is the perfect time to buy, don't miss the rocket ship.

SUKU/USDT { SUKU } - BULLISH SETUPANALYSIS 🔎
- SUKU/USDT is currently on an uptrend supported by the ascending trendline support.
- The market hit a swing high and retraced.
- Price is retesting the key fibonacci retracement zone (0.618 - 0.702 - 0.786) and ascending trendline support.
- There's a relatively high concentration of buyers at this zone (high buying pressure).
- The retracement was resisted by the descending trendline resistance.
- Price brokeout above the descending trendline resistance.
- This is a bullish signal.
- The market could be on the verge of the 5th impulsive Elliott wave.
BUY ENTRY ⬆️
- Key fibonacci retracement zone (0.618 - 0.702 - 0.786).
TARGETS 🎯
- Horizontal resistance level (@1.07541).
- Horizontal resistance level (@1.25106).
- Horizontal resistance level (@1.58302).
- Fibonacci extension level 1.0 (@1.84350).
SETUP INVALIDATION ❌
- Breakdown below the 0.786 fibonacci retracement level (@0.70033).

Suku/usdt analyse chart 8Nov 2021Good position
Super momentum
Enter 1.16$
Targets: 1.18 1.20 1.24
Sell: 1.12$ (Day close candle)
Good luck :)

SUKU-USDTBest buy price ( red line ) or after breakout and retest it .
Sell on Green lines
DYor plz
It isnot a financial advice
Good luck

LongHi guys it looks like a cup and handle pattern is complete and you have to wait to hit the targets.
#signal
#SUKU
#SUKUUSDT
Spot( Midterm)🌟
Enter : 1.2$
Target : 1.6$
Target : 1.9$
Target : 2.8$
Stop loss : 1$

SUKUUSDT DailyHi guys, if the resistance line is broken, buying it can be profitable, but since this crypto is 355th,
it is better to buy less because its trading volume is lower and it has more risk ...
Good luck, don't forget to like, thank you

