GBP/USD Professional Analysis – “Trap Trigger at Support”GBP/USD Professional Analysis – “Trap Trigger at Support”
📈 Market Overview:
• Pair: GBP/USD
• Timeframe: Likely 1H or 2H based on candle spacing
• Date: July 28, 2025
• Current Price: 1.33529
⸻
🔍 Technical Breakdown
🔴 Resistance Zone: 1.35800 – 1.36200
• Strong supply area where the last bullish impulse failed.
• Price got rejected hard, initiating a new downtrend.
• Sell-side pressure was confirmed with Supertrend turning red.
🟤 Support Zone: 1.32860 – 1.33400
• Major demand area where price previously reversed sharply.
• Currently being tested again after a clean sweep into the Trap Trigger zone.
⚠ Trap Trigger Zone (Liquidity Sweep Area):
• Price wicked just below support, tapping into a low-volume/high-liquidity area.
• This wick likely cleared sell-side liquidity and trapped breakout sellers.
• Followed by a bullish rejection wick, implying smart money accumulation.
⸻
🛠 Indicators & Tools:
• Supertrend (10,3): Currently red, indicating short-term bearish momentum.
• However, if price closes above 1.34032 (Supertrend level), it could flip bullish.
• Volume Profile (VRVP):
• Low-volume node under support suggests a quick “stop hunt” move, not genuine selling.
• High-volume acceptance area sits higher, near 1.34500–1.35000.
⸻
🎯 Forecast:
🔴 Bearish Invalidations:
• Price closing below 1.32860 with volume would invalidate this setup.
• That could signal continuation to deeper liquidity (1.32500 or below).
⸻
🧠 Smart Money Perspective:
• Liquidity engineered beneath support
• Trap Trigger activated — ideal for institutional reversal setups
• This is a classic “Stop Hunt → Reclaim → Expand” model
Supertrend

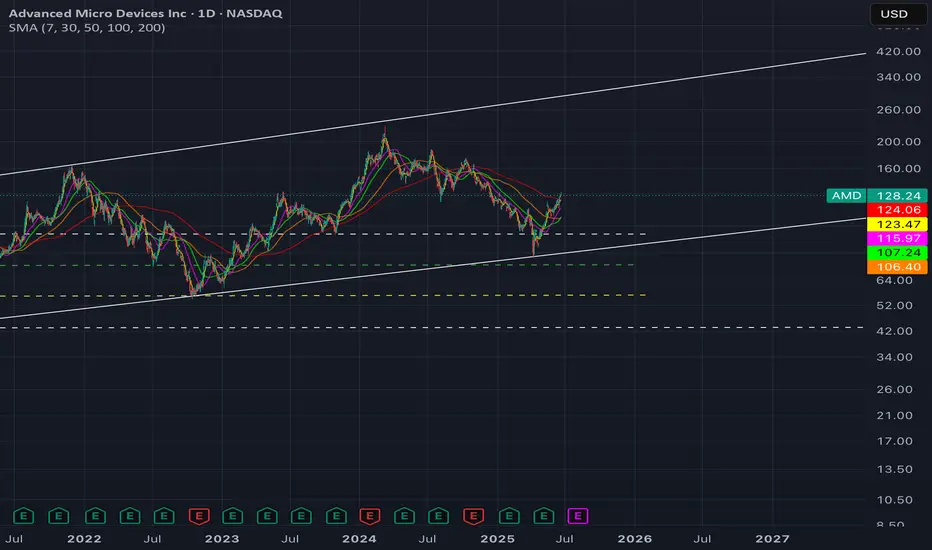
$AMD supercycle ; PT $300-350 by 2027- NASDAQ:AMD has likely entered a supercycle and we have entered Agentic AI world where inferencing is the main area of investment.
- Model Training is still important but we have entered a stage where lot of open source models and many proprietary vendors are close to each other when it comes to performance.
- Companies are trying to monetize their investments and one critical thing is model inference i.e making predictions.
- NASDAQ:AMD is poised for the agentic ai boom and therefore next 2 years are golden years for $AMD.
Smart Money Trap Identified! FVG + Liquidity Grab“Smart Money Trap Identified! FVG + Liquidity Grab Before Super USD Skyrockets to Target Zone ”
⸻
🧠 Technical Breakdown:
1. Liquidity Sweep (Manipulation Phase):
We see price aggressively sweep local liquidity around July 23, likely triggering stop-losses of early longs or breakout traders. This is a classic Smart Money trap, where big players induce volatility to grab liquidity before a move in the real direction.
2. Fair Value Gap (FVG):
A clear bullish FVG (imbalance) has formed post-liquidity grab, suggesting a potential institutional entry zone. This imbalance typically acts as a magnet for price and an entry point for Smart Money after manipulation.
3. Demand Zone & Target Projection:
• Price is now reacting from a well-defined Demand Zone, with clear rejection wicks indicating aggressive buying interest.
• The target zone (0.88334882) sits just below a previous supply zone, aligning with a potential distribution area where Smart Money may begin profit-taking.
4. Supertrend Indicator:
The supertrend has flipped bullish, confirming potential momentum shift, supporting the bullish bias as long as the FVG holds.
5. Confluence Factors:
✅ Liquidity Grab
✅ FVG Reaction
✅ Demand Zone Bounce
✅ Supertrend Confirmation
✅ High-Risk/High-Reward Entry Before Smart Money Run
⸻
🎯 Trade Idea (For Educational Purpose Only):
• Entry: On pullback into the FVG zone
• Stop Loss: Below the recent swing low or Demand Zone
• Target: 0.8833 (inside the upper supply/demand imbalance)
⸻
🧠 Educational Note:
This chart beautifully showcases how market makers operate — manipulate liquidity, fill imbalances, and target inefficiencies. Always think like Smart Money, not retail traders.

GAIL at Best Support zone !! There are two chart of Gail on Daily timeframe.
On the first chart Gail is moving in well defined parallel channel with support near at 178-180 zone.
Daily RSI is also taking support and bouncing back, indicating a revival in short-term momentum and strengthening the overall bullish setup.
On the second chart , the stock is bouncing from the supertrend support around ₹180, reinforcing bullish sentiment. However, on the shorter timeframe, the supertrend indicator is acting as resistance near ₹192, which needs to be breached for further upside continuation.
Thank You !!

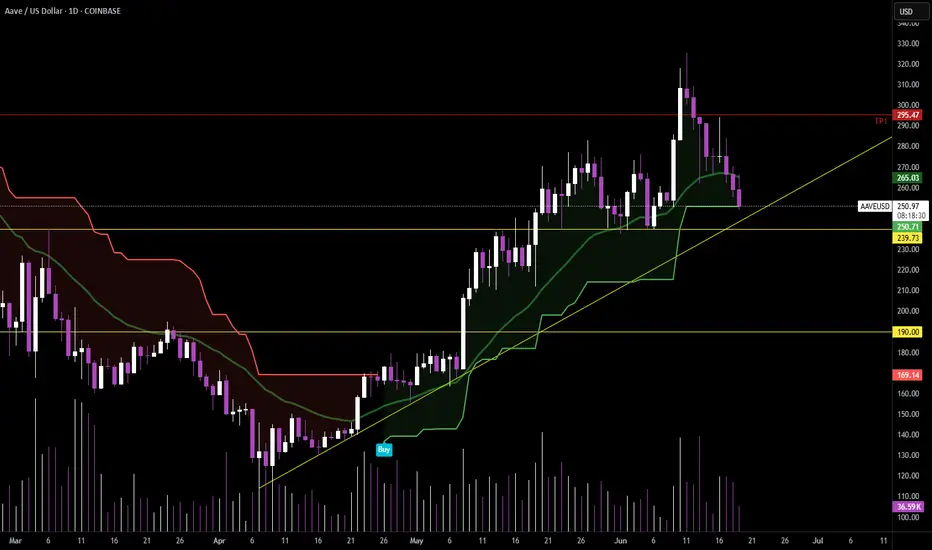
Scaling back into $AAVE – 3x Leverage Setup📍Entry zone: $250 → $240 (scaled)
📍Support confluence:
• Daily Supertrend touch
• Rising trendline support
• Major horizontal level near $240
🛑 Stop Loss:
• 5% price move (→ $232.75 avg) = 15% capital loss at 3x
• Or Daily Supertrend flip (closes in ~9 hours)
🎯 TP1: $295 (trim 33%)
🎯 TP2: $372 (full exit)
⚖️ R/R Ratio: 8.29
• ✅ Reward: +124%
• ❌ Risk: -15%
Just booked +133% on the last one. Back in—structure’s still bullish until it’s not.
#SUPER/USDT#SUPER
The price is moving within a descending channel on the 1-hour frame, adhering well to it, and is heading for a strong breakout and retest.
We are seeing a bounce from the lower boundary of the descending channel. This support is at 0.7294
We have a downtrend on the RSI indicator that is about to be broken and retested, supporting the upward trend.
We are looking for stability above the 100 Moving Average.
Entry price: 0.8327
First target: 0.8729
Second target: 0.9236
Third target: 0.9953

#SUPER/USDT#SUPER
The price is moving in a descending channel on the 1-hour frame and is adhering to it well and is heading to break it strongly upwards and retest it
We have a bounce from the lower limit of the descending channel, this support is at a price of 0.7300
We have a downtrend on the RSI indicator that is about to break and retest, which supports the rise
We have a trend to stabilize above the moving average 100
Entry price 0.7624
First target 0.7835
Second target 0.8057
Third target 0.8280

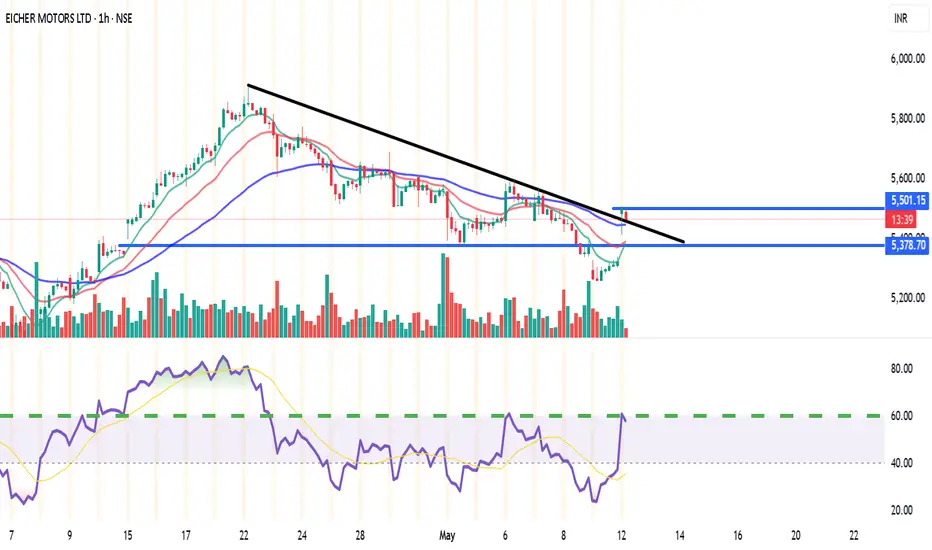
EICHERMOT (NSE) – Bullish Setup on 15min & 1H🔑 Trade Plan:
📥 Buy Above: ₹5485 (above current resistance & candle body highs)
🎯 Targets:
T1: ₹5527 (Pivot R1)
T2: ₹5555
🛡️ Stop Loss: ₹5380 (below 13 EMA & Supertrend support)
📊 Technical Signals:
RSI: 58.08 – Bullish momentum, still room to run
%B (BB): 0.77 – Close to breakout from upper band
EMA Crossover: 9 EMA > 13 EMA – Short-term bullish crossover confirmed
Supertrend: Support at ₹5322, aligning with bullish reversal
Volume: Spike during recent green candles signals strong buying interest
⚙️ Strategy Notes:
Use 15min chart for entry timing post breakout
Tighten SL to cost after T1 hits
Ideal for short-term intraday/swing traders
For Education Purposes Only
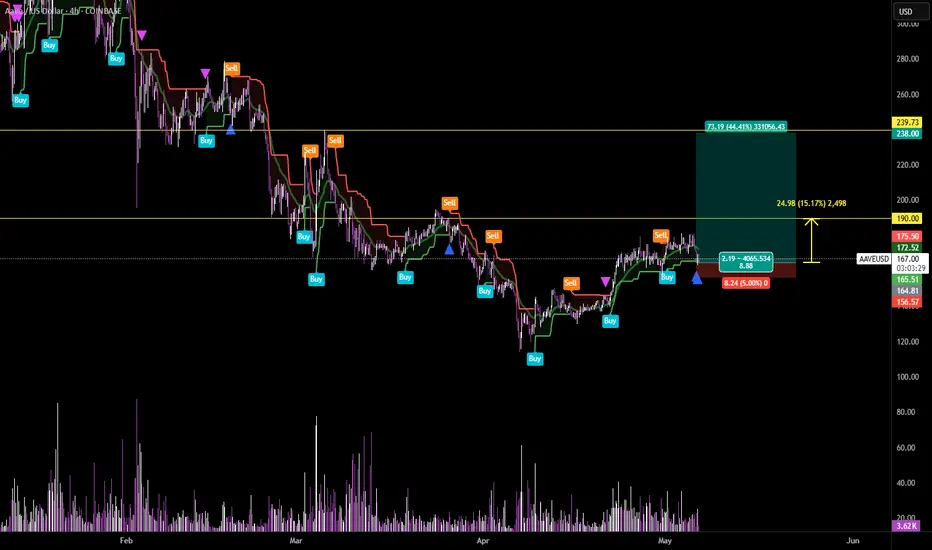
Long AAVE/USDT – Supertrend Touch Play (4H Chart)Entered a long after price tapped the 4H Supertrend and held above the EMA. Clean reaction at confluence support with prior breakout structure acting as a floor.
🎯 Targeting $238 (44.41% upside)
🛑 Stop at $158.65 (-5%)
🟢 Risk-Reward: 8.88R
⚡️ Entry: $166.89
📍 TP1: $190 (local resistance / range high reclaim)
📍 TP2: $238 (full expansion target)
Let’s see if this touch leads to the next leg up or gets faded like the last high. Risk defined, setup clean. Let the market do the rest.
#Crypto #AAVE #TradingView #Supertrend #TA #LeveragePilot #Altcoins #EMA23 #TrendTrading
SUPERUSDT 1WSUPER ~ 1W Analysis
#SUPER Buy gradually from here if you still have a Conviction on this coin with a short -term target of at least 20%+.

Follow the trendWon 2 lost 1, So far so good, can't win them all. Important is to have proper risk management.
Find the trend, follow the trend, stay on trend.

Supertrend Indicator: a simple yet powerful tool for trendsThe Supertrend Indicator is a widely used tool among traders to identify the prevailing trend and generate buy/sell signals based on market momentum. It works by calculating a dynamic support and resistance level using the Average True Range (ATR) to adjust for market volatility.
The indicator plots a line above or below the price, acting as a trailing stop-loss.
When the price crosses above the Supertrend line, it turns green, signaling a potential buy opportunity.
When the price crosses below the Supertrend line, it turns red, indicating a potential sell signal.
Why Use Supertrend?
- Easy to interpret for both beginner and experienced traders.
- The ATR-based calculation ensures that stop levels adjust dynamically.
- Whether you trade stocks, forex, or crypto, Supertrend can enhance your strategy.
Best Practices:
✔ Combine Supertrend with indicators like RSI or MACD for better confirmation.
✔ Adjust the ATR period and Multiplier to optimize it for different markets.
✔ Avoid false signals by using it in trending markets, as it may be less effective in sideways price action.

XAUUSD - Trust the process or rather trust your system.After many times of back testing and analyzing the combination of various indicators, results so far is quite impressive. One thing I learned so far using STFLAT is minimizing my early entry without strong confirmation.

SUPERUSDT 5DSUPER ~ 5D Analysis
#SUPER Buy gradually from here if you still have a Conviction on this Coin with a minimum target of 20%+.

DOGE Intraday: Sentiment and Precision-BasedEntry Criteria:
- EMA Cross: 24/42 EMAs cross to signal trend shift/continuation.
- Pivot Gain: Regain 2H-bias line (P1) and daily open (P2) to confirm support/resistance.
Exit:
- EMA Cross: Close on 12/21 EMA cross to secure profits or reduce losses.
Or
- 3R fixed for 50% or 100% TP
Confirmation:
- Daily Open respected/aligned for conviction.
- Supertrend (30M) matches trade direction.
Non-Trading Zone:
- Avoid trades in "Dead Space" (P1 ≤ x ≤ P2) due to low probability.
Entry: 0.32166
Stoploss: 0.31870
TP: TBC

SOL intraday Sentiment confirmation (LONG)Entry Criteria:
- EMA Cross: 24/42 EMAs cross to signal trend shift/continuation.
- Pivot Gain: Regain 2H-bias line (P1) and daily open (P2) to confirm support/resistance.
Exit:
- EMA Cross: Close on 12/21 EMA cross to secure profits or reduce losses.
Or
- 3R fixed for 50% or 100% TP
Confirmation:
- Daily Open respected/aligned for conviction.
- Supertrend (30M) matches trade direction.
Non-Trading Zone:
- Avoid trades in "Dead Space" (P1 ≤ x ≤ P2) due to low probability.
So, first i want price to close at a least one 15M candle above the ''Top dead-space'' in order to enter.
Current structure score:
- Structure: 1D: UP | 4H: UP | 1H: DOWN | 15M: UP |
- First 2H (15M): UP
- 15M Sentiment: EMA's: UP | ATR: UP
- Up score 7/7

41-Day Sentiment mastery missionGM WARRIORS
I'm on a mission to master the SuperTrend indicator by testing all 42 combinations of its key settings: Factor, ATR (Average True Range), and Time Periods.
Each day, I’ll backtest 50 trades on a new combination to refine a 15-minute day trading system, focusing on trend precision and market sentiment. The combinations include:
21 Factors (2.0 to 4.0 in 0.1 increments).
2 Timeframes (15M and 30M).
Goal: Identify the optimal SuperTrend configuration, master early trend reversals, and sharpen market insights within a month.
Results will be shared daily via a public sheet and incorporated into my ongoing SuperTrend study. If you’d like updates, let me know, and I’ll tag you in this journey!
📊 Progress Sheet: docs.google.com
📘 SuperTrend Study: docs.google.com

Bullish XRP: Adaptive RSI & Block Support Fuel Upswing PotentialCOINBASE:XRPUSD is showing promising signs of a potential upswing, driven by a bullish flip in the Adaptive RSI on the 15-minute chart, reinforced by strong order block support above $2 and confluence from other technical indicators.
Technical Analysis:
Adaptive RSI (15-Minute): The Adaptive RSI has recently transitioned from bearish to bullish on the 15-minute chart, indicating increasing buying pressure and a potential shift in momentum. This adaptive version of the traditional RSI is designed to adjust to changing market conditions, making it a potentially more reliable indicator of momentum shifts.
ICT Killzones (Worldwide Markets): The ICT Killzones, analyzed on the worldwide market timeframe, suggest that XRPUSD may be approaching an area where volume could increase, potentially leading to a rapid move. This aligns with the bullish signal from the Adaptive RSI and adds to the potential for a quick surge in price. However, it's important to be aware that this also increases the risk of a sudden overbought condition.
Supertrend Signals (AI Aggregator): The Supertrend indicator, functioning as an AI aggregator, is currently bullish.
Smart Money Concepts (Order Blocks Above $2): A key factor supporting this bullish outlook is the presence of strong order block support above the $2 psychological level. This suggests that institutional buyers or "smart money" have been accumulating XRP in this area, creating a solid foundation for a potential upward move.
Trade Setup:
Entry: Enter a long position now that the Adaptive RSI has flipped bullish on the 10-minute chart.
Stop-Loss: Place a stop-loss order below the recent swing low or a key support level identified by your indicators on the 15-minute chart, and consider placing it below the identified order block support for added security.
Take-Profit: Identify potential take-profit targets based on previous resistance levels or areas of potential selling pressure indicated on the 15-minute timeframe. Be mindful of the potential for a quick overbought condition, and consider taking profits strategically as the price rises.
Disclaimer: This is for educational purposes only and is not financial advice. Trading involves risk, and you could lose money. Always do your own research and consult with a qualified financial advisor before making any investment decisions.

PayPal Holdings, Inc. (daily)Hello community,
A little daily analysis.
We're leaving the flow of the super trend this Friday!
Just a little report in passing!
Make your opinion, before placing an order.
A little thought for the great French YouTuber @ThamiKabbaj
► Thank you for boosting, commenting, subscribing!

$SUPER Path Back to $1.6 and $3 SoonThe whole market has been dumping for some time where alts and all coins peaked in March and now after a healthy drop are primed for a run up again. Super has this falling triangle pattern in when it breaks will easily reclaim $1.60 then we do a measured moved up to $2.80 and eventually $3 shortly after. BSE:SUPER this a coin that can easily be around $25-30 by the peak of this bull run. DYOR NOT FINANCIAL ADVICE

SUPER/USDT POSSIBILITY FOR NEW BREAKTrend study shows that this coin has the possibility to get a break in the coming time.
Since the last 2 days, this coin has shown an interesting view.
We will follow this coin for the possibility of the next break
It depends all on the high chance after data info
We follow this coin if it's going to show a super effect with the next confirmations.
confirmation are important before trend continue

Trade the TREND with 4 Trend Indicators4 Trend Indicators you can use to identify the current MACRO Trend.
It's always important to know where your market is currently trading. Is it bullish, bearish, or range trading? If you have established the trend, you can trade with the trend instead of against it. Trading against the trend ( for example shorting during a bullish cycle ) adds unnecessary risk to an already risky trade (leverage).
1) Bollinger Bands
2) Logarithmic View
3) Super Trend
4) Moving Averages + RSI
Let me know how YOU determine the macro trend!
_________________________
BINANCE:DOGEUSDT MEXC:ETHUSDT KRAKEN:BTCUSD COINBASE:SOLUSD

🍌🍌 SUPERMICRO — AI BANANAS RECOVER FROM THE BEARISH HUGSIt’s hard to believe that only a few short years ago, Super Micro stock was trading for $10 per share. Now that it’s hovering near the $1,000 area.
And Yes, SMCI stocks are still Top #1 over the all S&P500 components with +217% YTD performance in 2024, and +471% 12-months performance.
Supermicro is an American company, a major manufacturer of motherboards, cases, power supplies, cooling systems, SAS controllers, Ethernet and InfiniBand. The company specializes in the production of x86-server platforms and various components for servers, workstations and data storage systems. The headquarters is located in San Jose, USA. Founded in 1993.
Supermicro, Inc., a provider of end-to-end IT solutions for cloud computing, artificial intelligence/machine learning, storage, and 5G/Edge communications, continues to expand its data center portfolio with NVIDIA end-to-end rack cabinet solutions HGX H100 equipped with liquid cooling systems.
Supermicro's advanced liquid cooling technologies help reduce time-to-commissioning, improve performance levels, and reduce data center operating costs while dramatically reducing energy efficiency.
It is estimated that when using Supermicro liquid cooling systems (compared to air-cooled data centers), data centers save up to 40% in terms of power costs. In addition, direct cooling costs can be reduced by up to 86% compared to existing data centers.
In technical terms, SMCI shares are strongly above 26- and 52-weeks SMA, while a classic scenario 'recovering from bearish hugs' is happening right now.
