$Gold #livestream #TradingToday
Hi POPEZKUS here.
Reviewing good prices to take trades.
Simple way to put order on chaos.
Thanks!
"without risk management you just play"
TF: Day & Week
Supllyanddemand

#DayTrading $GBPUSD Nice price to SELL #FOREXHi POPEZKUS here.
Simple way to put order on chaos.
Thanks!
"without risk management you just play"

HOW-TO: FibDev Indicator This tutorial is to explain our FibDev Indicator using AMD 15m chart example.
Overview of the daily zones:
-- Starting with red zones, these are our daily supply zones. We expect these zones provide resistance and act as potential pivot points for the price to reverse
-- The yellow zone is the neutral zone, when price is in this zone we expect that it will continue to chop around until it has chosen a direction for the day.
-- The green zones are demand zones. Similar to the supply zones, we expect these zones to provide support and act as possible pivots for the price to rebound
-- These zones are built based on previous daily price action and ** the zones will be the same on all time periods for any given day **
Overview of the intraday clouds:
-- The upper cloud (red outline) is where we expect to encounter an overbought condition, and that price may reverse down
-- The lower cloud (green outline) is where we expect to encounter an oversold condition, and that the price may rebound upwards
-- These clouds are built based upon ** the time period of the chart that is selected **. Thus the 5m clouds will be different than the 15m clouds.
Overview of the automated signals:
-- These signals are printed when we expect there is a chance of trend reversal. It should be noted that trading against the trend is very risky.
-- They do NOT serve as buy and sell signals, they are merely indications that price has entered a place of possible reversal.
Our thoughts on how to use this data:
--The main way we like to use this is by looking for scenarios where we have a wick or close that has broken above or below the intraday cloud at the same time that it is testing a supply or demand zone. Looking at this AMD example here, you can see a few scenarios where it wicked or closed into the lower cloud (some creating Bull signals) and was also testing a demand zone. This provides a layer of confluence as it's not only testing a daily demand zone but it's also testing the faster, intraday oversold zone (the lower cloud).
-- A secondary way to use this data is similar to the ORB strategy, where you essentially chase (or ride the momentum) the price once it has broken to the upside or downside of the yellow neutral zone. With this strategy, your potential profit zones would then become the supply or demand zones depending on which way the price moved.
Conclusion:
-- Ultimately it's up to you and how you choose to use this data and confluence it with other TA tools is completely up to you and your trading strategy.
-- For more information on using this indicator, please send us a message here or on Twitter (link found in our profile).
Thank you!
Great Blue Trading Team

STEP BY STEP ON HOW TO TRADE IMBALANCE OR FAIR VALUE GAP Smart Money concept has been a best strategy in financial market , the use of fair value gap has made it easy in catching the oportunity . here is how to determine and trade Fair Value Gap also known as Imbalance

eurusd demand area seen on the chart, eurusd is in the demand area, I predict it will continue to decline to go to the next demand 1.096 - 1.086
temporarily scalping can be done in the current demand area with a range of 1.125 - 1.11

USDCAD / DailyUSDCAD, Due to the breaking of the four-hour time trend line and the change of trend. There is a possibility of falling from higher areas to the marked purple area.


EUR/USD is not out of the woods yet Hello everyone, as we all know the market action discounts everything :)
_________________________________Make sure to Like and Follow if you like the idea_________________________________
The EUR/USD pair ended up closing the day in the negative territory Despite the good trading action on Monday and seems to have gone into a consolidation phase around mid-1.1500s on Tuesday.
It looks like the pair is trending in a Falling wedge pattern in a downtrend which usually indicates a reversal into a Bullish state soon but we have 0 confirmation so far. Breaking the pattern will give us the confirmation we need for a reversal.
Possible Scenarios for the market :
Scenario 1 :
The market is trading at 1.15605 at the time of this post, we are expecting a Bearish day today which will probably lead the market to the first support like located at 1.1536 where we will see a small battle between the Bulls and Bears over control which will determine the market movement for the next few days.
Scenario 2 :
The Bears seems to be in total control over the market and with a strong push we might see the pair reach the support located at 1.1496 by the end of the day. The Bulls will have a chance at that level to gain control back and push the market in hope of a breakout. The first target will be the resistance level at 1.1575 and from there they will be headed to the 1.1692 level.
Technical indicators show :
1) The market is below the 10 20 50 100 and 200 MA and EMA (Strong Bearish Signs)
2) The RSI is at 32.82 showing weakness in the market and giving a Sell signal.
3) The MACD is below the 0 line indicating that the market is in a Bearish state, With a negative crossover between the MACD line and the Signal line.
Support & Resistance points :
support Resistance
1) 1.1536 1) 1.1575
2) 1.1523 2) 1.1601
3) 1.1496 3) 1.1615
Fundamental point of view :
The common currency stays on the back foot in the first half of the week as investors can't find a reason to anticipate a reversal of direction.
Commenting on the inflation outlook on Monday, European Central Bank (ECB) chief economist Philip Lane said that they need to be "less trigger happy" and wait for data. "The medium-term inflation dynamic is too slow, not too fast," Lane added and noted that the trigger for monetary policy action is not there.
On Tuesday, October ZEW Survey - Economic Sentiment data for Germany and the eurozone will be featured in the European economic docket.
Even if these surveys point to a modest improvement in economic sentiment, the shared currency could have a tough time attracting investors, who are likely to put more weight on the policy divergence between the ECB and the Fed. Later in the day, the NFIB Business Optimism Index and JOLTS Job Openings data from the US will be looked upon for fresh impetus. However, it wouldn't be surprising to see a muted market reaction ahead of Wednesday's US inflation report and FOMC Minutes. According to FXsteet
This is my personal opinion done with technical analysis of the market price and research online from Fundamental Analysts and News for The Fundamental point of view, not financial advice.
If you have any questions please ask and have a great day !!
Thank you for reading.

Buy opportunity at EURAUD pair | Risk Reward 1.5Buy opportunity at EURAUD pair based on the trend and the key levels with a Risk Reward of 1.5 .

Posible test zona. RR scalpjust share and idea. bounce of rejection zone to test.price moves fear from seller... wait box and reaction


BTCUSD > Bitcoin Prediction and Major Levels!!Analysis on #BTCUSD
Hello friends.
Bitcoin is building slowly and testing new zone constantly, this healthy and it tells a story of how buyers and sellers reacting to market conditions.
we have successfully tested 40k and closed above it which was also a 200MA, I explained all this in my previous analysis if you like to check I will leave a link for you to see it.
What's happing now is a healthy bull back with AB=CD pattern inside this channel as you can see on the chart which usually is a trend continuation pattern.
I hope you understand that a lot of damage happens to the chart and we need to know that the market will keep moving in two steps forward one step backward/
right now it is very important the market closes above 42000 and doesn't spend a lot of time setting there
Kindly leave a comment and like these ideas, if it helps you, it will support the creating of more free ideas for you
Check today analysis below⠀
>>It’s not what we do once in a while that shapes our lives. It’s what we do consistently.
____________________________________________________________________________⠀
-Disclaimer: This information is not a recommendation to BUY or SELL. It is to be used for educational purposes only⠀
-Please note this is just a PREDICTION and I have no reason to act on it and neither should you

3. BTCUSD Mostly Long1. According to the one month Channel:
Price is in the middle of the uptrend channel So it's reasonable Price rise in channel and of course with fluctuations.
2. According to the Elliot waves:
Price is almost at the end of Motivate Wave.
3. According to the news and excitements :
(this is Last predict)
This prediction happened with a delay So it expresses the excitements of the trader to choose to long.
whatever you chose Short or Long Position DO NOT expect much profit.

Demand Zone - USD/CADLet's see if there is any rejection to the zone and in that case we could consider a Long until the next zone of Supply.

BULLISH EUR/USDBuy at a break and retest of wedge pattern.
Buy is at a 61.8 retracement.
At a trendline.
In a up-trend.

HSBC Bank (UK) Share ( HSBA ) Potential Long Opportunity05 January 21
Watch for Potential Long Opportunity on
HSBC @ Weekly Demand Zone .
With a Stop Below the Low on the chart.
LSE:HSBA

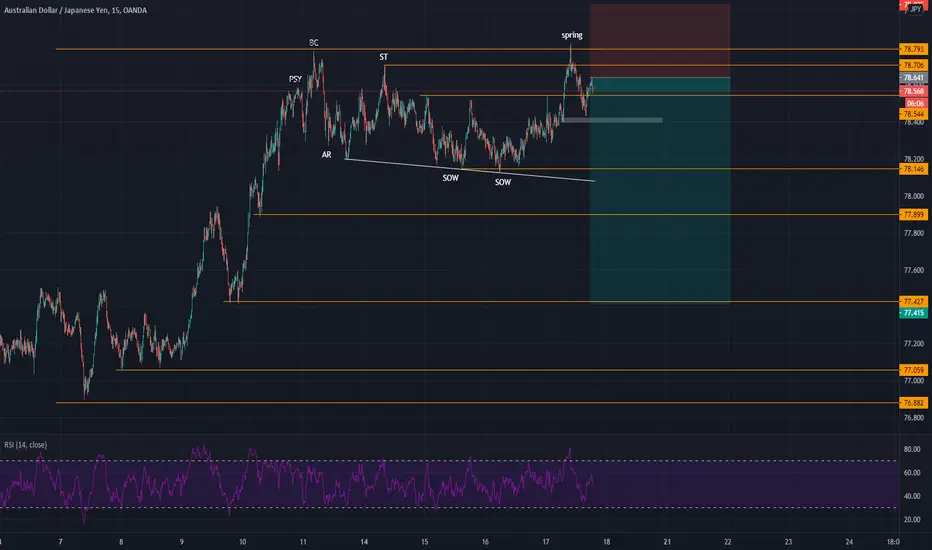
AJ DISTRIBUTION SELL - WYCKOFFWE CAN SEE THE BEGINNING OF A TEXTBOOK ABC DOWNTREND MOVE AFTER THE TEST FROM THE SPRING.
EurGbp Short IdeaWe had a barish impulsive move away from the monthly TL
Price then entered a correction period before breaking out to the downside
We then whitnessed another short correction period before another break and a bearish push to the underside of the 1h 200ema
This trade looks really good, but this is forex and anything can happen.

Gold, Careful, Bearish AB=CD imminent. 1920 TargetGold looks like on bull momentum, but if we see the deeper the price could be on it's way to form AB=CD bearish pattern.
Furthermore, there's a supply zone at 1955 - 1972 that hasn't been tested before.
If AB=CD confirm, price will fall with the same length as the CD rally.
If we expect it will fall at 1.618 Fibonacci, price might retest 1920 again in the future
Good luck!


Fresh Supply and Demand Blocks for AU Letting price play out
^Block to block
^Once in these zones
^Prep down
^Execute the concept

AUDUSDDaily chart. We have seen a big impulse to the upside this week. The last three days there has been a visible loss of momentum as those wicks never lie. I would wait to see how price will react and then look for the 2 possible scenarios around the pink level. If price break the blue zone the analysis becomes invalid. Trade safely and manage your risk!
