EURAUD Bullish Momentum in Play — Targeting 1.69500OANDA:EURAUD is trading within a well-defined ascending channel, with price action respecting both the upper and lower boundaries. The recent bounce off the midline suggests buyers are maintaining control, supporting a potential continuation of the uptrend.
As long as the price remains above the support level and the channel's lower boundary holds, the bullish structure remains intact.
A potential upside target is 1.69500, aligning with the upper boundary of the channel. A break and close above this level could signal further bullish momentum.
However, a breakdown below the green support zone would invalidate the bullish scenario and may open the door for a deeper pullback.
Remember, always confirm your setups and trade with solid risk management.
Best of luck!
Supply_and_demand

EURCAD at Key Resistance Zone - Potential Drop to 1.50180OANDA:EURCAD has reached a significant resistance zone, marked by prior price rejections, suggesting strong selling interest. This area has previously acted as a key supply zone, increasing the likelihood of a bearish reversal if sellers regain control.
If the price confirms resistance within this zone through bearish price action (e.g., wicks or rejection candles), we could see a move toward 1.50180, which represents a logical target based on recent structure.
However, if the price breaks and holds above this resistance area, the bearish outlook may be invalidated, potentially opening the door for further upside.
Just my take on support and resistance zones—not financial advice. Always confirm your setups and trade with solid risk management.
Best of luck!

EURUSD Approaching Key Resistance – Will Sellers Step In?OANDA:EURUSD is approaching a significant resistance zone, highlighted by previous price reactions and strong selling interest. This area has historically acted as a supply zone, where sellers have stepped in, leading to notable price reversals. The current price action suggests a potential bearish reaction if the resistance holds.
If sellers maintain control, we could see a decline toward the 1.03940 level, which represents a logical target based on the current market structure. Confirmation signals—such as a bearish engulfing candle, rejection wick, or increased selling volume—would strengthen the bearish outlook.
However, if the price breaks above this resistance zone and sustains momentum, the bearish outlook may be invalidated, signaling a potential shift in favor of buyers.
Monitoring how price reacts to this zone is crucial for identifying entry opportunities. As always, applying proper risk management is essential given the potential for volatility.
Just my take on support and resistance zones—not financial advice. Always confirm your setups and trade with solid risk management.
Best of luck!

GBPUSD Approaching Major Resistance — Potential Sell SetupOANDA:GBPUSD is approaching a significant resistance zone, a level where sellers have consistently stepped in, leading to notable bearish reversals in the past. This area is marked by strong selling interest and historical price reactions, increasing the likelihood of a bearish move if sellers regain control.
The current price action suggests that if the pair confirms resistance through signals like bearish engulfing candles, long upper wicks, or increased selling volume, we could see a downward move toward 1.25770—a logical target based on previous price behavior and market structure.
However, if the price breaks above this zone and sustains, the bearish outlook may be invalidated, opening the door for further upside.
Just my take on support and resistance zones—not financial advice. Always confirm your setups and trade with solid risk management.
Best of luck!

AUDCAD at Key Support Level – Potential Rebound to 0.89950OANDA:AUDCAD has reached a significant support zone, marked by previous price reactions and strong buying interest. This area has historically acted as a key demand zone, increasing the likelihood of a bounce if buyers step in.
The current market structure suggests that if the price confirms support within this zone, we could see a bullish reversal. A successful rebound could push the pair toward the 0.89950 level, a logical target based on the recent market structure.
Just my take on support and resistance zones—not financial advice. Always confirm your setups and trade with solid risk management.
Best of luck!

USDCHF - Sell Setup at Key Supply ZoneOANDA:USDCHF has reached a key supply zone, highlighted by strong selling interest. This area has historically acted as a resistance level, increasing the likelihood of a bearish reversal if sellers step in.
The current market structure suggests that if the price confirms resistance within this zone, we could see further downside movement. A successful rejection could push the pair toward 0.89940, a logical target based on prior price behavior and the current structure.
However, if the price breaks and holds above this resistance, the bearish outlook may be invalidated, potentially leading to further upside.
Just my take on support and resistance zones—not financial advice. Always confirm your setups and trade with solid risk management.
Best of luck!

SPAIN35 Bullish Momentum in Play — Targeting 13,700FUSIONMARKETS:E35 is trading within a clearly defined ascending channel, with the price maintaining strong bullish momentum. This suggests the uptrend may continue, with the upper channel boundary serving as a potential target.
A short-term pullback could present an entry opportunity if buyers show strength through bullish candlestick patterns like a bullish engulfing or hammer formation, potentially driving the price toward the 13,700 level.
However, a break below the channel's lower boundary would invalidate the bullish outlook and may indicate a shift in market direction.
Remember, always confirm your setups and trade with solid risk management.
Best of luck!

STOXX50: Maintains Bullish Momentum - Is 5,688 the Next Target?ICMARKETS:STOXX50 remains within a well-defined ascending channel, with the price showing a rebound from the midline of the channel. This suggests a continuation of the uptrend, targeting the upper channel boundary.
A short-term pullback could offer a potential entry opportunity. If buyers step in and confirm strength through candlestick patterns like bullish engulfing or hammer formations, momentum could drive price higher toward the 5,688 level.
A breakdown below the channel's lower boundary, however, would invalidate the bullish outlook and signal a potential shift in market direction.
Remember, always confirm your setups and trade with solid risk management. Best of luck!

EURCAD Approaching Major Resistance — Potential Sell OpportunityOANDA:EURCAD is approaching a significant resistance zone, a level where sellers have consistently stepped in, leading to notable bearish reversals in the past. This area is marked by strong selling interest and historical price reactions, increasing the likelihood of bearish move if sellers regain control.
The current price action suggests that if the pair confirms resistance through signals like bearish engulfing candles, long upper wicks, or increased selling volume, we could see a downward move toward 1.49830 — a logical target based on previous price behavior and market structure.
However, if the price breaks above this zone and sustains, the bearish outlook may be invalidated, opening the door for further upside.
Just my take on support and resistance zones—not financial advice. Always confirm your setups and trade with solid risk management.
Best of luck!

EURAUD at Key Resistance Zone – Will Sellers Step In?OANDA:EURAUD has reached a significant resistance zone, marked by prior price rejections, suggesting strong selling interest. This area has previously acted as a key supply zone, increasing the likelihood of a bearish reversal if sellers regain control.
If the price confirms resistance within this zone through bearish price action (e.g., wicks or rejection candles), we could see a move toward 1.66260, which aligns with a logical target based on recent structure.
However, if the price breaks and holds above this resistance area, the bearish outlook may be invalidated, potentially opening the door for further upside.
Just my take on support and resistance zones—not financial advice. Always confirm your setups and trade with solid risk management.
Best of luck!

Move toward the level of 73,000 unitsAccording to the January 21 analysis, after identifying the trading range and determining its highs and lows, we expected Bitcoin to complete this pattern at 92,303.
However, after reaching this level on the daily timeframe, the price made a strong spike, breaking the large trading range between 92,303 and 106,436, entering a new phase and movement.
After its adventure at 86,903, this asset continued its downward movement, breaking through this range as well. Currently, it has reached a new price level at 80,000, driven by the strong spike movement.
Now, we must wait to see whether this direct movement will continue or if it will proceed with some delay and consolidation.
It is important to note that if this level is lost, Bitcoin’s price on the daily timeframe could potentially extend its move down to 73,000, which is also the expected level. The reason is that such a strong spike movement requires a powerful support level for correction or a temporary halt in this dominant wave.

AUDCAD at Key Resistance – Will Sellers Step In?OANDA:AUDCAD has reached a significant resistance zone, highlighted by previous price rejections and strong selling pressure. This area has historically acted as a supply zone, increasing the likelihood of a pullback if sellers step in.
The current market structure suggests that if the price confirms a rejection from this resistance, we could see a move lower toward the 0.90200 level, a logical target based on past price behavior and current market structure.
Just my take on support and resistance zones—not financial advice. Always confirm your setups and trade with solid risk management.
Best of luck!

WHEAT at Key Support Zone – Bullish Bounce ExpectedPEPPERSTONE:WHEAT has approached a key support zone, marked by previous price reactions and strong buying interest. This area has previously acted as a demand zone, increasing the likelihood of a bullish bounce if buyers step in.
The current market structure suggests that if the price confirms support within this zone, we could see a reversal toward 573.0, a logical target based on prior price behavior and current structure. A clear bullish signal, such as a rejection wick or bullish engulfing candle, would strengthen this outlook.
However, if the price breaks below this support zone, the bullish scenario may be invalidated, signaling potential further downside.
Just my take on support and resistance zones—not financial advice. Always confirm your setups and trade with solid risk management.
Best of luck!

NICKEL - Sell Setup at Key Resistance LevelPEPPERSTONE:NICKEL has reached a significant resistance zone, highlighted by previous price reactions and strong selling interest. This area has historically acted as a key supply zone, increasing the likelihood of a bearish reversal if sellers regain control.
The current market structure suggests that if the price confirms resistance within this zone, we could see a bearish move. A successful rejection could drive the price toward 15.6220, a logical target based on previous price behavior and the current market structure. However, if the price breaks above this zone, the bearish outlook may be invalidated, opening the door for further upside.
Just my take on support and resistance zones—not financial advice. Always confirm your setups and trade with solid risk management.
Best of luck!

NICKEL - Buy Setup at Key Support LevelPEPPERSTONE:NICKEL has reached a significant support zone, highlighted by previous price reactions and strong buying interest. This area has historically acted as a key demand zone, increasing the likelihood of a bullish bounce if buyers step in.
The current market structure suggests that if the price confirms support within this zone, we could see a bullish reversal. A successful rebound could push the pair toward 15,578, a logical target based on previous price behavior and the current market structure. However, if the price breaks below this zone, the bullish outlook may be invalidated and we could potentially see further downside.
Just my take on support and resistance zones—not financial advice. Always confirm your setups and trade with solid risk management.
Best of luck!

GBPNOK at Key Resistance – Potential Drop to 14.0670FOREXCOM:GBPNOK has reached a significant resistance zone, highlighted by previous price reactions and strong selling interest. This area has historically acted as a key supply zone, increasing the likelihood of a bearish reversal if sellers step in.
The current market structure suggests that if the price confirms resistance within this zone, we could see a bearish move. A successful rejection could push the pair toward the 14.06700 level, a logical target based on previous price behavior and current market structure.
Just my take on support and resistance zones—not financial advice. Always confirm your setups and trade with solid risk management.
Best of luck!

STOXX50 Maintains Bullish Momentum — Targeting $5,605ICMARKETS:STOXX50 remains within a well-defined ascending channel, with the price showing a rebound from the midline of the channel. This suggests a continuation of the broader uptrend, with the next potential target near 5,605, aligning with the upper boundary of the channel.
A minor pullback could present a potential entry opportunity if buyers maintain control. Confirmation through bullish candlestick patterns—such as bullish engulfing or hammer formations—may strengthen the bullish case and drive momentum toward the 5,605 level.
A breakdown below the channel’s lower boundary would invalidate the bullish outlook and could indicate a potential shift in market direction. Monitoring how price reacts around the midline will be crucial for assessing continued bullish momentum.
Remember, always confirm your setups and trade with solid risk management. Best of luck!

GBPAUD - Short Setup at Key Resistance LevelOANDA:GBPAUD is approaching a major resistance zone, an area where sellers have consistently stepped in, leading to notable reversals in the past. This level is marked by strong selling interest and historical price reactions, increasing the likelihood of a bearish move if sellers regain control.
The current price action suggests that if the pair confirms resistance through bearish engulfing candles, long upper wicks, or increased selling volume, we could see a downward move toward the 1.99200 level. However, if the price breaks above this zone, the bearish outlook could be invalidated, opening the door for further upside.
Just my take on support and resistance zones—not financial advice. Always confirm your setups and trade with solid risk management.
Best of luck!

AUDJPY at Key Support Level – Potential Rebound to 95.900OANDA:AUDJPY has reached a significant demand zone, where past price action shows strong buying interest. This area has historically acted as a key support, increasing the likelihood of a bullish reaction if buyers re-enter the market.
If the support holds, a bullish reversal could push the pair toward 95.900, a logical target based on previous price behavior and market structure. Confirmation signals to watch for include bullish engulfing candles, long lower wicks, or increased buying volume, which would strengthen the case for an upside move.
However, if the price breaches this zone and sustains below it, the bullish outlook may be invalidated, increasing the likelihood of further downside. Monitoring candlestick patterns and volume at this critical level is crucial for identifying potential trade opportunities.
Just my take on support and resistance zones—not financial advice. Always confirm your setups and trade with solid risk management.
Best of luck!

GBPCAD at Key Resistance: Potential Selling Opportunity to 1.789OANDA:GBPCAD is trading near a robust resistance zone that aligns with prior price rejections. This area has previously attracted strong selling interest, making it a critical point to watch.
If bearish confirmation appears, such as strong upper wicks or bearish candlestick patterns, I anticipate a move toward 1.78900. But a break above this level could signal further upside and invalidate the bearish setup.
-Carefully evaluate price action at this zone before entering positions.
-Just my take on support and resistance zones—not financial advice. Always confirm your setups and trade with solid risk management.

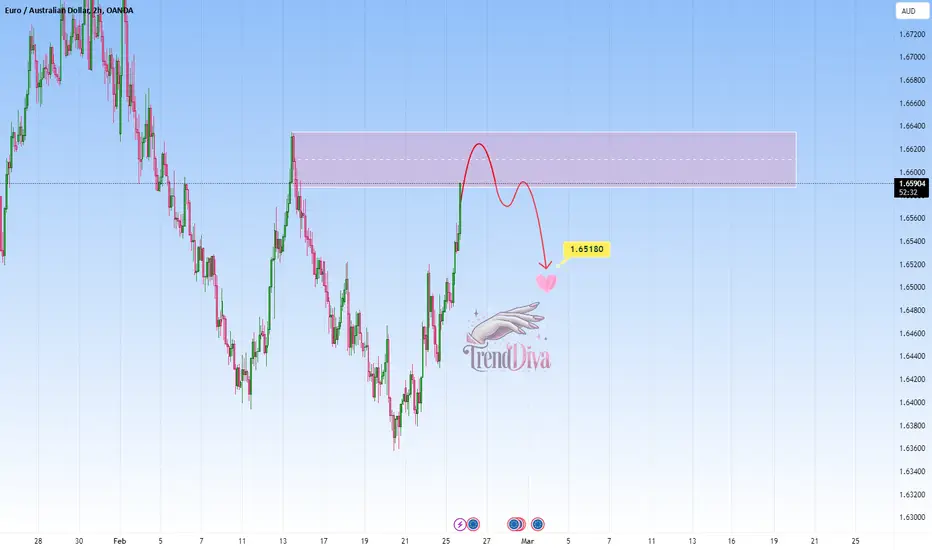
EURAUD - Short Setup at Key ResistanceOANDA:EURAUD is approaching a significant resistance area that has before reversed bullish trends. The current upward move into this zone suggests potential selling opportunities if rejection signals appear, such as bearish engulfing candles or upper wicks.
I find that a move toward 1.65180 is likely.
A break above this resistance, however, could indicate a shift in market sentiment.
Just my take on support and resistance zones—not financial advice.
Always confirm your setups and trade with solid risk management.
ALUMINIUM at Key Resistance – Potential Drop to 2,630FUSIONMARKETS:XALUSD has reached a significant resistance zone, marked by prior price rejections and strong selling pressure. The current market structure suggests that if the price confirms a rejection from this resistance zone, there is a high likelihood of a downward move. I anticipate that if rejection occurs, the market may head lower toward the 2,630 level, which represents a logical target within the current market structure.
Just my take on support and resistance zones—not financial advice. Always confirm your setups and trade with solid risk management.

BITCOIN at Major Support - Will Buyers Push Toward 98,250?COINBASE:BTCUSD has reached a significant support zone, highlighted by previous price reactions and strong buying interest. This area has historically acted as a key demand zone, increasing the likelihood of a bounce if buyers step in.
The current market structure suggests that if the price confirms support within this zone, we could see a bullish reversal. A successful rebound could push the pair toward the 98,250 level, a logical target based on past price behavior and structural confluence.
Just my take on support and resistance zones—not financial advice. Always confirm your setups and trade with solid risk management.
Best of luck!
