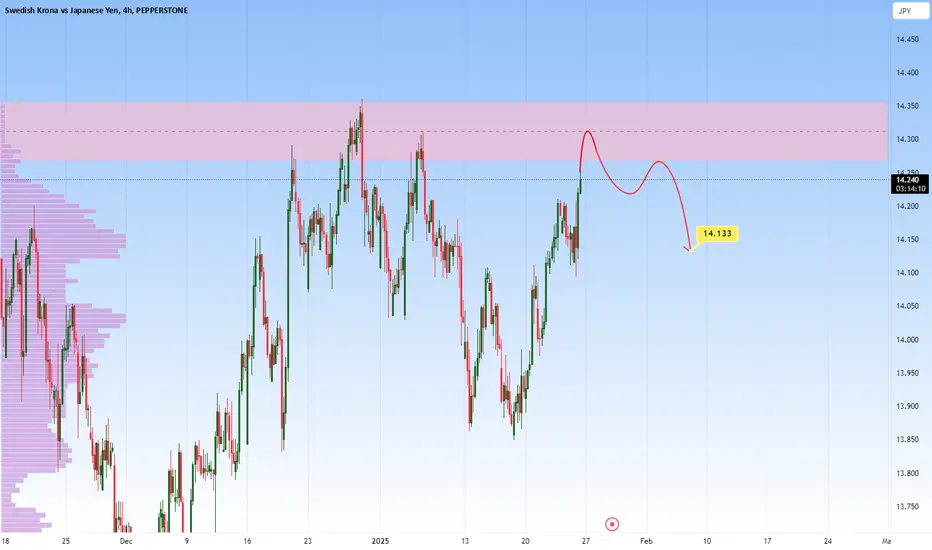
SEKJPY at Major Resistance - Could it Reach 14.133?SAXO:SEKJPY is approaching a key resistance level that has previously triggered bearish reversals. While current bullish momentum has driven the price into this zone, it could present an opportunity for sellers to step in.
If bearish signals such as rejection wicks or bearish engulfing candles appear, a move toward 14.133 could follow. On the other hand, a breakout above this resistance would invalidate the bearish bias and signal potential for further upside.
Key Takeaway: Wait for clear rejection patterns before considering short positions.
Supply_and_demand
Will the support level of 0.31097 be broken?With a breakout, the scalping support level is expected to reach the 1.04715 range.

CADJPY - Bearish Continuation After Support BreakOANDA:CADJPY has broken through a key support level and is now retesting this level as resistance. If the resistance holds, it could pave the way for a deeper move downward, with the 106.600 level emerging as the next major area of interest. This level also aligns with a significant support zone, making it a critical area where buyers may attempt to regain control.
Traders are advised to monitor for bearish confirmation signals, such as bearish engulfing candlestick patterns, rejection wicks, or strong selling volume at the retested resistance level. Such signals would reinforce the probability of a continuation to the downside. However, a decisive break back above the resistance zone would invalidate the bearish scenario

XAUUSD ( GOLD ) | 1 DAY | SWING TRADING | ICT STRATEGY Hey there, friends! 👋
I’ve prepared a gold analysis for you using the swing trading style. 📊 Currently, the daily analysis aligns with the ICT market maker sell model.
However, for these models to work, we need to see some sort of reaction in the market. Patience is key, so hang tight and wait for my analysis to be updated. ⏳
Once I spot a reaction, I'll share a golden target with you! 🎯
Don’t forget to hit the like button to stay tuned for updates! 🚀

USDJPY – Break & Retest Short SetupThe USDJPY pair has recently broken below a key support level. This area could potentially act as resistance, presenting a classic break-and-retest scenario.
A bearish confirmation, such as rejection wicks, bearish engulfing candles, or strong selling pressure, would validate the potential for a short setup. If sellers step in at this level, the next downside target could be the 154.537 zone.
Traders should monitor the retest closely for clear signs of rejection before committing to short positions.

GBPCAD - Bearish Momentum Expected from Resistance ZoneOANDA:GBPCAD is currently testing a significant resistance zone. This level has previously acted as resistance, leading to a bearish reversal. The recent upward momentum into this zone suggests a potential for sellers to regain control and push prices lower.
A bearish confirmation, such as a rejection candle, bearish engulfing pattern, or signs of fading bullish momentum, would indicate an increased likelihood of a move downward. If this scenario unfolds, the price could head toward the 1.78220 level.
This setup aligns with a potential short-term correction after an impulsive move. Traders should wait for confirmation of selling pressure before considering short positions.
This is not financial advice but rather how I approach support/resistance zones. Always wait for confirmation, like a rejection candle or volume spike before jumping in. And let me know what you think of this setup in the comments!

PALLADIUM - In a significant resistance levelOANDA:XPDUSD is approaching a significant resistance level that has previously seen bullish momentum. This area aligns with a notable supply zone and could present a potential selling opportunity.
If bearish signals, such as rejection wicks or bearish candlestick patterns, appear, the price may decline toward 993,000. Crossing above this resistance zone would diminish the bearish perspective and indicate bullish continuation.
Key Takeaway: Monitor price action closely at this level and prioritize strong risk management. What’s your perspective on this setup? Share your thoughts in the comments!

MNQ Trade 1/24/2025Bought in the green demand zone and sold in the red supply zone. Nicely executed trade!

GBPUSD - Potential Long from Key Support ZoneThe GBPUSD pair is currently approaching a significant demand zone near the 1.20200 - 1.22000 level. Historically, this area has served as a robust support level, often leading to strong bullish reversals. The recent bearish momentum has pushed the pair into this critical area, increasing the likelihood of buying interest emerging.
A bullish confirmation, such as a strong rejection pattern, bullish engulfing candles, or long lower wicks, would signal potential upward movement. If buyers regain control, the price may head toward the 1.24427 level.
This setup suggests a potential short-term rebound, aligning with a corrective move within the broader market structure.

EOS at Key Support Level - Bullish Bounce ExpectedCOINBASE:EOSUSD has reached a significant support area that has previously attracted buying interest, resulting in bullish bounces. If the support level holds and a bullish confirmation emerges, I anticipate a move toward the 0.8641 level. However, if the support is broken, the bullish outlook will be invalidated, opening the door for further bearish momentum.
Traders should wait for clear confirmation of buyer strength before opening any trades. If this analysis resonates with you or you have a different perspective, feel free to discuss in the comments!

Polygon at Key Support Zone - Will It Bounce to 0.4700?COINBASE:MATICUSD has reached a significant support level that has previously attracted buying interest, often resulting in bullish recoveries. This level aligns with previous market reactions, highlighting its role as a key area to watch.
If the support holds and bullish confirmation emerges—such as bullish engulfing candles or long lower wicks—a move toward the 0.4700 level is anticipated. However, if the support is broken, the bullish outlook could be invalidated, opening the door for further bearish momentum.
Traders should closely monitor this zone for signs of buyer strength before considering long positions. As always, risk management is essential to mitigate potential losses.

GOLD Signal 23/01/2025 President Trump Speaks (Fall of gold)Hi everyone gold is now create a very strong resistance trend line
Its Not possible to beak today
Is today president Trump has confreance
So do you think He will say any negative about Usd ? NO
So we can sell now
Tp1 = 2735 ( 90 pips)
Tp2 = 2726 ( 180 Pips)
Tp3 = 2716 ( 290 Pips)

NICKEL: Sell Setup at Key ResistanceCAPITALCOM:NICKEL is at a key resistance zone. This zone has consistently acted as a key area of interest where sellers regained control, leading to prior reversals. If the price confirms rejection through bearish price action, such as wicks signaling rejection or bearish engulfing candles, I anticipate a move downward toward the 15865.08 level.
However, if the price successfully breaks and holds above the zone, this would invalidate the bearish outlook and could open the door for further upside. Traders should monitor price action closely at this critical resistance area.
Proper risk management is essential, given the possibility of price breaking higher.

TRUMP at Key Support Level: Will It Bounce or Break Below?BINANCE:TRUMPUSDT is trading near a key support level that previously acted as a foundation for bullish momentum. The recent price action indicates that this area may serve as a strong demand zone.
If bullish confirmation appears, such as increased buying volume or candlestick reversal patterns, I expect the price to move toward 42.00$. Conversely, a break below this support would weaken the bullish scenario and suggest further downside.
Traders should monitor this level closely and use proper risk management to navigate potential market volatility.

$NVDA #Nvidia NASDAQ:NVDA is currently accumlating.
A close above $160 is a breakout and is unlocking an uncharted zone up to the closest psychological mark $200.
A close below $124 is a retest to the nearest demand zone at the same level.
A close below $118 is unlocking $88 mark.
#STOCKS #STOCKMARKET #NVDA #NVIDIA #SUPPLYANDDEMAND #AHMEDMESBAH

#Bitcoin $BTCUSD The Wedge dilemma.CRYPTO:BTCUSD Key Levels:
1. 109k
2. 150k
3. 85k
4. 75k
CRYPTO:BTCUSD is currently trying to break a historical, old and respectful channel's upper wedge. Technically speaking, this wedge is a very significant level where it has been tested 5 times so far "illustrated on the chart". The last 2 attempts have shown that the wedge is still valid.
Scenario A:
Euphoria and institutions buying pressure will keep the price trading close enough to the wedge until it breaks out where it unlocks a new uncharted zone extended to the next psychological mark 150k.
Scenario B:
Price falls back to the nearest visible and massive demand zone around the 75k mark.
I lean on a correction to the closest demand zone around the 75k mark.
Corrections:
It is worth noting that every time the price tests this wedge it causes a significant correction. "Check the illustrated table on the chart".
Conclusion:
Closing above 116k unlocks an uncharted zone to 150k
Trading below the historical wedge will lead eventually to a retest of the 75k price level.
#BTC #BITCOIN #CRYPTO #ANALYSIS #AHMEDMESBAH #SUPPLYANDDEMAND #BLOCKCHAIN #ETHEREUM

USDSGD: Potential Short from Key ResistanceThe USDSGD pair is approaching a notable resistance zone around the 1.37160 level, an area that has historically acted as a supply zone, leading to price reversals. The current price action shows signs of hesitation as it tests this zone, which could indicate potential weakness.
If sellers regain control, the pair could reverse downward, with the 1.35041 level being a likely target for the next support zone.

XAUUSD DailyIt is expected that after hitting the desired level, we will see a reversal trend. My personal view is that it will break through the previous low and reach the range of 2530 or at least retrace 50%, but this analysis could take time on a daily timeframe.

Intraday Levels for Nasdaq 100 Futures - 01/21/2025This analysis focuses on the Nasdaq 100 Futures, aiming to identify potential support and resistance levels where the price could experience intraday bounces or trend reversals, as well as zones where the price might potentially break higher or move lower.
Considerations
The range used in this analysis serves only as a reference for broader-level insights.
For intraday operations, it is advisable to utilize a lower timeframe to refine entry and exit points more accurately.
To confirm the validity of these levels, it is essential to evaluate real-time conditions as the price approaches these zones. Factors such as pressure, trading volume, and Order Flow will play a critical role in determining whether these supports hold or are likely to be broken.

ETH: Breaking 3300 is Key for Upside MomentumKeywords: Ethereum (ETH), Cryptocurrency, Trading, Technical Analysis, Resistance, Support, Breakout, Price Action, Consolidation, Accumulation, Bullish, Bearish, Trend
ETH is currently consolidating in a tight range below the crucial 3300 resistance level. This level has been acting as a significant barrier to further upside momentum.
Price Action:
We're witnessing a classic battle between bulls and bears. Buyers are trying to push prices higher, while sellers are defending the 3300 level.
Volume has been relatively low during this consolidation phase, suggesting indecision and a potential accumulation phase.
A decisive break above 3300 would be a strong bullish signal, potentially igniting a fresh wave of buying pressure.
Technical Analysis:
The 3300 level has acted as strong resistance on multiple occasions.
A break above this level would invalidate the bearish bias and open the door for a potential move towards 3600.
Conversely, a failure to break 3300 and a subsequent drop below a key support level 3200 would increase the likelihood of further downside.
Trading Strategy:
Wait for a decisive break above 3300.
Consider entering long positions on a breakout confirmation with a stop-loss below the breakout level.
Monitor volume and price action closely for any signs of weakness.
Disclaimer: This is not financial advice. Do your own research and consult with a qualified financial advisor before making any investment decisions.
Remember:
Price action is dynamic.
Markets can be unpredictable.
Always practice proper risk management.

AUDCHF at Key Resistance: Will It Drop To 0.56714?OANDA:AUDCHF is at a significant resistance area that has consistently acted as a barrier for bullish momentum. The recent price action suggests a potential for sellers to step in and drive prices lower from this zone.
If rejection signals, such as bearish engulfing candles or upper wicks, appear, I expect a move toward 0.56714. A break above this resistance, however, could indicate a shift in market sentiment.
Traders should wait for confirmation before entering short positions and ensure proper risk management. If you have any thoughts or agree with this analysis, I’d love to hear your perspective in the comments!

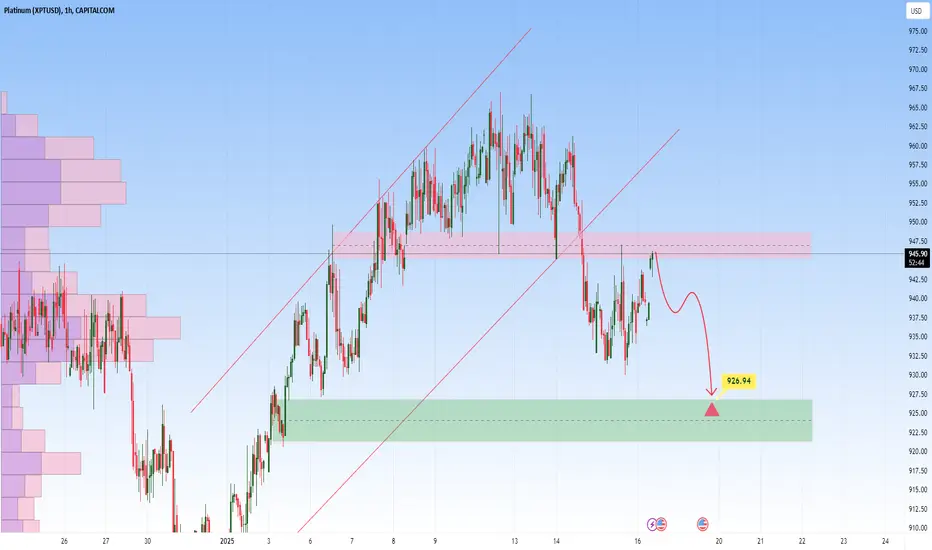
Platinum – Potential Short Setup with RetestPlatinum is currently trading below a key resistance zone, following a breakdown from the ascending channel. The recent bearish momentum indicates the potential for a continuation lower if the price fails to reclaim the resistance zone.
If the price retests this zone and shows rejection signals—such as bearish wicks, engulfing candles, or decreased buying pressure—it would strengthen the case for a short trade. In this scenario, the next target for sellers would be the $926.94 support zone, where buying interest may re-emerge.
This setup aligns with the broader bearish structure following the channel breakdown. Traders should monitor price action closely at the resistance level for confirmation of rejection before entering short positions.
GBPCAD - Bullish Setup at Key Support ZoneThe GBPCAD pair is currently approaching a significant demand zone that has historically acted as a strong support level, leading to bullish reversals. The recent downward momentum brings the pair into this area, where buyers might regain control.
A bullish confirmation, such as a strong rejection pattern, bullish engulfing candles, or long lower wicks, would indicate a potential upward move. If buyers step in, the price may head toward the 1.77424 level.
This setup suggests a possible short-term rebound in line with the broader market structure.
