EURUSD - Where next?Looking at EURUSD
I still feel like we are due some sort of deeper retracement to the downside considering how bullish the 4H and Daily time frame have been in recent times.
Although the market does not care how I feel in all honesty haha. I will play the short term short until the 15min orderflow switches bullish once again.
The expansion that is currently happing right now is very interesting and makes a good watch to see what we will do come market open as we are engineering liquidity for both a buy and sell with both POI's looking primed for entries.
Will be keeping a close and keen eye on EURUSD when the market opens
Any questions feel free to give me a message
Supply_and_demand

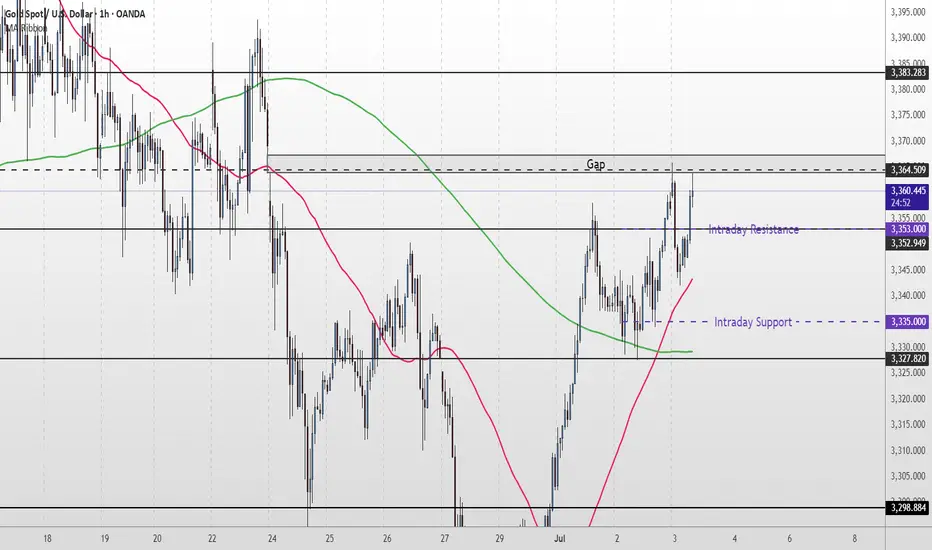
Gold Short Term OutlookYesterday, we highlighted that gold had reclaimed the 200MA and that the $3,327 support level needed to hold for further upside. Since then, price has steadily climbed and is now testing the $3,364 resistance — a level that also aligns with an unfilled gap.
Price action remains bullish for now, with price holding firmly above both the 50MA and 200MA.
If buyers manage to clear and hold above $3,364, we could see further upside toward $3,383 and $3,400, with possible extension into $3,418.
However, if price fails to break above $3,364, we may see a pullback into the $3,335–$3,327 zone. A break below there could open the door for a deeper drop into $3,298 or even $3,270.
📌 Key Levels to Watch:
Resistance:
$3,364 • $3,383 • $3,400 • $3,418
Support:
$3,352 •$3,335 - $3,327 • $3,298 • $3,270
🧠 Fundamental Focus:
📌 ADP Non-Farm Employment Change
📌 Initial Jobless Claims
📌 ISM Services PMI
📌 ISM Non-Manufacturing PMI
⚠️ With multiple red folder events on the calendar, expect elevated intraday volatility. Manage risk accordingly.
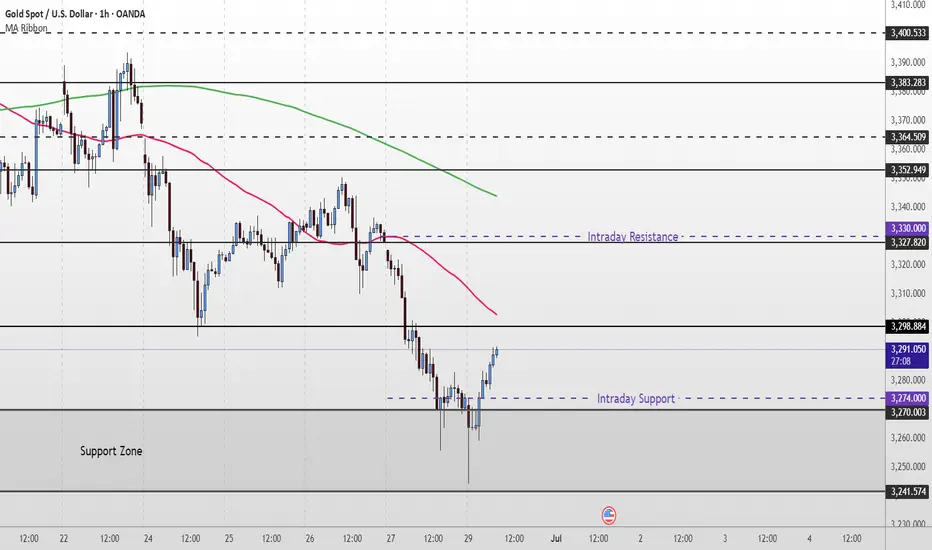
Gold Short Term OutlookYesterday, we noted that gold was attempting a recovery from the Support Zone but remained below both the 50 and 200 MAs, meaning bearish pressure was still intact.
Since then, price has broken and held above $3,298, and is now trading around $3,330, just beneath the 200MA.
This marks a shift in short-term momentum — gold has reclaimed the 50MA and is now challenging the 200MA.
If bulls manage to break and hold above the $3,327 resistance, it could open the path toward $3,352 - $3,364 and potentially higher resistance zones.
However, if price rejects the 200MA and fails to hold above $3,327, we may see a pullback toward $3,298 or deeper into $3,270, where bulls could look to reload.
📌 Key Levels to Watch:
Resistance:
$3,327 • $3,364 • $3,383 • $3,400
Support:
$3,298 • $3,270 • $3,241
🧠 Fundamental Focus:
📌 Fed Chair Powell speaks today at the ECB Forum in Portugal.
Markets will closely watch for any shift in tone on inflation or rate outlook. His comments may influence USD direction and gold volatility.
📌 ISM Manufacturing PMI – a key gauge of economic activity. A strong print may pressure gold; a weak reading could support it.
📌 JOLTS Job Openings – offers insight into labor market strength. A tighter market could delay rate cuts and weigh on gold.
With multiple risk events packed into today, expect increased volatility across the board.

BTCUSDT in a sell zone Let's keep it simple.
The IOF is bearish on the H4 timeframe.
Price has retraced to a premium zone.
Technically, once we see a lower timeframe confirmation from these zones, we take a sell.
While I'm eyeing the liquidity at 109050, any break below 106415 will usher us into a sell towards 99000.
Use your proper entry confirmation and risk management.

Gold Short to Medium Term Outlook
Last week, gold bounced from the lower Support Zone after briefly breaching $3,270. Price is now attempting a recovery, currently trading near $3,290, but remains below both the 50 EMA and 200 EMA — confirming bearish pressure is still intact.
For bulls to gain momentum, we need to see a clean break and hold above $3,298–$3,327which would open the path toward $3,352 and possibly higher resistance levels like $3,364 and $3,383.
Until then, this move may simply be a short-term pullback within a broader downtrend. If price fails to reclaim $3,327, watch for a drop back toward $3,270, with a deeper correction targeting the $3,241–$3,211 zone.
📌 Key Levels to Watch:
Resistance:
$3,298 • $3,327 • $3,352 • $3,364 • $3,383
Support:
$3,270 • $3,241 • $3,211 • $3,179
🧠 Fundamental Focus:
This week is packed with high-impact events — including FOMC minutes on Wednesday and Non-Farm Payrolls on Friday. Both events could trigger sharp moves in gold, so stay cautious and manage risk wisely.
Market Re-Cap and Outlook for NEXT WEEKHere I am giving you a little insight as to what trades I am currently in, taken & looking to take for the week just gone and the week coming.
1 Winning trade on EU
1 Current open position on EU
EURGPB - Breakdown
AUDUSD - Breakdown
NZDUSD - Breakdown
Gold - Breakdown
If there are any pairs you would like me to share my feedback on give me a message and I will be happy to try and do so.
Thanks
Happy Hunting

EURUSD - Potential buying opportunityLooking at EURUSD
We are still very bullish with no sign of it slowing.
I am aware of a potential weekly liquidity point to the left, however, until EURUSD shows its hand it's important that we still remain bullish.
We have set up a lovely liquidity point before a lovely demand area.
So I will be setting a pending order at the demand area after the New York close and the Asian session begins.

Bitcoin on Resistance levelMy current view. I am sitting mostly in cash waiting for a breakout or fall to buy the dip NFA

Gold Short Term OutlookYesterday, we noted that gold needed to close and hold above the $3,330 resistance to open the path toward $3,346 and potentially $3,375.
Since then, price rejected the intraday support and is now trending above the $3,330 level.
Currently, the 50MA is acting as dynamic resistance. A clean break above it could trigger a move toward $3,346 and possibly higher resistance zones.
However, if bullish momentum fades, price may drop back toward the key support area, where buyers could look to step in again.
🔑 Key Levels:
Resistance:
$3,330 • $3,346 • $3,361 • $3,375
Support:
$3,306 • $3,287 • $3,271 • $3,242

EURUSD - Looking to the upside retest of SupplyLooking to the upside, first lets get that push to lower level of liquidity swing then a push to the upside. Only on bullish confirmation at our highlighted level. I think we have one more retest before catching a potential short (pullback) on the larger time frame. Long term target for EURUSD is 1.200.

Gold Short Term OutlookGold dipped into the Support Zone but failed to sustain the breakdown below it. After briefly breaking below the zone, price has rebounded and is now attempting a short-term recovery.
However, structure remains bearish, with price trading below both the 50MA and 200MA, signalling continued downside pressure unless momentum shifts.
For bullish momentum to continue, we need to see a clean break and hold above $3,330, which may open the path toward $3,346, then $3,361.
If the move up doesn’t hold, the next reaction is expected near key support.
🔑 Key Levels:
Resistance:
$3,330 • $3,346 • $3,361 • $3,375
Support:
$3,306 • $3,287 • $3,271 • $3,242
📌 Stay patient and wait for confirmation before committing to a direction.

Gold Short Term OutlookYesterday’s chart idea is playing out as analysed.
Gold failed to break above the $3,395 resistance and has now pulled back, currently testing the first support zone — aligned with the 4H 200MA and Daily 50MA.
If this area fails to hold, price is likely to head toward the next key support zone, where we expect a potential reaction.
To resume bullish momentum, we need to see a strong close above $3,346. Key bullish zones remain $3,375 and $3,395.
📌 Key Levels to Watch:
Resistance:
$3,375 • $3,395 • $3,418 • $3,439
Support:
$3,361 • $3,346 • $3,330 / $3,306
$3,287 – Critical demand zone
🧠 Fundamental Focus:
All eyes are on Fed Chair Powell’s testimony today, which may offer clues about the Fed’s rate outlook and inflation stance. Any hint of continued hawkishness could weigh on gold, while dovish commentary may trigger renewed upside interest.
Expect heightened intraday volatility around his remarks — stay cautious.

Gold Short Term OutlookGold is currently trading around $3,368, caught between dynamic moving average resistance and an intraday resistance zone.
Price must break and hold above the $3,378 resistance to open the path toward $3,395. A confirmed break above the key $3,395 level could signal the start of the next bullish leg.
However, repeated failure to break above $3,395 — or even $3,378 — may drag gold lower into key support zones.
📌 Key Levels to Watch:
Resistance:
$3,375 • $3,395 • $3,418 • $3,439
Support:
$3,361 • $3,346 • $3,330 / $3,306
$3,287 – Critical demand zone
🧠 Fundamental Insight:
Gold remains supported amid rising geopolitical tensions. Over the weekend, U.S. airstrikes targeted Iranian nuclear sites, escalating concerns over a broader conflict in the Middle East. This has reignited safe-haven demand, with gold catching a bid despite recent technical pullbacks.
Meanwhile, traders are weighing softer U.S. inflation signals against the Fed’s cautious stance. If tensions persist and economic data weakens, gold could benefit from both risk-off flows and increased speculation around potential rate cuts.

Gold Medium Term OutlookGold is currently trending within a rising channel after rejecting the $3,439 resistance zone, which marked a new Higher High (HH). Price is respecting the ascending channel support and is now testing the 50MA. The uptrend remains intact, with a sequence of Higher Lows (HL) and Higher Highs (HH) forming within the channel.
A break and hold above $3,378 could open the path for a re-test of $3,439 and potentially $3,501. However, failure to hold the rising channel support may shift momentum bearish, with $3,303 and $3,226 as the next major downside targets.
📌 Key Levels to Watch This Week:
Resistance: $3,378 • $3,439 • $3,501
Support: $3,303 • $3,226 • $3,171
🧠 Fundamental Insight:
Gold remains supported amid rising geopolitical tensions. Over the weekend, U.S. airstrikes targeted Iranian nuclear sites, escalating concerns over a broader conflict in the Middle East. This has reignited safe-haven demand, with gold catching a bid despite recent technical pullbacks.
Meanwhile, traders are weighing softer U.S. inflation signals against the Fed’s cautious stance. If tensions persist and economic data weakens, gold could benefit from both risk-off flows and increased speculation around potential rate cuts.

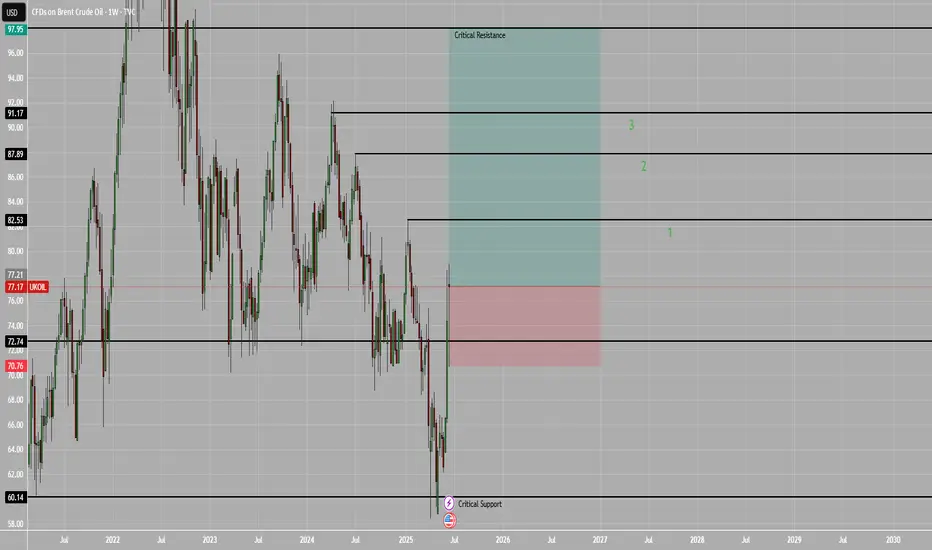
UKOILHello Traders
Oil will be Bullish in the next months
Bottom Support in 60$
and Goals 87, 91, 94, and 98
The most Important Resistance
is 98
If the Price closes this month above 72.74$, The target in the next goal will be achieved
Hope you Good luck
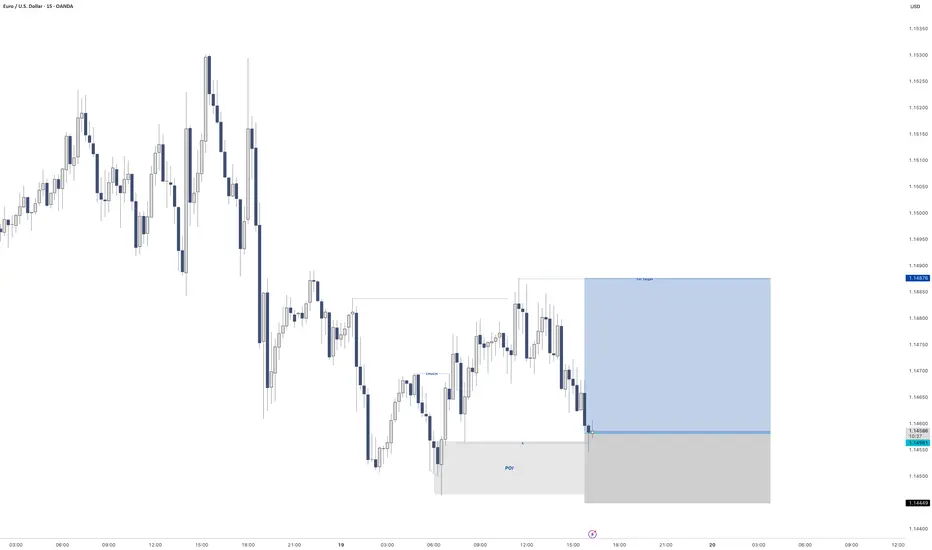
EURUSD - 2nd potential entryEvening all
Here is a still screenshot of what I am looking for the market open on EURUSD come Sunday night after the spreads have died down on the pair.
My pending order will go directly on the FVG with my stops below the manipulation of the range.
If I get tagged in great. If I don't also great if we continue to move high I mill just manage the one position.
If I am tagged in I will give you and update with a new idea and then depending on how that idea plays out win or lose I will come back and re-visit it and break it down some more.
However I have high hopes for this trade to make it up to 1.16300
Have a great weekend
and I will speak to you all soon

EURUSD - BreakdownApologies video is a bit rushed.
Wanted to get it done before the weekend arrived.
There's so much more to this video and entry reason that I have left out unintentionally like the fact we swept the Asia lows before creating a BoS. There are also a few other things like I have left out but without looking at the chart right now I cannot remember off the top of my head.
I will post the idea of this trade below so you can see that I was taking it before it played out.
Hope you all have a great weekend and a better trading week than you had this week.
Enjoy
P.S if you have any questions please do message

Play on levelsMonthly closing above 66 is actually
an important Support.
Retest of Trendline done.
Weekly Support is around 71 - 68.
Immediate Resistance is around 91 - 92.
If this level is sustained, we may witness 96 - 97

EURUSD - LongGreat set. Very close to Demand on the HTF to the left.
CHoCH on the 15min that left behind some liquidity.
Also created some liquidity to the right.
Very nice set up for me.
Triggered into the trade
Lets see how we go
EURUSD - SHORT We have built up quite a lot of liquidity before our major supply zone.
Will give an update in the morning after seeing where price is at

GOLD - Selling opportunity on the horizonLooking at gold.
We have a nice bearish continuation orderflow on the 15min TF.
We have a nice potential inducement level of liquidity that we are more than likely to take before moving lower.
This is a reduced risk entry due to where we are on the higher TF as we are pulling into a potential demand zone on the higher timeframe.
ITS REALLY IMPORTANT to remember where we are in terms of structure and as we well know Gold doesn't tend to fall for to long as it remains bullish the majority of the time. so in regards to the HTF like I mentioned above we are still bullish so we are expecting a reversal for the longer term at some point in the near future so this could be a case of get what we can from the market and then look for our LTF orderflow to switch Bullish before then looking for them long entries

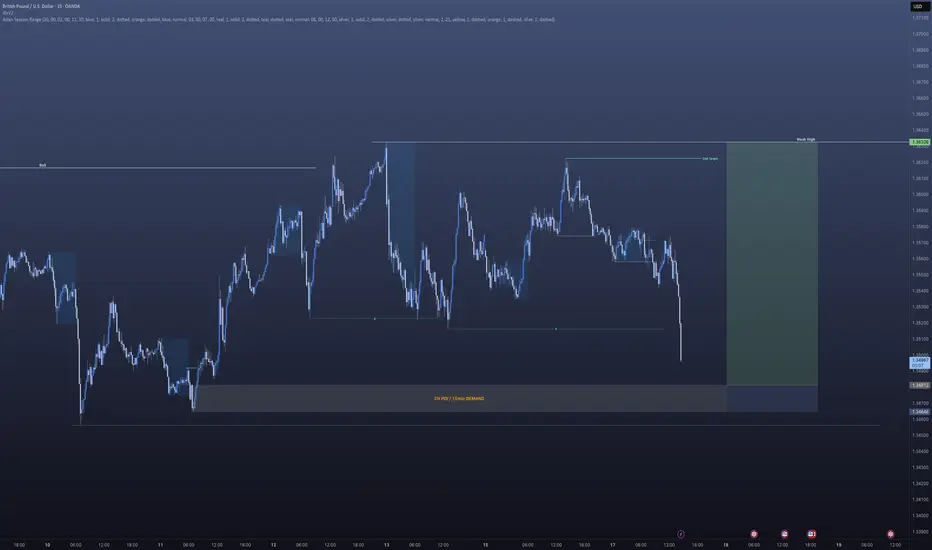
GBPUSD - Next point of interestAfternoon All,
So our GBPUSD trade from earlier didn't quite go to plan however I knew full well that we were building liquidity to the left on the higher timeframe.
This will be my next point of interest for a potential long.
Lets see how price plays out when we get down there.
GBPUSD - LongUnfortunately I can't post the idea on the 5min to give you a better idea of where we are at in terms of the entry for this.
However I am looking to be tagged into this trade and have a limit order where I have set it.
Hoping to be tagged in. If we aren't we move on. and if we lose we move on.
If im able to help with any questions you may have do send them my way
