AUDUSD. Medium-term and short-term forecastHello traders and investors!
I'll share the forecast I made in mid-March.
On the weekly chart, there's a sideways movement, with a bullish vector 5-6 targeting 0.69205.
On the daily chart, we also see a sideways movement, with a bullish vector 7-8 targeting 0.66345, 0.66676.
I'm awaiting price interaction with the daily targets to update the forecast.
For a more detailed explanation of how to read charts and consider different timeframes when looking for trades, you can refer to the article
Supply_and_demand

Alikze »» Link | Support on the major ceiling💎 In the daily and weekly time, it is moving in an ascending channel, which is currently suffering after breaking the channel on the ceiling of the previous wave channel that broke.
💎 If this three-wave corrective movement ends in the green box area, I expect it to move towards the next target of the supply zone specified in the chart.
💎 The first scenario : in the corrective microwaves of these three waves, the last log seems to have finished the correction and the probable scenario is the completion of this correction in the support zone, which we must witness the continuation of the trend.
🔔 The second scenario : In addition, if it penetrates the green subbox, the next alternative scenario can be imagined for it.
»»»«««»»»«««»»»«««
Please support this idea with a LIKE and COMMENT if you find it useful and Click "Follow" on our profile if you'd like these trade ideas delivered straight to your email in the future.
Thanks for your continued support.
Sincerely.❤️
»»»«««»»»«««»»»«««

Sell GBPCAD Bearish ChannelThe GBP/CAD pair on the M30 timeframe presents a potential selling opportunity due to a well-defined channel pattern. This suggests a shift in momentum towards the downside in the coming Hours.
Key Poin ts:
Sell Entry: Consider entering a short position around the current price of 1.7405, positioned close to the top of Channel. This offers an entry point near the perceived shift in momentum.
Target Levels:
1st Support – 1.7373
2nd Support – 1.7352
Stop-Loss: To manage risk, place a stop-loss order above 1.7425 This helps limit potential losses if the price unexpectedly reverses and breaks back upwards.
Thank you.

XAUUSD H4Gold has uptrend now. Some of zone has low volume and high volume. In my point of view it will make a fake zone then drop after one candle drop it can be continue.

Sell AUDCAD Symmetrical TriangleThe AUD/CAD pair on the M30 timeframe presents a Potential Selling Opportunity due to a recent breakout from a Triangle Pattern. This suggests a shift in momentum towards the downside in the coming hours.
Possible Short Trade:
Entry: Consider Entering A Short Position below The Broken Trendline Of The Triangle After Confirmation. Ideally, This Would Be Around 0.9070.
Target Levels:
1st Support – 0.9028
2nd Support – 0.9007
Stop-Loss: To manage risk, place a stop-loss order above 0.9090. This helps limit potential losses if the price falls back unexpectedly.
Bearish Breakdown:
Triangle Breakout Retest: The price action recently broke above a bullish triangle, indicating a potential uptrend. However, it has now returned to retest the broken resistance line of the triangle. This retest often precedes a reversal.
Ichimoku Cloud Resistance: The price is currently hovering near the Ichimoku cloud, which can act as a resistance zone. A rejection from this area could further strengthen the bearish case.
Thank you.

Buy USDCHF Triangle BreakoutThe USD/CHF pair on the M30 timeframe presents a Potential Buying Opportunity due to a recent breakout from a Triangle Pattern. This suggests a shift in momentum towards the upside and a higher likelihood of further advances in the coming hours.
Possible Long Trade:
Entry: Consider Entering A Long Position Above The Broken Trendline Of The Triangle After Confirmation. Ideally, This Would Be Around 0.9150
Target Levels:
1st Resistance – 0.9178
2nd Resistance – 0.9191
Stop-Loss: To manage risk, place a stop-loss order below 0.9125. This helps limit potential losses if the price falls back unexpectedly.
Opportunity Breakdown:
Triangle Breakout: Price action recently broke above a bullish triangle, a continuation pattern suggesting further upside potential.
Retest Confirmation: The price has retested the broken resistance line of the triangle and held, indicating strong buying pressure. This retest adds confidence to the breakout.
Ichimoku Cloud Support: The current price sits comfortably above the Ichimoku cloud, a technical indicator that often signals bullish momentum when the price is above the cloud.
Thank you.

Buy GBPAUD Triangle BreakoutThe GBP/AUD pair on the M30 timeframe presents a Potential Buying Opportunity due to a recent breakout from a Triangle Pattern. This suggests a shift in momentum towards the upside and a higher likelihood of further advances in the coming hours.
Possible Long Trade:
Entry: Consider Entering A Long Position Above The Broken Trendline Of The Triangle After Confirmation. Ideally, This Would Be Around 1.9235.
Target Levels:
1st Resistance – 1.9334
2nd Resistance – 1.9400
Stop-Loss: To manage risk, place a stop-loss order below 1.9180. This helps limit potential losses if the price falls back unexpectedly.
Opportunity Breakdown:
Triangle Breakout: Price action recently broke above a bullish triangle, a continuation pattern suggesting further upside potential.
Retest Confirmation: The price has retested the broken resistance line of the triangle and held, indicating strong buying pressure. This retest adds confidence to the breakout.
Ichimoku Cloud Support: The current price sits comfortably above the Ichimoku cloud, a technical indicator that often signals bullish momentum when the price is above the cloud.
Thank you.

Alikze »» MANA | Ready to retest the resistance zoneIn the last two posts, the Mana currency experienced a growth up to the specified area. After making a head and shoulder pattern in the roof of the channel, it faced a correction, which continued until the 36 cent area.
💎 Currently, due to the candle that has broken the support zone, it has become a stubborn resistance.
💎 Therefore, I expect that considering that a double bottom is currently formed with a retest of the area and with the support of the 39 cents range, it can attack again to break it, that this attack can continue up to the midline of the channel and then it can reach the ceiling. Continue the growth channel.
💎 Alternate scenario: If it loses the range of 39 cents and stabilizes below it, the next scenario can be substituted for it, which can extend to the green box area.
»»»«««»»»«««»»»«««
Please support this idea with a LIKE and COMMENT if you find it useful and Click "Follow" on our profile if you'd like these trade ideas delivered straight to your email in the future.
Thanks for your continued support.
Sincerely.❤️
»»»«««»»»«««»»»«««

LINKUSDT | MT Long H4 | Chainlink's Supply-Demand ZonePair: HTX:LINKUSDT
Timeframe: H4 - Medium Term (MT)
Direction: Long
Technical Confluences for Trade:
- Price have bounced off 61.8% Fibo retracement levels
- Price action is within two different parallel channels; 1 acts as a bottom channel support and the other is within a supply-demand zone channel
- Aiming for the 32.8% Fibo Retracement with 23.6% as the TP 1 level
Fundamental Confluences for Trade:
- Chainlink's progress has been remarkable and their latest application, Transporter allows users to move crypto assets and data across multiple networks.
- Further escalation of war risk may see risk assets get affected
Suggested Trade:
Entry @ Area of Interest 12.90 - 13.50
SL @ 11.59
TP 1 @ 14.48 (Close Half-Position & move SL to Entry level once TP1 is achieved)
TP 2 @ 16.03
Risk-to-Reward @ Approx. 2.26 (Depending on Entry Level)
May the pips move in our favor! Good luck! :D
*This trade suggestion is provided on an advisory basis. Any trade decisions made based on this suggestion is a personal decision and am not responsible for any losses derived from it.

EURGBP | Short H4 | Market Exec | Still Betting Against the EURTechnical Confluences for Trade:
- Stochastics are in Overbought Conditions on H4 and H1 time-frames
- Price action has multiple resistance from trendlines & also a horizontal trendline (supply zone)
Fundamental Confluences for Trade:
- Nothing much can dictate the movement of this FX pair as they are heavily trade-related like the AUDNZD. Any major movement will come from supply-demand areas, monetary policies or economic data gyrations.
Suggested Trade:
Entry @ Area of Interest 0.8590 - 0.8620
SL @ 0.8643
TP 1 @ 0.8562 (Close Half-Position & move SL to Entry level once TP1 is achieved)
TP 2 @ 0.8522
Risk-to-Reward @ Approx. 1.73 (Depending on Entry Level)
________________________________
Boosts 🚀, Follows ✌️, Shares 🙌 & Comments ✍️ are much appreciated!
If you have any ideas or charts, do share them in the 'Comments' section below and we can discuss our perspectives to improve or strengthen our strategies.
If you want something analyzed, do drop me a DM. :D
________________________________
Disclaimer: The above suggestion is an personal opinion in general and does not constitute as investment advice. Any decisions taken based on the above suggestion is purely your own risks.
Any websites / brokers / applications suggested here are also provided as informational purpose only.
________________________________

Alikze »» LPT | Pullback to broken structureAccording to the previous analysis that was reviewed in 1H time, after the correction to the support box, the demand was met, and the target touched the ceiling of the channel after the correction.
💎But currently, in 1H time, after hitting the ceiling of the channel, it is being corrected, and this correction can extend to the green box, in case of renewed support, it will face demand and touch the supply range target.
💎 Alternative scenario. If this rapid correction is extended to the green box, it will be possible to break it up to the range of 15.63.
»»»«««»»»«««»»»«««
Please support this idea with a LIKE and COMMENT if you find it useful and Click "Follow" on our profile if you'd like these trade ideas delivered straight to your email in the future.
Thanks for your continued support.
Sincerely.❤️
»»»«««»»»«««»»»«««

Alikze »» RUNE | Demand area supportIn the continuation of the daily time frame analysis, after the break of the trigger line and pullback to the broken structure, RUNE had a growth in accordance with the movement path, which again showed a positive reaction to this trigger line after correction.
💎 But in the 12H time frame, due to the momentum and upward guard and support in the green box, it can continue to grow after filling the FVG gap and breaking the trigger line up to the supply range and neck line.
💎 Therefore, in the first scenario: a possible scenario with support in the green box, we should see the FVG gap fill and climb up to the trigger line, which can continue this growth after its failure until the supply range.
💎 Second scenario: in case of weakness in the continuation of the trend and loss of the green box area, this correction can continue until 3.13.
»»»«««»»»«««»»»«««
Please support this idea with a LIKE and COMMENT if you find it useful and Click "Follow" on our profile if you'd like these trade ideas delivered straight to your email in the future.
Thanks for your continued support.
Sincerely.❤️
»»»«««»»»«««»»»«««

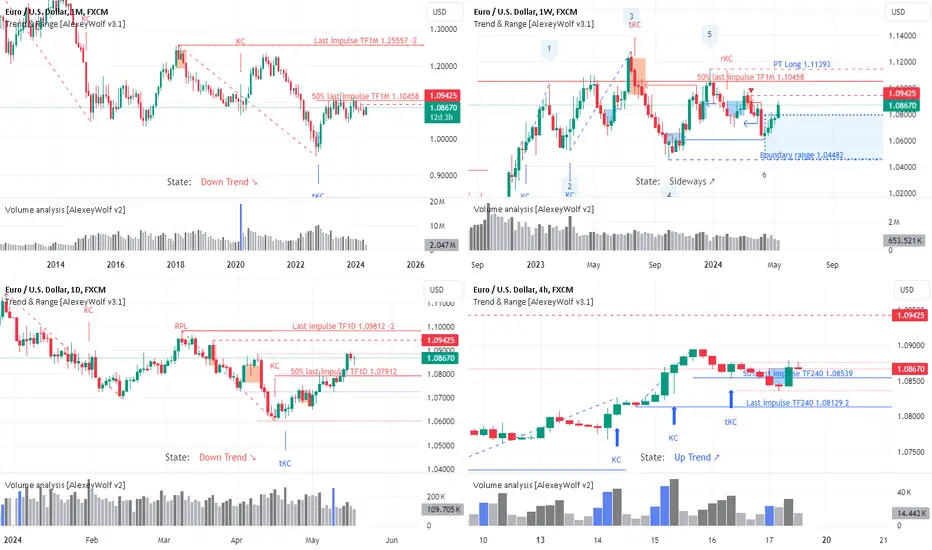
EURUSD. Trading opportunityToday I will analyze the asset on several time frames (1M, 1W, 1D, 4H) to find out where it is advisable to buy and where it is advisable to sell.
On the monthly timeframe , there is a bearish trend. The last bearish impulse started from the price of 1.25557. The price has touched the 50% level (1.10458) of the last bearish impulse several times. So far, I don't see a good resumption of the seller.
On the weekly timeframe , the price has formed a sideways range around the 1.10458 level (50% of the monthly bearish impulse). The bearish vector 5-6 has met the mandatory target (see the related idea for more details). Currently, the relevant buyer's vector is 6-7 with a potential target of 1.11393.
On the daily timeframe , there is a bearish trend. The last bearish impulse started from the price of 1.09812. The price has consolidated above the 50% level of the last bearish impulse (1.07912). So far, we haven't seen a resumption of the seller.
On the 4-hour timeframe , there is a bullish trend. The last buyer's impulse started from the price of 1.08129. The price dropped into the discount zone (below the 50% level of the last impulse - 1.08539). The buyer showed a good resumption (result, spread, volume) from the key candle of the impulse (marked "KC" on the chart).
Thus, on the monthly and daily timeframes, there is a bearish trend, with the price on both timeframes corrected to the 50% level, and no strong seller is observed at these levels. On the weekly timeframe, there is a sideways range with the relevant buyer's vector, and on the 4-hour timeframe, there is a buyer's trend. Based on this, in my opinion, it is now more appropriate to look for buying opportunities .
To understand where to look for buying opportunities, let's consider the lower timeframes: 90M, 15M, 3M.
On the 90-minute timeframe , the price has formed a sideways range. The mandatory target of the seller's vector 6-7 has been reached. The relevant buyer's vector is 7-8 with a potential target of 1.08785. The lower boundary of the sideways range is 1.08356. The upper boundary of the sideways range is 1.08828.
On the 15-minute timeframe , there is a bullish trend. The last buyer's impulse started from the price of 1.0846. The price has not yet interacted with the 50% level of the impulse (1.08623). At the base of the impulse, a buyer's zone has formed (blue rectangle on the chart) with the upper boundary at 1.08564.
On the 3-minute timeframe , the price has formed a sideways range. The seller's vector 9-10 has reached the mandatory target and touched the lower boundary of the sideways range at 1.08651 (point 6 of the sideways range). Below 1.08651, I assume there is seller's liquidity that the buyer might collect. Meanwhile, the 50% level of the buyer's impulse on the 15-minute timeframe is slightly lower - 1.08623.
It is appropriate to look for buying opportunities :
On the 4-hour timeframe from the buyer's defense of 1.08129.
On the 90-minute timeframe from the buyer's defense of 1.08356.
On the 15-minute timeframe from the buyer's defense of 1.08623 or from the resumption of the buyer from the zone (1.0846 - 1.08564).
On the 3-minute timeframe from the buyer's defense of 1.08651.
All long positions should be monitored closely or set with minimal targets due to the bearish trend on the daily timeframe.
It is appropriate to look for selling opportunities :
On the daily timeframe from the levels of 1.09425 or 1.09812.
On the weekly timeframe from the level of 1.11393.
Alikze → LINA | Pullback is broken into the swingtime D1 and W1, after supporting in the green box area and breaking the swing and pullback, it is now ready to continue growing and has the ability to move to the specified areas. The most important resistance in the weekly time is the range of 0.012210, the breaking of which and its high stabilization will continue the upward trend until the area of the weekly supply zone.
🟩Sup:0.009155
⛳️Tp 1:0.012210
⛳️ Tp2 :0.012980 - 0.013730
⛳️ Tp3 :0.027460 - 0.030520
------------------
Please support this idea with a LIKE and COMMENT if you find it useful and Click "Follow" on our profile if you'd like these trade ideas delivered straight to your email in the future.
Thanks for your continued support.
Sincerely.❤️

Alikze »» KSM |Upward wave 5 scenarioAccording to the analysis of the previous post, both targets are touched with the support of $40. Again, after touching the bottom of the channel, there is a demand that will be able to break this supply area to the $59 range. But in the daily and weekly time, it is in the 5th rising wave, which will at least have the ability to reach the previous supply range or the previous major ceiling. After completing this cycle in the weekly time, if the $100 area is broken, its path will be paved to the $250 area to continue climbing.
🟩Sup:50
⛳️Tp 1:59
⛳️ Tp2 : 64
⛳️ Tp3 :81- 87
»»»«««»»»«««»»»«««
Please support this idea with a LIKE and COMMENT if you find it useful and Click "Follow" on our profile if you'd like these trade ideas delivered straight to your email in the future.
Thanks for your continued support.
Sincerely.❤️

Alikze → ETC | Completing wave B correctiveIn time D1, with an ascent in the form of three waves, it is out of density with several spike candles. According to the type of behavior and structure, if the current correction moves in the form of three waves, two scenarios can be considered for it.
The first scenario: the upward corrective movement will continue to the $28 area and then to the $25 area as a higher correction and will not touch the previous floor, which, if supported, will have the ability to grow to the specified area of the supply zone.
Second scenario: the correction to $28 continues and then the C wave correction should break the $25 area and at least the bottom of the spike candle will continue.
🟩Sup:25$
-----------------
Please support this idea with a LIKE and COMMENT if you find it useful and Click "Follow" on our profile if you'd like these trade ideas delivered straight to your email in the future.
Thanks for your continued support.
Sincerely.❤️

Alikze »» LPT | Ready to correct up to the support zoneIn time 1h, it is moving in an ascending channel, which is currently in the specified supply area, and has tried to break the range twice.
According to the structure, it can have a correction up to the green box area.
💎 In addition, if it meets the demand and can break the area, it can continue the route to the roof of the channel.
»»»«««»»»«««»»»«««
Please support this idea with a LIKE and COMMENT if you find it useful and Click "Follow" on our profile if you'd like these trade ideas delivered straight to your email in the future.
Thanks for your continued support.
Sincerely.❤️
»»»«««»»»«««»»»«««

AUD-USDThe audusd pair creates a resistance level at 0.66500. The market touched this zone three times.This resistance is very important because last three to four times price stop it's bullish momentum and moved down side towards the support area. if the market holds this resistance level then the market again goes to downward levels.

XAUUSD LONG AND SHORTHi Guys, its been a long time since i published an analysis. and I'm back again
Gold sore the other day and reached the 2379 level which was the resistance, and has managed to cool off those buyers.
As always there are some demand and supply levels to take trade from. Our immediate demand level would be around 53-49 which upon reaching, with confirmation we will take trades. If the level is breached other levels below would become possible long points.
Those who want to go short ,currently level around 73-75 is a suitable point and above that levels 85,93,403,412,....
My view is that Before continuing higher market needs to see lower prices and demand levels to test.
* As always add your own intuition and logic into this analysis and proceed with safety measures in place.
Be honorable

CHF/JPY end of uptrendThe pair is slowing down. The RSI is showing a clear divergence. Price has tapped and reacted to the supply areas (tradable on LTF).
Once the pair breaks the trendline as well as the support I am ready to short.

ETHUSDT: Possible Swing Target Towards $4500! BINANCE:ETHUSDT
Price is in process of making ab=cd pattern where we have a possible order block placed too at the point of D which is our area of entry. Our initial target is at $3500 and then $4000 and lastly it will at $4500. We can achieve this target by end of this month or next one depending on how other Economic factors interfere with the price movement.
good luck.

Gold Buyers Back in the Fight; H1 Supports Call for AttentionControl changed hands in the gold space (XAU/USD) last week; buyers strengthened their grip, adding +2.5% and snapping a two-week losing streak a whisker off all-time highs of $2,431.
Technicals Favouring Buyers
Last week’s move was (technically) aided by support on the daily timeframe coming in from $2,280, a level which the Research Team were watching closely and recently noted the following (italics):
A move lower will unlikely breach bids from daily support at $2,280, which is an area buyers could look to defend as dip buyers (trend followers) attempt to enter the trend from support.
The above-mentioned support benefitted from a 1.618% Fibonacci projection ratio at $2,293. Among the Harmonic trading community, this is also referred to as an ‘alternate’ or ‘extended’ AB=CD formation. You will note that price has rallied beyond the 38.2% Fibonacci retracement ratio at $2,336, ending the week at $2,371, a 61.8% Fibonacci retracement ratio. Both of the aforesaid ratios are derived from the legs A-D of the AB=CD structure and tend to serve as upside targets for Harmonic traders.
Having seen the AB=CD structure complete (both upside targets achieved) and taking into consideration that the price of the yellow metal remains entrenched within an unmistakable uptrend (no matter which trend identification tool you employ, it all points to the same thing), together with the daily chart’s Relative Strength Index (RSI) rebounding from a combination of the 50.00 centreline and trendline support (extended from the low of 19.33), this remains a buyers’ market. The caveat is the weekly chart’s RSI recently pulling back from overbought highs not seen since mid-2020, though let’s not forget that this indicator can, and often does, remain overbought for prolonged periods in trending environments.
Direction This Week?
Given the bigger picture demonstrating scope to explore higher terrain, shorter-term structure on the H1 timeframe highlights neighbouring demand at $2,347-$2,355 as a possible platform buyers may work with this week. Failure to hold here unearths two additional levels of support to consider at $2,326 and $2,344.

75: Assessing Bitcoin's Weakening, Exploring Strategic OptionsAs we closely monitor the current trajectory of Bitcoin, it's evident that its strength is diminishing, prompting a thoughtful examination of our strategic options. In navigating this landscape, it's imperative to remain agile and responsive to market dynamics.
Should we witness a loss of the 65475 mark within the span of this week, the scenario of adopting short positions becomes a compelling consideration. This tactical move would capitalize on the prevailing bearish sentiment, potentially yielding favorable outcomes amidst downward price movements.
Conversely, if the aforementioned threshold remains unbreached, our focus shifts towards discerning signs of renewed bullish vigor within the market. We eagerly anticipate indications of resurgent momentum, signaling a favorable environment for reassessing and potentially bolstering our long positions.
In essence, our approach remains adaptive and nuanced, attuned to the ebb and flow of market dynamics. By remaining vigilant and responsive to emerging trends, we position ourselves to navigate the evolving landscape of Bitcoin trading with prudence and effectiveness.
