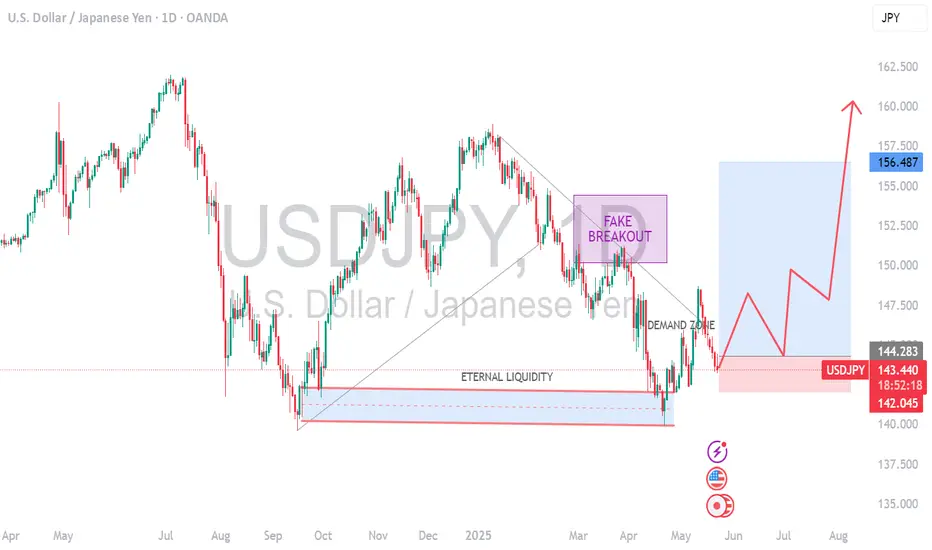
USDJPY- IS it a beginning of major bulish trend nowthe USD/JPY pair is currently in a major bullish trend, driven by several key factors:
1. Interest Rate Differentials: The U.S. Federal Reserve maintains higher interest rates compared to the Bank of Japan, attracting capital flows into the U.S. dollar and away from the yen.
2. Dovish Bank of Japan: Despite global tightening, the BOJ remains cautious about raising rates or ending yield curve control, weakening the yen further.
3. Robust U.S. Economic Data: Strong economic indicators from the U.S. (such as inflation, jobs, and GDP growth) continue to support expectations of prolonged higher rates, boosting the dollar.
Supply_and_demand
BTCUSD / BITCOIN | 4H | WAIT BREAKOUT Good morning, my friends
Bitcoin support level is $96,900.00, while the resistance level stands at $104,600.00.
Right now, I'm just waiting for an upward breakout. Once that happens, I'll provide a clear target.
Don't forget to hit the like button so you don't miss any updates on this analysis.
My dear friends, your likes are the biggest motivation for me to keep sharing my analyses. I truly appreciate everyone who supports my work with their likes—thank you so much!
With respect and love.

AUDJPY at Key Resistance Level: Will it Drop To 92.850?OANDA:AUDJPY is approaching a key resistance level that has previously acted as a strong barrier, triggering bearish momentum in the past. Given its historical significance, how price reacts here could set the tone for the next move.
If bearish signals emerge, such as rejection wicks, bearish candlestick patterns, or signs of weakening bullish pressure, I anticipate a move toward the 92.850 level. However, a clear breakout above this resistance could challenge the bearish outlook and open the door for further upside. It's a pivotal area where price action will likely provide clearer clues on the next direction.
Just my take on support and resistance zones, not financial advice. Always confirm your setups and trade with a proper risk management.
Best of luck!

EGX30 Trend Line AnalysisEGX30 stock is currently falling but rebounded at the support line 31,365.902. In case of taking an upward trend it is expected to breach the resistance line at 31,543.291, then reach the resistance line at 31,681.261. In case of falling it's expected to break the 1st support line 31,316.627 then the 2nd support line 31,227.932, then the 3rd support line 31,198.367

GBP/JPY Buy OpportunityA potential buy signal is forming on GBP/JPY due to a break above a key supply zone. This breakout indicates strong bullish momentum, suggesting further upside potential.

EURJPY Analysis: Range Bounces & BreakoutHello traders!
EURJPY is in a daily range and is offering three trading scenarios.
The first scenario suggests the pair may react bearishly from the currently approached zone, setting up a bounce opportunity that could drive price lower toward the 162.130 area.
The second scenario anticipates a bounce toward the 158.400 area, if price reaches the support zone of the range.
The third scenario anticipates a breakout above the resistance zone, followed by a retest, which could present a strong opportunity for continuation toward the 169.300 area.
Discretionary Trading: Where Experience Becomes the Edge
Discretionary trading is all about making decisions based on what you see, what you feel, and what you've learned through experience. Unlike systematic strategies that rely on fixed rules or algorithms, discretionary traders use their judgment to read the market in real time. It's a skill that can't be rushed, because it's built on screen time, pattern recognition, and the ability to stay calm under pressure.
There's no shortcut here. You need to see enough market conditions, wins, and losses to build that intuition—the kind that tells you when to pull the trigger or sit on your hands. Charts might look the same, but context changes everything, and that's something only experience can teach you.
At the end of the day, discretionary trading is an art, refined over time, sharpened through mistakes, and driven by instinct. It's not for everyone, but for those who've put in the work, it can be a powerful way to trade.

EURNZD Analysis: Bounce & BreakoutHello traders!
EURNZD is in a 1h range and is offering two trading scenarios.
The first scenario suggests the pair may react bearishly from the resistance zone, setting up a bounce opportunity that could drive price lower toward the 1.90000 area.
The second scenario anticipates a breakout above the resistance zone, followed by a retest, which could present a strong opportunity for continuation toward the 1.92000 area.
Discretionary Trading: Where Experience Becomes the Edge
Discretionary trading is all about making decisions based on what you see, what you feel, and what you've learned through experience. Unlike systematic strategies that rely on fixed rules or algorithms, discretionary traders use their judgment to read the market in real time. It's a skill that can't be rushed, because it's built on screen time, pattern recognition, and the ability to stay calm under pressure.
There's no shortcut here. You need to see enough market conditions, wins, and losses to build that intuition—the kind that tells you when to pull the trigger or sit on your hands. Charts might look the same, but context changes everything, and that's something only experience can teach you.
At the end of the day, discretionary trading is an art, refined over time, sharpened through mistakes, and driven by instinct. It's not for everyone, but for those who've put in the work, it can be a powerful way to trade.

SALIK (DFM) BOS confirmed the bulls are back in charge### 🌀 **Elliott Wave Structure**
* The stock completed a textbook 5-wave impulse (1 → 5).
* Followed by a complex **ABCDE correction**, ending with a liquidity sweep on Wave (E).
* Current price action is a **bullish breakout** — likely the start of a **new impulsive cycle**.
### 📐 **Fibonacci Extension Target**
* **7.35 = 100% Fib extension** of previous impulse (Wave 1–5), projected from Wave (E).
## 🎯 **Trading Setup**
| **Entry** | Market @ 5.90 |
| **Stop Loss** | Below 4.75 (beneath main OB) |
| **Take Profit** | 7.35 (100% Fib extension ) |
| **R/R Ratio** | \~1:3.6 |
---
> “SALIK finally ripped through resistance like butter. BOS confirmed the bulls are back in charge. That 7.35 target? It’s not just a guess — it’s fib math.”
> *“Fibonacci is the map. Price is the vehicle. Volume is the fuel.”*
---
### ⚠️ **Disclaimer**
> This is not financial advice. For educational purposes only. Always manage risk and use stop losses. Past performance doesn’t guarantee future results.


EURGBP Analysis: Two Daily POIsHello traders!
EURGBP is offering two trading scenarios on the daily timeframe.
The first scenario suggests the pair may react bullishly from the next zone, setting up a bounce opportunity that could drive price higher toward the 0.84400 area.
The second scenario anticipates a bounce toward the 0.83800 area, where a mean reversion setup may come into play (if buyers step in and price action confirms bullish intent near that support).
Discretionary Trading: Where Experience Becomes the Edge
Discretionary trading is all about making decisions based on what you see, what you feel, and what you've learned through experience. Unlike systematic strategies that rely on fixed rules or algorithms, discretionary traders use their judgment to read the market in real time. It's a skill that can't be rushed, because it's built on screen time, pattern recognition, and the ability to stay calm under pressure.
There's no shortcut here. You need to see enough market conditions, wins, and losses to build that intuition—the kind that tells you when to pull the trigger or sit on your hands. Charts might look the same, but context changes everything, and that's something only experience can teach you.
At the end of the day, discretionary trading is an art, refined over time, sharpened through mistakes, and driven by instinct. It's not for everyone, but for those who've put in the work, it can be a powerful way to trade.

XAUUSD/GOLD | 1H | SELL NOW Hello, everyone,
My gold target level is 3,190.0.
My friends, every single like from you is my biggest motivation to share my analysis.
Thank you very much to everyone who supports me with likes.

GBPNZD | 1H | SELL ZONEHey There,
After reaching my GBPNZD sell level, my target is now 2.23855.
Your likes keep me motivated to share my analyses, and I truly appreciate the support.
Big thanks to everyone showing love

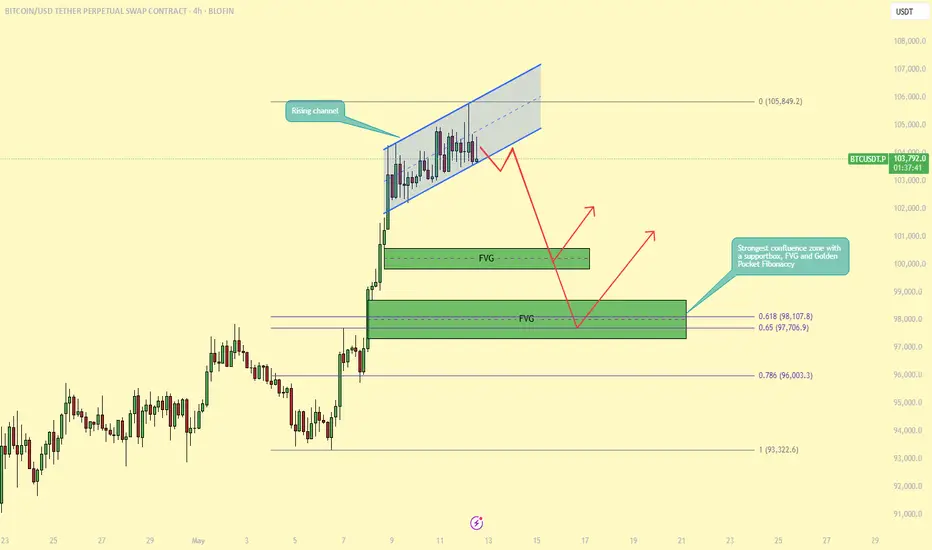
BTC Approaches All-Time High — But Signs of Weakness Emerge!BTC is once again approaching its all-time high (ATH) on the daily timeframe, generating excitement across the market. However, a closer look at the lower timeframes reveals signs of potential exhaustion as BTC encounters strong resistance. This suggests a pullback could occur before any continuation higher.
On the 4-hour and 1-hour charts, BTC is currently trading within a rising channel, which is often considered a bearish continuation pattern, especially when it forms directly below a key resistance level like the ATH. Price action within this structure is starting to lose momentum, and the presence of bearish divergences and decreasing volume further supports the likelihood of a near-term correction.
Where Could We Buy the Dip?
A pullback may offer a strategic entry opportunity for traders looking to ride the next leg up. Notably, two fair value gaps (FVGs) were created during the recent upward move. The first FVG could provide a minor bounce, but the second one is more compelling for a higher-probability long setup.
This second FVG aligns with a well-established support zone and coincides with the Golden Pocket of the Fibonacci retracement (between the 0.618 and 0.65 levels). This confluence of technical factors makes it a strong area of interest for bulls, and a potential springboard for price to retest, and possibly break, the ATH.
In summary, while BTC is showing strength on the higher timeframes, lower timeframe patterns suggest that a healthy correction is likely. Patience and proper level selection will be key. Watching how price reacts around the second FVG and the Golden Pocket zone may present one of the best opportunities for re-entry.
-------------------------------
Thanks for your support.
- Make sure to follow me so you don't miss out on the next analysis!
- Drop a like and leave a comment!
USDCHF Analysis: Break & Retest or Mean Reversion?Hello traders!
USDCHF is offering two trading scenarios on the daily timeframe.
The first scenario suggests the pair may react bearishly from the resistance zone, setting up a break-and-retest opportunity that could drive price lower toward the 0.80001 area.
The second scenario anticipates a bounce toward the 0.89100 region, where a mean reversion setup may come into play (if sellers step in and price action confirms bearish intent near that resistance).
Discretionary Trading: Where Experience Becomes the Edge
Discretionary trading is all about making decisions based on what you see, what you feel, and what you've learned through experience. Unlike systematic strategies that rely on fixed rules or algorithms, discretionary traders use their judgment to read the market in real time. It's a skill that can't be rushed, because it's built on screen time, pattern recognition, and the ability to stay calm under pressure.
There's no shortcut here. You need to see enough market conditions, wins, and losses to build that intuition—the kind that tells you when to pull the trigger or sit on your hands. Charts might look the same, but context changes everything, and that's something only experience can teach you.
At the end of the day, discretionary trading is an art, refined over time, sharpened through mistakes, and driven by instinct. It's not for everyone, but for those who've put in the work, it can be a powerful way to trade.

USOIL | 4H | SWING TRADING Good morning, dear friends
Due to high demand, I’ve prepared a USOIL analysis for you. My target level is set at 63.600.
Once my target is reached, I’ll be sharing updates under this post.
Dear friends, your likes are always my biggest motivation to keep sharing analyses. That’s why I kindly ask each of my followers to show their support—please don’t hold back on the likes.
I sincerely thank everyone who supports me with their likes. It truly means a lot

USDCAD Analysis: Three Bounce ScenariosHello traders!
USDCAD is offering three trading scenarios on the daily timeframe.
The first scenario suggests the pair may react bullishly from the currently approached zone, setting up a bounce opportunity that could drive price higher toward the 1.41600 area.
The second scenario anticipates a bounce toward the 1.37586 region, where a mean reversion setup may come into play (if buyers step in and price action confirms bullish intent near that support).
The third scenario anticipates a bounce toward the 1.34150 region, where a mean reversion setup may come into play (if buyers step in and price action confirms bullish intent near that support).
Discretionary Trading: Where Experience Becomes the Edge
Discretionary trading is all about making decisions based on what you see, what you feel, and what you've learned through experience. Unlike systematic strategies that rely on fixed rules or algorithms, discretionary traders use their judgment to read the market in real time. It's a skill that can't be rushed, because it's built on screen time, pattern recognition, and the ability to stay calm under pressure.
There's no shortcut here. You need to see enough market conditions, wins, and losses to build that intuition—the kind that tells you when to pull the trigger or sit on your hands. Charts might look the same, but context changes everything, and that's something only experience can teach you.
At the end of the day, discretionary trading is an art, refined over time, sharpened through mistakes, and driven by instinct. It's not for everyone, but for those who've put in the work, it can be a powerful way to trade.

US DOLLAR Analysis: Bullish Momentum Building?TVC:DXY is finally showing signs of stabilization. The index has successfully rejected a key support level, an area where price has historically attracted strong buying interest. This level closely aligns with the psychological $100 mark, which has once again acted as a pivotal point for market participants, reinforcing its relevance as a key technical level.
The recent price action confirms bullish interest, as evidenced by a strong rejection pattern within the zone, with long lower wicks and bullish follow-through candles. The support zone held firm, and buyers have stepped in, initiating an upward move.
Now that price has bounced from this level, the probability of a continued rally increases. If the bullish momentum sustains, the price could move toward the 102.500 level, a logical near-term target based on previous structure and minor resistance.
However, a failure to maintain above the 100.00 handle or a sudden shift in sentiment could still pose downside risks. A confirmed breakdown below the green support zone would invalidate this bullish outlook and potentially open the door for further declines.
Remember, always confirm your setups and use proper risk management.

GBPUSD | 1H | BULLGood Morning Traders;
My target level for GBP/USD is 1.33966—just wait for this level and stay patient.
I put in a lot of effort to prepare these analyses for you, so don’t hold back on showing your support with a like! A huge thank you to everyone who supports me—every single like is a source of motivation for me to keep sharing my insights.

NAS100USD: Bearish Setup Builds as Price Retests Key Supply ZoneGreetings Traders,
In today’s analysis on NAS100USD, we continue to observe bearish institutional order flow, and as such, our objective is to align our trading opportunities with this directional bias.
Key Observations:
1. Bearish Break of Structure and Retracement:
Following a clear bearish break of structure, price has retraced into a mitigation block. This zone represents an area where institutional buying previously occurred. As price trades back into it, institutions often mitigate those earlier positions and reintroduce sell-side interest—offering us an opportunity to follow their lead.
2. Confluence at the Mitigation Block:
The mitigation block is further reinforced by the presence of a bearish order block, adding strength to the resistance zone. This alignment suggests the area may serve as a high-probability reversal point for bearish continuation.
Liquidity Sweep Scenario:
There remains a possibility that price may take out nearby buy-side liquidity (buy stops) before continuing downward. If this occurs, we will wait for confirmation before entering short positions, maintaining alignment with the overall bearish narrative.
Trading Plan:
Upon confirmation of rejection at the mitigation zone, we will seek to engage in short setups targeting liquidity pools in discount pricing zones.
Remain patient, disciplined, and ensure each trade aligns with your strategy.
Kind Regards,
The Architect

NZDCAD at Key Resistance Level: Will it Drop To 0.81608?OANDA:NZDCAD is approaching a key resistance level that has previously acted as a strong barrier, triggering bearish momentum in the past. This zone also aligns with prior supply areas where sellers have stepped in, making it a potential point of interest for those looking for short opportunities. Given its historical significance, how price reacts here could set the tone for the next move.
If bearish signals emerge, such as rejection wicks, bearish candlestick patterns, or signs of weakening bullish pressure, I anticipate a move toward the 0.81608 level. However, a clear breakout above this resistance could challenge the bearish outlook and open the door for further upside. It's a pivotal area where price action will likely provide clearer clues on the next direction.
Just my take on support and resistance zones, not financial advice. Always confirm your setups and trade with a proper risk management.
Best of luck!

XAUUSD/GOLD | 4H | SWING TRADEHey There,
Guys, I advise you to just wait for the breakout in gold. This is swing trading. I am just waiting for a breakout; if this breakout is to the downside, the target will be at least 3.215 level.
I hope this matches your desired tone.
Don't forget to click the like button at the bottom of this post to stay up to date with the latest changes!
Dear friends, your likes are always the biggest motivation for me to share my analysis. Therefore, I would like to ask each and every one of my followers; please keep your likes coming.
I sincerely thank everyone who supports me with their likes.

No Bottom Yet: Gold’s Technical Targets Point LowerSince Monday, I’ve been saying that Gold hasn’t finished correcting, and the price action is now confirming that view. The drop continued with breaks below two key levels: the 3300 figure and the 3270 support, which was the recent low.
After some sideways action (a bit of a limbo), we finally got the clean breakdown. At the time of writing, price sits at 3248, having just bounced slightly from the 3240 support, which aligns with mid-April’s ATH.
Now comes the big question: Is Gold done correcting?
In my opinion, not yet – and here’s why:
Technical reasons for further downside:
1. The break below 3270 is significant and opens the door to deeper correction.
2. We now have two measured targets:
📉 Measured range target: ~1000 pips → puts price below 3200.
📉 First leg down: ~2500 pips → could push price closer to the 3000 zone.
Trading Plan:
The strategy remains unchanged: sell the rallies. As long as price stays below 3270-3290 zone, downside continuation is the base case.
A move towards at least 3200 looks very probable – and deeper levels can't be ruled out.
Don’t rush to call a bottom – let the market show when the correction is really done. Until then, the bias stays bearish. 🚀
P.S: Expect great volatility to remain
Disclosure: I am part of Trade Nation's Influencer program and receive a monthly fee for using their TradingView charts in my analyses and educational articles.
