XAUUSD Breaking Records: Bull & Bear Setups for the New Month 🔥 Attention all traders!🔥
XAUUSD is on fire, breaking records with power! Here’s the latest update:
🔻 Bearish Outlook: Watch for a potential dip below the 3076-3078 range. If it falls, targets like 3050 and 3030 could be in play. Keep an eye on these support zones! 👀
🔺 Bullish Outlook: A breakout above this range could open up buying opportunities! Look for price action above 3084 with targets at 3097 and 3110. 🚀
New Month Open Candle: As we step into a new month, keep a close watch on the market open candle 📅. This could set the tone for the next move!
💡 Risk Management** is key! Always trade smart and protect your capital! 💰
Join the discussion and share your thoughts! Let's ride this golden wave together! 🌟
Supply_and_demand

NZDUSD Discretional Analysis: It’s Gonna Drop, BroNo deep analysis here, just think it’ll go lower. If I’m right, I make some, if not, I lose.
Just my opinion, not financial advice.

BTC USD Time Frame Daily March 30, 2025The price has been at the Support Line & DBR Zone (SnD Board) and will rise until it touches Supply at $ 85,500 then will fall again to look for the next Demand

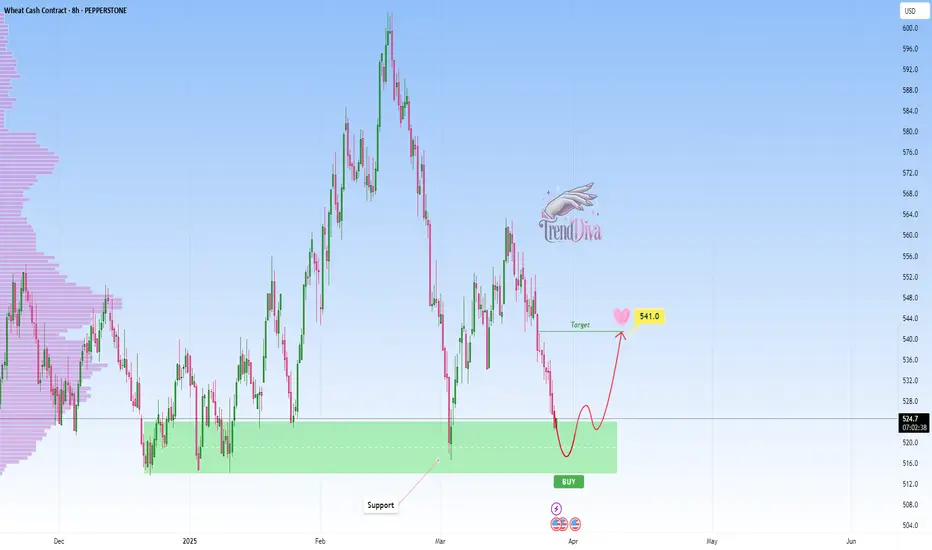
WHEAT at Key Support Level - Will Price Rebound to 541$?PEPPERSTONE:WHEAT has reached a major support level, an area where buyers have previously shown strong interest. This area has previously acted as a key demand zone, increasing the likelihood of a bounce if buyers step in.
A bullish confirmation, such as a strong rejection pattern, bullish engulfing candles, or long lower wicks, would strengthen the case for a move higher. If buyers step in, the price could rally toward the 541$ target. However, a decisive breakdown below this support would invalidate the bullish scenario and could lead to further downside.
This is not financial advice but rather how I approach support/resistance zones. Remember, always wait for confirmation, like a rejection candle or volume spike before jumping in.
Best of luck , TrendDiva
EurUsd- The "big" move is down, not upLast week, TRADENATION:EURUSD reached a high of around 1.09 and has been consolidating ever since, now for the fifth consecutive trading day. Despite some weak upward spikes, the pair remains in a range-bound phase.
From a technical perspective, multiple resistance levels lie ahead, with the psychological 1.10 mark acting as a key barrier. Given the current price action, I believe this consolidation is more likely to result in a downside breakout rather than a continuation of the uptrend.
There is a strong possibility that EUR/USD will correct the impressive rally that began in early March.
With this outlook in mind, I see more downside potential than upside and I am considering selling into rallies, targeting a move toward 1.07.
Disclosure: I am part of Trade Nation's Influencer program and receive a monthly fee for using their TradingView charts in my analyses and educational articles.

EURJPY Discretional Analysis: It's Gonna Go UpHonestly, I can’t fully explain it, but my intuition says it’s gonna go up. If I’m right, I’ll make a profit, and if not, I’ll take the loss and move on to the next trade.
Just my opinion, not financial advice.

CADCHF Discretionary Analysis: We're heading north!I don’t know how to explain it, but everything in me says, “this is going up!” 🚀 If I’m right—sweet profits! 💰 If not, I’ll take the loss like a champ and move on.
Just my opinion, not financial advice.

JPY/USD - Will we make a strong bounce?The JPY/USD is in a downward channel. Will it find support around 0.006 and rebound, or will it break below this key level?
The pair has nearly reached a major support zone—an area where buyers have previously shown strong interest. This level has historically acted as both strong resistance and support, increasing the likelihood of a bounce if buyers step in.
What do we want to see?
For a continuation to the upside, we need this level to hold as support. A bullish engulfing candle could signal a potential reversal.
If JPY/USD is to move lower, we need a clear break below support with high volume to confirm the breakout. In that case, lower prices could follow.
Thanks for your support.
- Make sure to follow me so you don't miss out on the next analysis!
- Drop a like and leave a comment!

SPY Technical Outlook - Will Buyers Step In?AMEX:SPY is experiencing a corrective move after rejecting the upper boundary of the ascending channel. This rejection led to increased selling pressure, bringing price back to the lower boundary of the channel, where buyers may step in to defend the trendline support.
If the price holds at this dynamic support level, a bullish reaction could send AMEX:SPY toward the midline of the channel, with the next target around 607.00. Holding above this level would reinforce the bullish trend structure and increase the probability of continuation toward the upper boundary of the channel.
However, a breakdown below the trendline support would weaken the bullish outlook and open the door for further downside. Monitoring price action, volume, and confirmation signals will be crucial in determining the next move.

META at Trendline Support - Will Buyers Push Toward $696?NASDAQ:META is currently undergoing a corrective phase following a sharp rejection at the upper boundary of its ascending channel. The recent pullback has driven the price back toward the lower boundary of the channel, where buyers are now looking to step in.
If buyers manage to defend this support level, we could see a move toward the midline of the channel, with the next key target at $696. A break above this midline would confirm the continuation of the bullish trend, potentially bringing the price back toward the upper boundary.
However, a failure to hold trendline support could weaken the bullish outlook, leading to a potential breakdown and further downside pressure. Price action near this critical zone will be key in determining the next directional move.
Traders should monitor candlestick formations and volume for confirmation. As always, managing risk effectively is essential when trading this setup.
If you have any thoughts on this setup or additional insights, drop them in the comments!

Dow Jones at trendline support: Will it bounce to 44,812$?CAPITALCOM:US30 is undergoing a corrective pullback after forming a double top near the upper boundary of the ascending channel. The rejection from this resistance zone triggered increased selling pressure, driving the price back toward the lower boundary of the channel, where buyers are now looking to step in.
If buyers step in and defend this support, we could see a move toward the midline of the channel, with the next key target at 44,812. Holding above this level would reinforce the bullish trend structure and increase the probability of continuation toward the upper boundary of the channel.
However, a failure to hold trendline support could weaken the bullish outlook, leading to a potential breakdown and further downside pressure. Price action near this critical zone will be key in determining the next directional move.
Traders should monitor candlestick formations and volume for confirmation. As always, managing risk effectively is essential when trading this setup.
If you have any thoughts on this setup or additional insights, drop them in the comments!

AUDCAD Approaching Key Support - Rebound Towards 0.90150?OANDA:AUDCAD is approaching a significant support zone, highlighted by previous price reactions and strong buying interest. This area has previously acted as a key demand zone, increasing the likelihood of a bounce if buyers step in.
The current market structure suggests that if the price confirms support within this zone, we could see a bullish reversal. A successful rebound could push the pair toward the 0.90150 level, a logical target based on previous price behavior and current market structure.
However, if the price fails to hold this support and breaks below the zone with momentum, the bullish outlook may be invalidated, potentially opening the door for further downside continuation. Monitoring price action and volume in this area will be crucial to confirm a valid setup.
Just my take on support and resistance zones—not financial advice. Always confirm your setups and trade with solid risk management.
Best of luck!

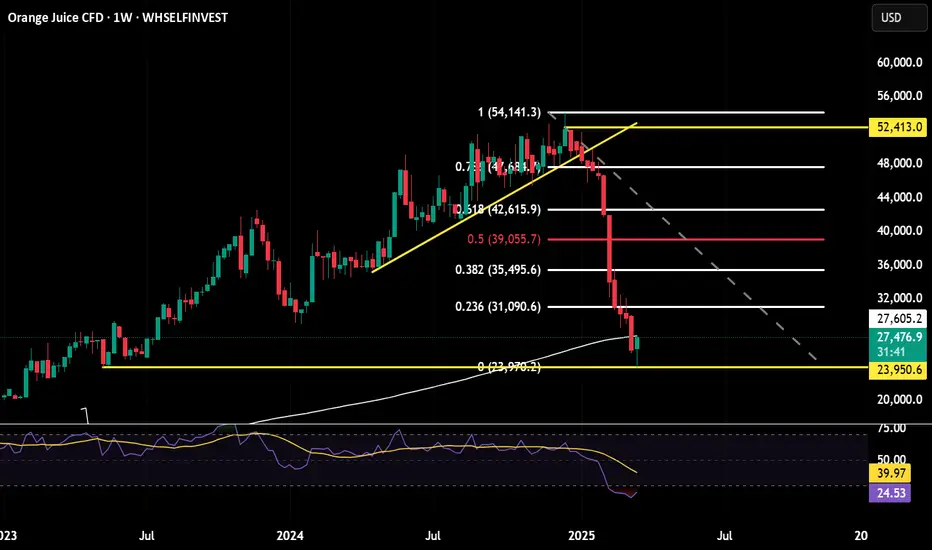
A good bounce inbound after this monster sell off on OrangeJuiceAfter this monster sell off I have been looking for a good entry on the smaller time frame for a bounce back up to the large consolidation area around the .618 retracement of the move down shown here on the weekly.
I think I have got that on Wednesday with an open lower followed by a nice impulsive move up. The positioning is set for a reversal, with speculators massively still short, on the technical side we have the RSI turning up on the weekly and already crossed over on the daily.
I am in from the Wednesday close and will be looking to add on the move up with good pull backs followed by rejections on the STF.
Invalid if Wednesdays low is taken.
AVAX / AVAXUSDT | 1H | Avax will be the rocketHey there;
I have prepared avax analysis for you. All I ask from you is to support this analysis with your likes.
My Avax target level is 22.62 and my stop level is 17.37.
This analysis has a win rate of 2.00
Guys I will update this analysis under this post
Now let's just follow this analysis and see if my analysis is correct or not.
Thank you very much to everyone who has been kind and supported me with their likes.
Thanks to your support, I am constantly preparing special analyzes for you.
I love all my followers very much.

The Dow Jones Industrial Average (US30) 23 MARCH 2025The Dow Jones Industrial Average (US30) is currently trading within a well-defined ascending channel, maintaining its long-term bullish structure. Price recently tested the lower boundary of the channel, aligning with a strong demand zone around 40,892 - 40,053, and is now showing signs of a potential reversal. The smart money concept (SMC) perspective suggests that institutions may have accumulated positions at this level, preparing for a bullish move toward the 44,500 - 44,800 supply zone. If price sustains above 42,000, buyers could take control, targeting liquidity above previous highs.
From a supply and demand standpoint, the 40,892 - 40,053 level acted as a key demand zone, where buyers aggressively stepped in to defend the trend. The next area of interest is the 44,502 - 44,809 supply zone, which aligns with historical resistance. If price reaches this level, we may see profit-taking or a potential rejection. However, a break above 44,809 would indicate bullish continuation toward new all-time highs.
On the fundamental side, several factors support a potential bullish move. Federal Reserve policy remains a key driver; if the Fed signals rate cuts later in 2025 due to slowing inflation, equities could rally further, benefiting the Dow. Additionally, US economic resilience, strong labor markets, and robust earnings from industrial and financial sectors could provide further upside momentum. On the downside, risks remain from geopolitical tensions, trade wars, and inflation concerns, which could create volatility and potential corrections.
Given these factors, a long trade setup appears favorable. The ideal entry point would be near 42,000, aligning with trendline support and demand. A stop-loss below 40,800 would protect against an unexpected bearish break. Take-profit targets include 44,500 (supply zone) and 44,800 (liquidity sweep level), where price may face resistance. However, if price fails to hold 42,000, a deeper retracement toward 38,473 could be possible before the next bullish impulse.
Would you like me to refine this setup further with risk management and position sizing details? 🚀

EURUSD Maintains Bearish Momentum - Is 1.07500 the Next Target?OANDA:EURUSD is trading within a well-defined descending channel, with price action consistently respecting both the upper and lower boundaries. Recently, the price rejected a key resistance zone, reinforcing bearish momentum and signaling a potential continuation toward lower levels.
The current price action suggests that if price continues to respect this resistance, we could see further downside toward 1.07500, aligning with the lower boundary of the channel. However, if price breaks above the channel and sustains above it, the bearish outlook may be invalidated, potentially signaling a shift in momentum. Monitoring price action and volume at this level will be essential for confirmation.
Just my take on support and resistance zones—not financial advice. Always confirm your setups and trade with solid risk management.
Best of luck!

EURUSD | 4H | WAIT BREAKOUTHey there, Traders,
I’ve put together an analysis for EUR/USD. Right now, I’m watching it like a hunter, waiting for a breakout. As soon as it happens, I’ll drop updates right here under this analysis.
Big thanks to everyone who supports me with likes—you guys are awesome!
God bless you all

For those of you who bought XRP...I've known about COINBASE:XRPUSD for over a decade now. Time has brought tons of rumors, tons of hype, and tons of mistakes still being made by those new and experienced alike. For those of you holding strong pre $1.00, I commend you. For those of you who are bought high and are now riding the emotional roller coaster, consider these 3 things before you make a decision.
1. We are DIRECTLY in the middle of the range
Over 3 months of consolidation has taken place. With a high of 3.40 and a low of 1.70, this is a range for advanced traders. If you bought around 2.00 or under, Congrats! even though you didn't get in pre $1.00, there are alot of Big buyers that have been scooping up XRP at the 2.00 level.
For those of you that Bought 2.50 and above.
Ask yourself why you purchased XRP?
I ask you; Did you buy XRP to trade? or to invest? No they are not the same thing. Investing is long term, 3-5 years+. Trading is dealing with much shorter time windows, even if you are swing trading, Trading is Trading, and this takes a different skill set and mindset. so if you are investing, be happy that XRP is lower in price. if big money is Buying at 2.00, there is nothing stopping you from doing the same. If you are a beginner trader, consider our last point.
Buy with Buyers, Sell with Sellers
Sounds simple right? Here is something you may not know. Liquidity is what moves markets. If you have 100million that you have to invest for your clients in XRP, do you slap the market button? Absolutely not, in fact, you want to make yourself as small looking as possible. Why? YOU NEED PEOPLE TO SELL INTO YOU. Big firms (unless through dark pools) have algorithms make themselves look as small as possible, whilst accumulating and distributing shares efficiently. At the end of the day, These are the big players that move the markets big.
Do you need to know this? Not necessarily for the technical side, but for your emotions, your psychology? Yes this is important.
Find the buyers and sellers (I have them marked in my chart), and learn to play alongside them. You will get better pricing, feel great about your positions, and know if it goes against you, you can cut the trade off early and reposition.
Hope you enjoyed, and happy Trading!

EURJPY: Potential downward move towards 161.00?OANDA:EURJPY is currently approaching a significant resistance zone, an area that has been a key point of interest where sellers have regained control, leading to notable reversals in the past. Given this, there is potential for a bearish reaction if price action confirms rejection, such as a bearish engulfing candle, long upper wicks or increased selling volume.
If the resistance level holds, I anticipate a downward move toward 161.00, a target that seems at least achievable. This would more likely be a call on a bearish outlook, as sellers may step in to push the price lower from this key level. However, if the price breaks this zone and sustains the up move, the bearish outlook may be invalidated, and we could potentially see a larger upside move.
Given the potential volatility around this zone, it’s crucial to monitor candlestick patterns and volume closely to identify strong selling opportunities. Proper risk management is essential to handle any potential volatility and protect your capital if the price breaks out.

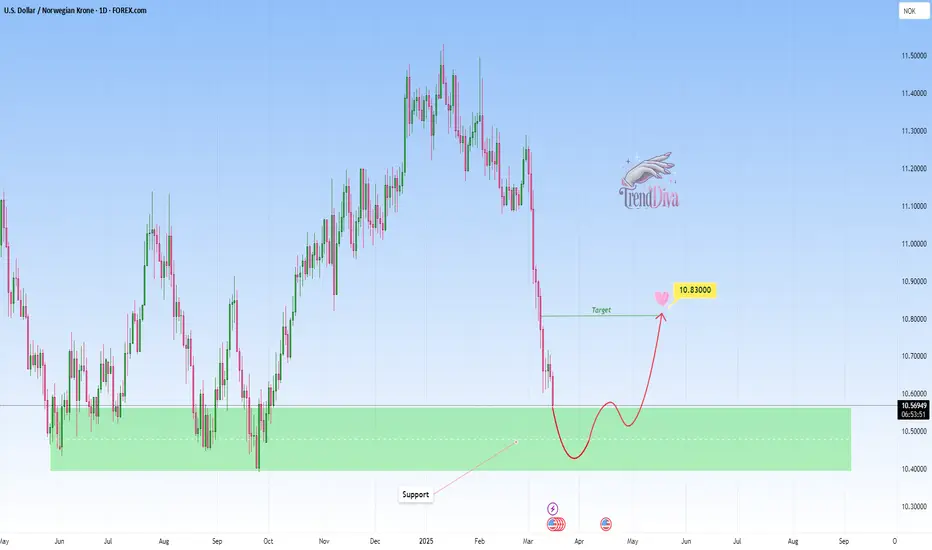
USDNOK - Buy opportunity towards 10,8300?OANDA:USDNOK is testing a clear support area, marked by previous bullish reversals and strong buyer interest. The recent bearish move into this zone suggests a potential buying opportunity if buyers confirm control.
If bullish signals, such as strong rejection wicks or bullish candlestick patterns, emerge, I anticipate an upward move toward 10,8300. If the support fails to hold however, further downside could be expected.
Remember, always confirm your setups and trade with solid risk management.
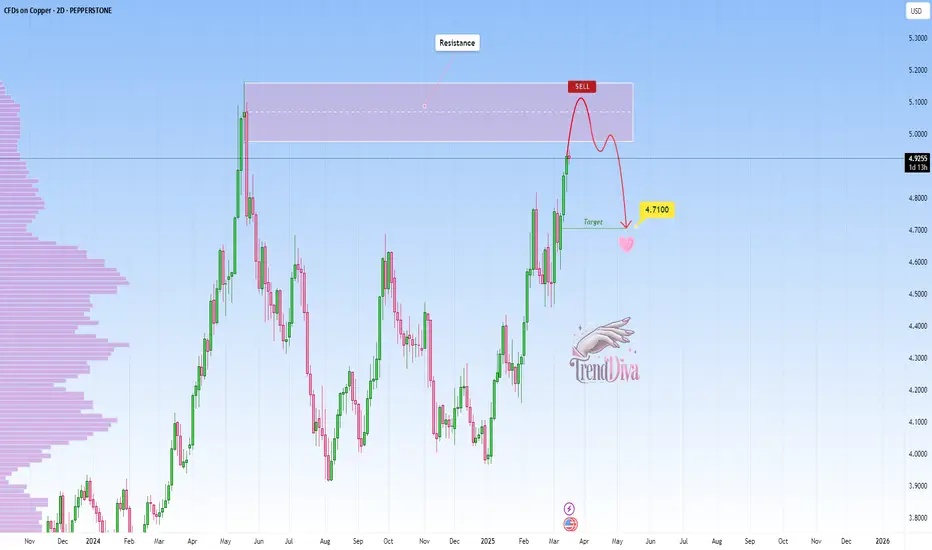
COPPER Approaching Key Resistance — Potential Sell SetupPEPPERSTONE:COPPER is approaching a significant resistance zone, highlighted by previous price reactions and strong selling interest. This area has previously acted as a key supply zone, increasing the likelihood of a bearish reversal if sellers step in.
The current market structure suggests that if the price confirms resistance within this zone, we could see a pullback toward the 4.7100 level, a logical target based on previous price behavior and current market structure. However, a clear breakout above this resistance could challenge the bearish outlook and open the door for further upside. It's a pivotal area where price action will likely provide clearer clues on the next direction.
Just my take on support and resistance zones—not financial advice. Always confirm your setups and trade with solid risk management.
Best of luck!
AUDCAD Approaching Key Resistance — Potential Sell SetupOANDA:AUDCAD is approaching a key resistance zone, highlighted by strong selling interest. This area has historically acted as a supply zone, increasing the likelihood of a bearish reversal if sellers step in.
The current market structure suggests that if the price confirms resistance within this zone, we could see further downside movement. A successful rejection could push the pair toward 0.90700, a logical target based on prior price behavior and the current structure.
However, if the price breaks and holds above this resistance, the bearish outlook may be invalidated, potentially leading to further upside.
Just my take on support and resistance zones—not financial advice. Always confirm your setups and trade with solid risk management.
Best of luck!

NZDJPY at Key Support Level - Rebound Towards 87.300?OANDA:NZDJPY has reached a significant support zone, highlighted by previous price reactions and strong buying interest. This area has previously acted as a key demand zone, increasing the likelihood of a bounce if buyers step in.
The current market structure suggests that if the price confirms support within this zone, we could see a bullish reversal. A successful rebound could push the pair toward the 87.300 level, a logical target based on previous price behavior and current market dynamics. Monitoring candlestick patterns and volume at this critical zone is essential for identifying buying opportunities.
Just my take on support and resistance zones—not financial advice. Always confirm your setups and trade with solid risk management.
Best of luck!
