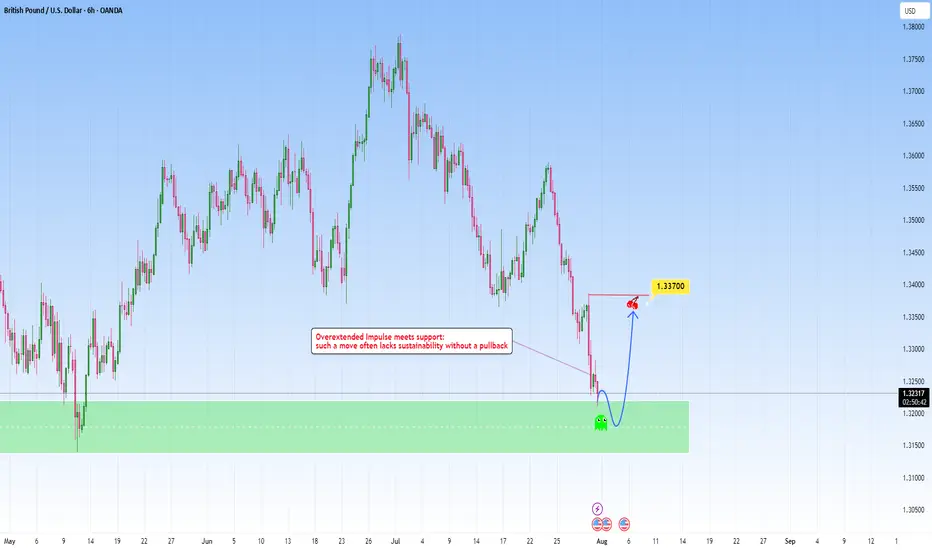
GBPUSD: Overextended move meets with supportAfter a steep and aggressive sell-off, price has tapped into a clear zone. This recent move wasn't gradual: it was impulsive and sharp, which tells us one key thing: exhaustion is likely.
The overextension into it without any meaningful pullback typically highlights imbalance, where price moves ahead of structure and becomes vulnerable to correction. But price doesn’t move in straight lines forever. Markets that fall too quickly tend to burn out just as fast. When such aggressive pushes meet with a clean, resistance like this one, they often trigger the exact opposite, a snapback correction.
I am now watching for signs of absorption and accumulation. This could play out in the form of sideways candles, wick rejections, or a sudden reversal spike. These are early signs that smart money might be stepping in.
My projected target would be toward the 1.33700 area, from the last impulsive drop. It’s a classic mean reversion setup, not just technical but psychological. Traders who chased the move late may find themselves trapped, fueling the correction as they’re forced to exit.
Supply and Demand
Gold Rejected at 3315 – But Bulls Might Not Be Done Yet📌 What happened yesterday?
During the Asian session, Gold printed a fresh local low at 3268, continuing the downtrend that already dropped over 1700 pips in just one week. However, that move quickly reversed, and we saw a natural corrective bounce.
📈 Resistance holds firm
The correction took price back up into the 3310 zone, which acted as confluence resistance. After two taps into that area, price failed to sustain above 3300, indicating sellers are still active there.
❓ Is the upside correction over?
I don't think so. The recent drop has been choppy, lacking the strong momentum of previous legs. This type of price action often signals that we are still within a correction, not in a clean continuation.
📊 What am I watching?
I’m actively monitoring for:
• Exhaustion signs on the downside
• Upside reversal signals
My plan is to open long trades only when I see confirmation, aiming for a move back toward the 3330 zone, which could act as resistance.
Disclosure: I am part of TradeNation's Influencer program and receive a monthly fee for using their TradingView charts in my analyses and educational articles.

Bullish Channel Intact: BTC Poised for Next Leg Toward 152KBitcoin continues to coil within a bullish consolidation zone above the critical $114.5k–$117.5k Immediate Demand Zone, firmly riding the ascending channel structure that has guided price since the March swing low. The prior wave structure confirms a clean ABC correction, followed by a powerful breakout and a structured range indicative of accumulation, not exhaustion.
The RSI shows persistent bullish divergence, confirming hidden strength, with multiple support bounces confirming demand. The current tight consolidation above former resistance now flipped demand presents a launchpad scenario for a breakout towards major projected upside targets.
Targets to Watch:
🟢 $123,053 – Range breakout threshold, aligns with channel midline and prior local high.
🟢 $134,428 – Measured move from current range and top channel boundary intersection.
🟢 $152,174 – Final leg projection based on macro channel trajectory and bullish wave extension potential.
On the downside, failure to hold $114.5k opens the door to a test of the $105k Strong Support Zone, which aligns with prior structural demand and broader trendline confluence.
💬 Drop your favorite altcoins in the comments for quick analysis , let's catch the next movers before they fly!

BTCUSD PRICE MIGHT FALL!Price has a high tendency to drop from the current price of 113k as trend breaks. I anticipate a sell opportunity from this market. My target profit level is 107k

Solana coin Long setupIn this video I go through the current price action and talk about how the 126$ target level was recently reached for a clean long entry and on the daily timeframe we printed a higher low .
I expand on my thoughts for a continuation to the upside and to retest some higher levels of resistance 180$s and time will tell if we print a higher high at the 180$s before retesting the $200 zone .

XRP Critical Levels to Play This MonthHello I am the Cafe Trader.
This weekend we are shifting focus into the crypto market for a quick overview. If you read my last XRP article, we nailed the bottom for longs, and the sellers for a great positional play. This time we are going to analyze the current failed breakout.
Are Bulls Trapped? Does this still have room to leg up?
Point 1
We can start with the trend break. Massive buyers pushed this move higher, giving XRP a relatively quick All time high, But July 23rd shorts were able to shove this back inside of the previous high.
This signifies that there are bulls trapped, but the interesting thing to note is that the volume has reduced significantly since the last two ATH's. So this also would indicate a lack of buying interest at the highs.
Buyers are just not willing to to get involved with the same conviction as before (yet). No buyers, no continuation (even if there is not many sellers/profit takers).
Point 2
Strong buyers proved their interest with a "hot" reaction at $2.95.
With no "real" seller coming into this market yet, there is nothing stopping this continuation from legging up (so far).
Therefore I stand bullish, and am looking for a move up to $4.64 as a Target.
Point 3
Buying into this can feel tricky, your first entry for a classic two bar trend break would've been at the top of demand. I do think we will get another opportunity here, I definitely would not chase this, because it could play this range for a while before another leg up.
Setup
Trend break continuation.
Entry 3.13
Stop 2.65
Exit TP 4.64
Risk to Reward 3.1
If there is a close below these strong buyers, this could com all the way back down to 2.15-2.3 at least.
The reason for the wider stop here is because we don't want to get swept and then ran. A more conservative stop could be $2.85 which would be a 6R trade. Take your pick
Long Term
If you are late to the party on XRP (I know many are) here are some entries according to your sentiment:
Almost FOMO = 3.13
Aggressive = 2.95
Good price = 2.15-2.3
Steal = 1.60 - 1.93
That's all for XRP. We are going to be looking at Ethereum ETH Next.
Thanks for reading and happy trading!
@thecafetrader

EURCAD SELL SETUPWe should see continuations on this EURCAD to the down side from this breaker blck by next week
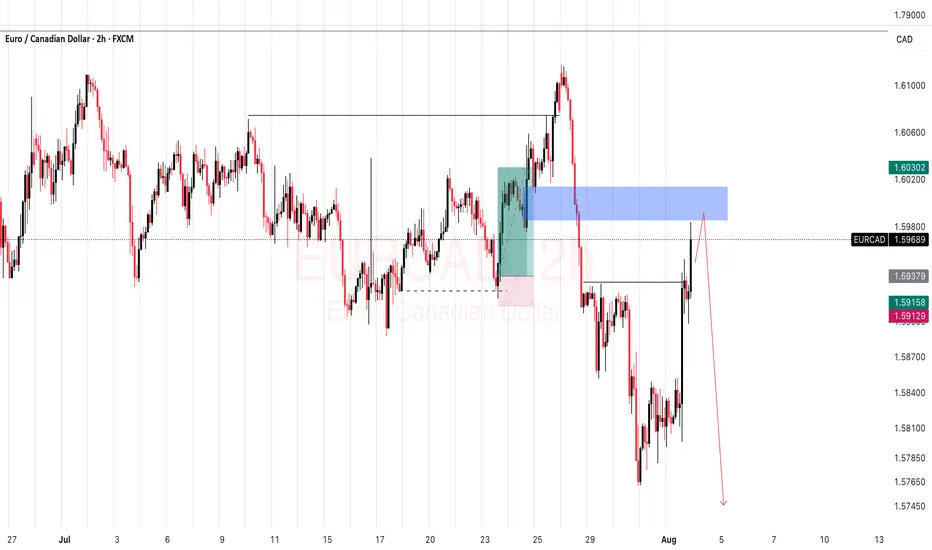
EURCAD ShortConfluence
1. Break and retest of the trendline
2. Order block in 1H
3. 61.8% Fib zone
It's a good spot to catch a clean 1:2. Wait for confirmation on either 1H or 2H timeframe to enter.
Good luck...

GOLD (XAUUSD): Bearish Continuation Ahead?!
Gold retested a recently broken significant liquidity cluster.
I see a clear sign of strength of the sellers after its test
with multiple intraday confirmation.
I think that the price will retrace to day to 3276 level.
❤️Please, support my work with like, thank you!❤️
I am part of Trade Nation's Influencer program and receive a monthly fee for using their TradingView charts in my analysis.

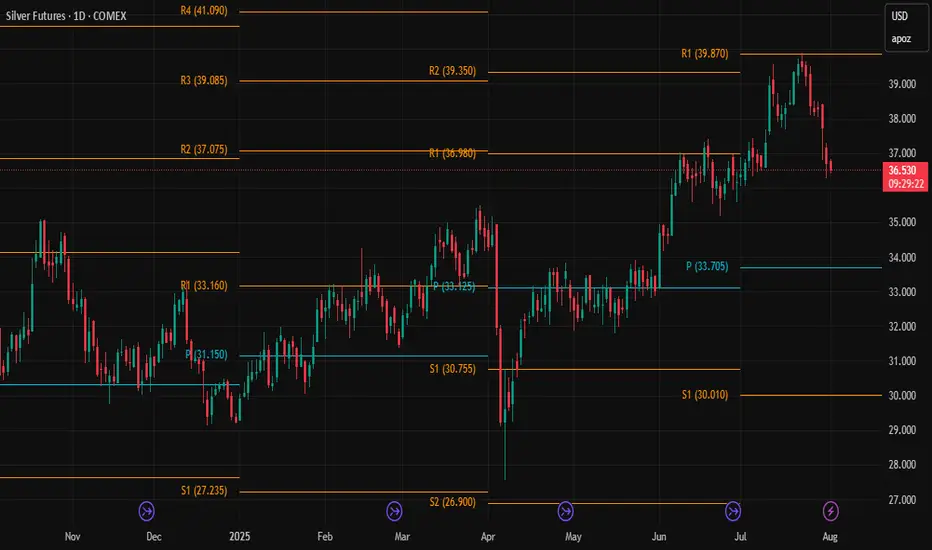
It would be nice to see Silver drop towards the Pivot for a buy.There is no prediction, just looking at the pivots. It would be nice to see silver drop down under 35.00 into the quarterly pivot point to add to positions.
EURUSD NOWWe've got EURUSD now waiting for a mitigation of the OB to take 15m high or maybe shorting until 1D low. but most probably we take long because of a weak body close that signals a weak power of sellers.

THE KOG REPORT - NFPTHE KOG REPORT – NFP
This is our view for NFP, please do your own research and analysis to make an informed decision on the markets. It is not recommended you try to trade the event if you have less than 6 months trading experience and have a trusted risk strategy in place. The markets are extremely volatile, and these events can cause aggressive swings in price.
Following on from the FOMC KOG Report which worked quite well, we’ll stick with the same chart and for today suggest caution. It’s the first day of the month and the last day of the weekly candle. The close here for gold is important and will give us further clues to the next few months.
We’ve shared the red boxes and the red box targets are below. There is a key level above 3306-10 which will need to be breached to correct the move back up to the 3330-34 region for the weekly close. However, we now have an undercut low which is potential if there is more aggressive downside to come and that level is sitting around the 3240-50 region which for us may represent an opportunity for a swing low. We’re a bit low and stretched here to short and as we’ve already hit our target for the day so we’ll wait for the extreme levels and if hit and our indicators line up, we may take some scalps. Otherwise, as usual on these events, the ideal trade will come next week.
RED BOXES:
Break above 3290 for 3295, 3306, 3310 and 3320 in extension of the move
Break below 3275 for 3267, 3260, 3255 and 3250 in extension of the move
Please do support us by hitting the like button, leaving a comment, and giving us a follow. We’ve been doing this for a long time now providing traders with in-depth free analysis on Gold, so your likes and comments are very much appreciated.
As always, trade safe.
KOG

EUR_USD POTENTIAL SHORT|
✅EUR_USD has been growing recently
And the pair seems locally overbought
So as the pair is approaching
A horizontal resistance of 1.1632
Price decline is to be expected
SHORT🔥
✅Like and subscribe to never miss a new idea!✅
Disclosure: I am part of Trade Nation's Influencer program and receive a monthly fee for using their TradingView charts in my analysis.

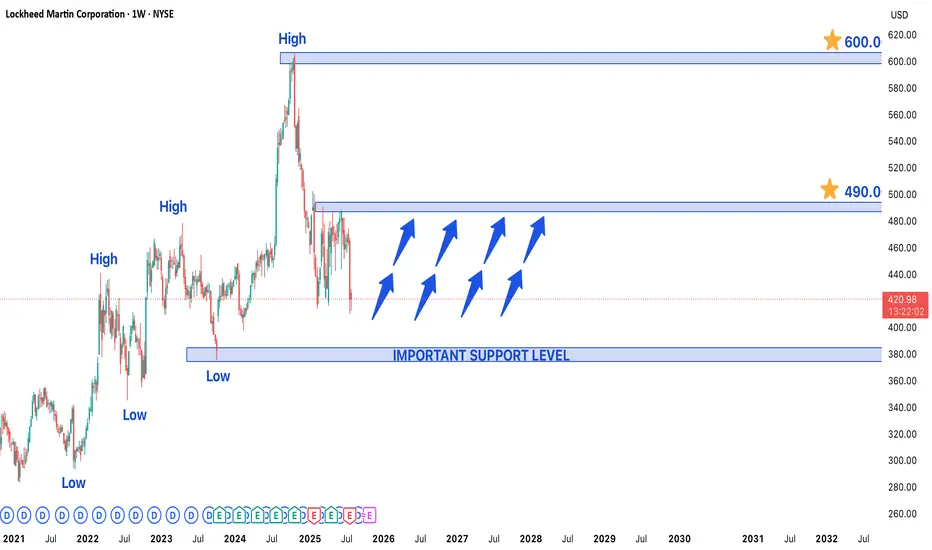
Lockheed Martin Stock in Bullish Trend - Key Levels to watchLockheed Martin (LMT) Stock in Strong Bullish Trend - Key Levels to Watch
Lockheed Martin's (LMT) stock is currently exhibiting a well-defined bullish trend, trading near a recent higher low that may serve as a crucial support level for the next upward move. The defense giant continues to benefit from robust global military spending and a strong contract pipeline, positioning the stock for potential further gains.
Technical Structure & Key Levels
- Higher Low Support: The current price zone represents a critical support area where buyers have previously stepped in, maintaining the upward trajectory
- Upside Targets:
- Near-term: $490 (previous resistance zone)
- Long-term: $600 (potential breakout extension)
- Major Support: $375 would act as strong demand zone if any deeper pullback occurs
Bullish Catalysts Supporting the Trend
1. Defense Sector Strength:
- Record US defense budget allocations for 2024-2025
- Increased NATO military spending amid global tensions
2. Contract Backlog:
- F-35 program continues to drive revenue
- Hypersonic weapons and space systems development
3. Technical Momentum:
- Price trading above key moving averages (50/200 DMA)
- Higher highs and higher lows confirm uptrend structure
Trading Strategy Considerations
- Optimal Entry:
- On bounces from current support level
- On breakout above $460 confirmation
- Risk Management:
- Stop-loss below $375 for longer-term positions
- Partial profit-taking near $490 resistance
- Confirmation Signals:
- Volume increase on upside moves
- Sustained closes above $460
Potential Risks to Monitor
- Geopolitical shifts affecting defense budgets
- Program delays (particularly in F-35 production)
- Broader market corrections impacting defense sector
Long-Term Outlook:
The combination of fundamental strength and technical positioning suggests LMT could progress toward $490 near-term, with $600 as a viable long-term target if the bullish structure holds. Traders should watch price action around current levels for continuation signals while remaining mindful of the $375 support as a critical level for the bullish thesis.
CHF_JPY RISKY LONG|
✅CHF_JPY has retested a key support level of 182.800
And as the pair is already making a bullish rebound
A move up to retest the supply level above at 183.700 is likely
LONG🚀
✅Like and subscribe to never miss a new idea!✅
Disclosure: I am part of Trade Nation's Influencer program and receive a monthly fee for using their TradingView charts in my analysis.

DXY LONGi am looking to go long on DXY from this level of breaker block.. a possible pullback to this level we will engage on the buy and use itr as cross reference for our dollar pairs ..

S&P 500 Bullish Rounding Bottom in PlayS&P 500 continues its upward trajectory, supported by a clearly defined rounding bottom formation. Price has successfully broken above the neckline resistance, followed by a technical pullback which was met with a strong buy reaction, validating this zone as a key demand area.
This pullback area now acts as a critical structural base and the current bounce reinforces bullish continuation bias. The active plan is to accumulate within the buy-back zone and follow the path laid out in the chart towards the projected upside targets.
Drop your stock requests in the comments for a quick analysis, only US-listed stocks will be reviewed under this post.

127-128k incoming ( altcoins round ? )Hi, Bitcoin seems to have completed its short term Elliott wave 4 correction and the price action analysis also confirms that this time Bitcoin will be able to break the 120-119 resistance, I predict Bitcoin to make a new high around 127-128. Altcoins have not grown that much yet and if the price can make a reliable consolidation above 120k, altcoins will start to rise.

ERA : Risky but profitableHello friends🙌
Given the high that has been made and the price has returned, there is a possibility that the price will correct to the middle of the move, which is why we have provided two buying levels for you, which you can buy with risk and capital management and move towards the specified goals.
🔥Follow us for more signals🔥
*Trade safely with us*

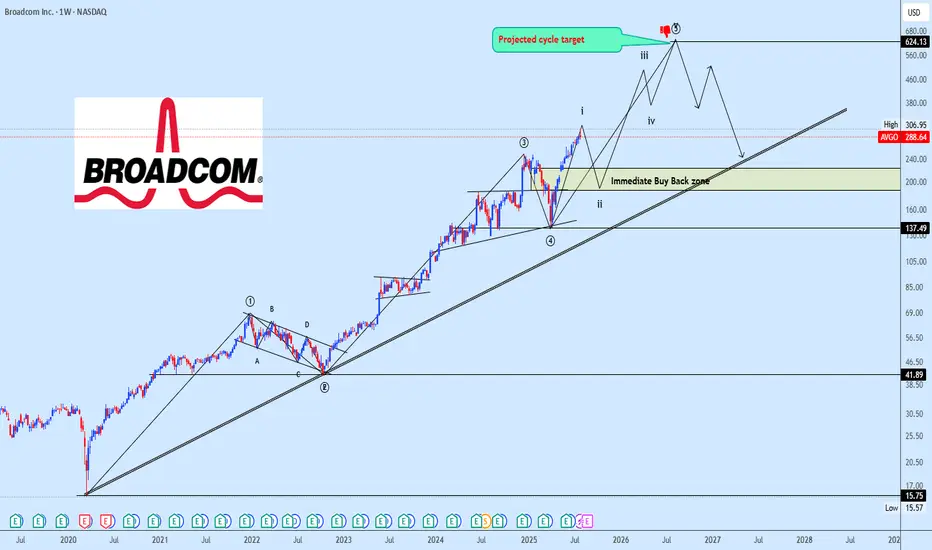
AVGO Bullish Impulse Wave Structure in ProgressAVGO continues its macro advance with a clear 5-wave impulse structure unfolding. The current price action marks the completion of subwave (i) of wave ⑤, setting the stage for a corrective pullback into subwave (ii).
We expect this corrective leg to reach into the 38.2%–50% Fibonacci retracement zone of subwave (i), which will serve as a potential re-accumulation area before the next bullish expansion.
The strategy remains to monitor the development of wave (ii) closely, waiting for key price reaction around the identified retracement zone to build positions in anticipation of subwave (iii) of ⑤ typically the strongest and most impulsive move in Elliott Wave structure.
Targets are shared on the chart for clarity. Patience here is key as we await the right entry zone aligned with technical confluence.
📌 Drop your stock requests in the comment section for quick chart updates — only equity-based assets will be accepted under this post.
OMNI : Will it happen again?Hello friends🙌
✅As you can see, everything is clearly and explicitly drawn for you.
✅Just pay attention to risk and capital management for trading and if you like, support us.
🔥Follow us for more signals🔥
*Trade safely with us*

EPIC : Risky signal...Hello friends🙌
🔊Due to the good price growth, we have found important support points for you.
Now, due to the price correction, we have found buy points for you and you can buy with risk and capital management and move with it until the goals we have set for you.
🔥Follow us for more signals🔥
*Trade safely with us*

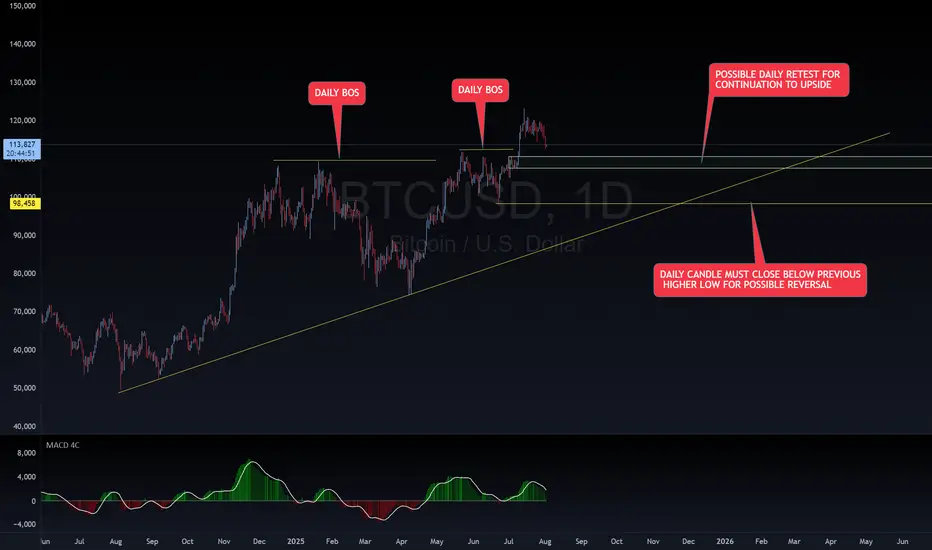
BTC BUY SET UPBTC is on an overall DAILY uptrend with a DAILY BOS. Waiting on a DAILY retest for continuation upward. If DAILY candle breaks and closes below last DAILY HL, it could potentially cause a reversal to downside. Happy trading!
~~~~I want everyone to succeed!