heavy buyers buy sold offlooking for buying support at $1.5 or higher and continuation through sellers at 1.75
Supply and Demand

WTI Oil – From Conflict to StrategyBack on April 24, I marked a short zone. On June 11, price broke above that level, giving a long opportunity — which I took.
Unfortunately, it coincided with the tragic military strike by Israel on Iran, pushing oil sharply higher. I’ve pinned that analysis.
Following the ceasefire, price dropped again — just a reminder that geopolitics can shake the charts.
As traders, we stay prepared to act, even while acknowledging the deep sadness of lives lost.
Now I wait for price to reach my marked level again. If I get a valid signal, I’ll short.
But if price breaks and holds above, I’ll buy the pullback — with no bias, just pure execution.
Risk-managed. Emotion-neutral. Opportunity-focused.

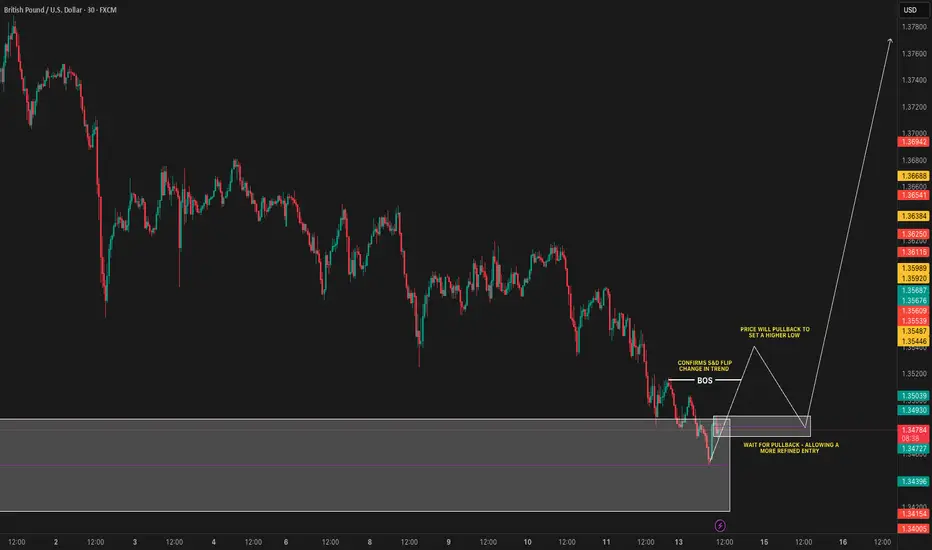
THOUGHTS ON GBP/USD GBP/USD 30M - As you can see above price has traded us down and into an area of interest we have marked out from this weeks Sunday Sessions video.
Now price has traded us down and into this zone we are expecting enough Demand to be introduced to encourage price to flip balances and instigate the new higher timeframe Impulse.
As you are all aware this market is predominantly bullish and up to now has been putting in a bearish corrective wave, this could be the point of reversal and somewhere I feel we could go long from.
Its a case of waiting for a break in structure to confirm this reversal, once we have this break, price tells us that now Demand is in power and we can expect longer term bullishness, giving us the opportunity to buy in.
NAS100 - Stock market awaits inflation!The index is located between EMA200 and EMA50 on the one-hour timeframe and is trading in its ascending channel. Maintaining the ascending channel and confirming it after breaking the downtrend line will lead to the continuation of the Nasdaq's upward path to higher targets (23000), but in case of no increase and channel failure, one can look for selling positions up to the target of 22500.
Last week, the U.S.dollar demonstrated strong performance against major global currencies, despite having experienced some weakness since April 2, when President Donald Trump announced retaliatory tariffs against key U.S. trading partners. However, these tariffs were ultimately postponed, and only a baseline 10% tariff was maintained.
The 90-day deadline for implementing these tariffs, originally set to expire on Wednesday, has now been extended to August 1. Nevertheless, Trump surprised the markets this week by announcing a 25% tariff on imports from Japan and South Korea, threatening a 50% tariff on Brazilian goods, and implementing lower tariffs for other partners. These developments triggered a shift of capital toward the U.S. dollar as a safe-haven asset, boosting its strength.
This marks a notable shift in how the dollar is reacting to tariff tensions. In April, fears of an economic slowdown weighed on the greenback, but now it is gaining traction as a refuge in times of uncertainty, particularly as inflation risks mount—contributing to choppy moves in U.S. equity markets.
As is customary, the earnings season will kick off with reports from major banks and financial institutions. On Tuesday, JPMorgan is set to release its financial results, opening the floodgates for a wave of earnings reports. The image referenced lists several other companies, many of which are market heavyweights.
Following a relatively quiet week due to Independence Day holidays and a lack of major economic data, markets are now gearing up for a steady stream of reports in the coming days. Tuesday will bring the Consumer Price Index (CPI) for June along with the Empire State manufacturing survey. On Wednesday, the spotlight will shift to the Producer Price Index (PPI) for the same month. Then, on Thursday, traders will focus on June’s retail sales report, the Philadelphia Fed’s manufacturing survey, and the weekly jobless claims figures.
The week will conclude with two additional reports on Friday: the June housing starts data and the preliminary reading of the University of Michigan’s Consumer Sentiment Index.
June’s CPI report is expected to reflect an uptick in inflation, potentially driven by Trump’s tariff policies. Some analysts believe the tariffs will have an “undeniable” impact on prices, though others remain uncertain.
Despite concerns from both experts and consumers that businesses might pass tariff costs on to buyers, inflation has so far remained relatively moderate this year. The effects of Trump’s aggressive tariff campaign on hard economic data have not yet been clearly reflected—but that may be about to change.
According to Bloomberg’s consensus forecasts, as cited by Wells Fargo Securities, the CPI is expected to show a 2.7% year-over-year increase in June—up from 2.4% the previous month. Meanwhile, core CPI, which excludes volatile food and energy prices, is projected to have risen 3% over the same period, compared to a prior gain of 2.8%.
If these numbers come in as expected, it could support the forecasts of analysts who have warned that the costs of Trump’s heavy import tariffs would eventually show up on price tags, as manufacturers, importers, and retailers pass along the burden through the supply chain. Since taking office, Trump has imposed a wide array of tariffs, including a 10% levy on most imports, a 25% duty on foreign automobiles, and tariffs exceeding 50% on Chinese products.

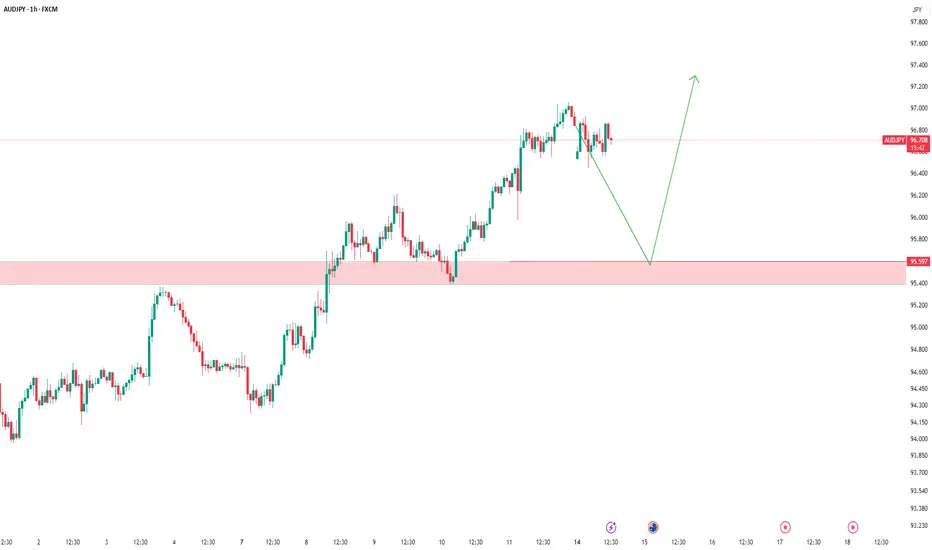
AUDJPY – Waiting for the Long SetupThe price is currently in a corrective move,
and as always, we’ve already marked our key level.
📍 We’re patiently waiting for price to reach our support zone.
If a valid buy signal appears, we’ll take the long position
according to our trading plan.
❌ What if the level breaks?
No worries.
We don’t predict — we follow the market.
We’ll wait for a clean pullback and enter short if confirmed.
🎯 Our job isn’t to predict where price will go,
our job is to manage risk and stay aligned with the market.
Price can do anything —
we’re ready for every scenario.
GBPCHF – Setting Up for a ShortWe’ve clearly marked our key resistance zone,
and now we’re patiently waiting for price to reach that level.
⚠️ Once we get a valid bearish signal,
I’ll open a short position according to plan.
🔁 If the level breaks cleanly and pulls back,
I’ll flip my bias and go long from the retest —
because I don’t marry levels,
I follow what price tells me.
We’re not here to predict.
We’re here to react, adapt, and manage risk.
The market does what it wants — and I’m ready for every scenario.

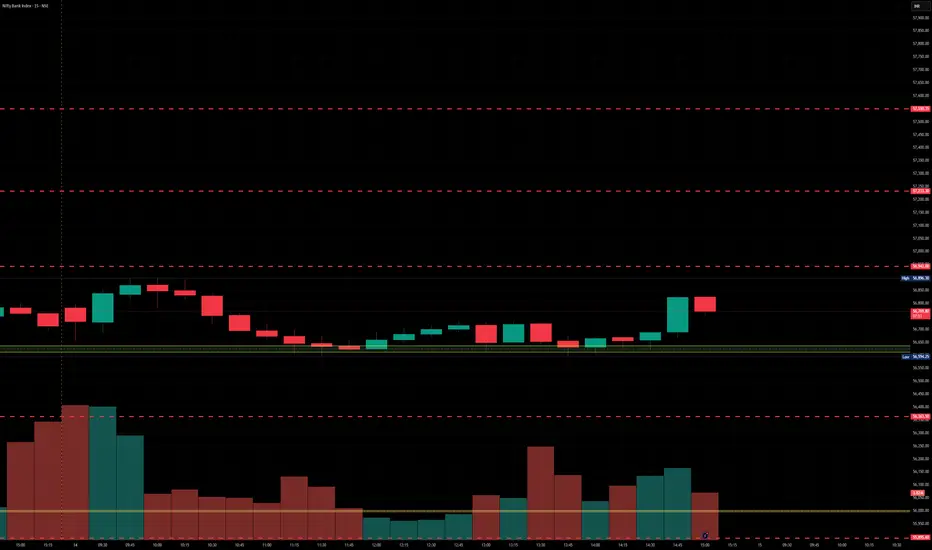
BankNifty levels - Jul 15, 2025Utilizing the support and resistance levels of BankNifty, along with the 5-minute timeframe candlesticks and VWAP, can enhance the precision of trade entries and exits on or near these levels. It is crucial to recognize that these levels are not static, and they undergo alterations as market dynamics evolve.
The dashed lines on the chart indicate the reaction levels, serving as additional points of significance. Furthermore, take note of the response at the levels of the High, Low, and Close values from the day prior.
We trust that this information proves valuable to you.
* If you found the idea appealing, kindly tap the Boost icon located below the chart. We encourage you to share your thoughts and comments regarding it.
Wishing you successful trading endeavors!
GBPNZD – Waiting for Price to Reach the ZoneWe’re currently waiting for price to reach our key level.
Once it does, and we see a valid buy signal, we’ll enter a long position.
🔄 All scenarios remain active.
Those who follow my analyses regularly already know the flow —
so no need to repeat the full breakdown.
As always, we don’t predict – we react to price.
We’re not here to guess what the market will do,
we’re here to manage our risk and trade what we see.

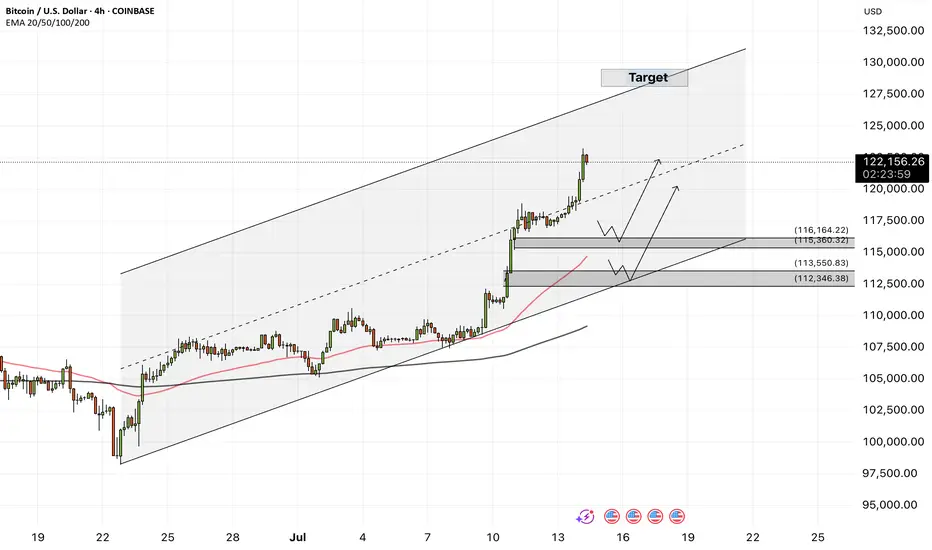
Bitcoin - Bitcoin, Unrivaled in the Market!Bitcoin is above the EMA50 and EMA200 on the four-hour timeframe and is in its ascending channel. Bitcoin’s current upward momentum has the potential to reach the target of $130,000. If it corrects, Bitcoin buying opportunities can be sought from the specified demand zones.
It should be noted that there is a possibility of heavy fluctuations and shadows due to the movement of whales in the market and compliance with capital management in the cryptocurrency market will be more important. If the downward trend continues, we can buy within the demand area.
In recent days, Bitcoin has managed to set a new historical high by crossing the $118,000 level; a jump that followed the strong accumulation of institutional capital, the upward trend of spot ETFs and the remarkable consolidation of such indices. This growth is not only the result of technical conditions or short-term market excitement, but is a clear reflection of the structural maturity of the Bitcoin ecosystem in the second half of 2025. A careful and comprehensive examination of the fundamental parameters shows that Bitcoin is moving differently than in the past: slower, but with much stronger support. On the other hand, more than $205 million in Bitcoin short selling positions have been liquidated following the jump in the price of Bitcoin and its crossing the $122,000 level.
First, the flow of investment from Bitcoin spot ETFs has broken records over the past week. In one day, more than $1.18 billion entered these funds, and the total annual inflow of these financial instruments has reached more than $51 billion. This is while ETFs such as IBIT (managed by BlackRock) and FBTC (managed by Fidelity) are attracting hundreds of Bitcoins daily, without causing any negative divergence in price indices. This phenomenon clearly shows that the participation of institutional investors through regulated channels is not only stable, but also accelerating. Along with this flow of capital, the parameters of the chain also paint a picture of a market with a balance of supply and demand. The MVRV ratio, an indicator for measuring market profitability, fluctuates between 2.2 and 2.34, meaning that the market is in a reasonably profitable state, but is still some way from the warning zone of profit saturation. Meanwhile, long-term holders (LTHs) are also continuing to accumulate. Long-term wallet holdings have reached a record high of 14.7 million BTC, representing nearly 70% of the total supply. In the last quarter alone, more than 13,000 BTC have been added to this group’s reserves.
On the other hand, the SOPR indicator, which measures realized profit ratio, shows that profit-taking is taking place at a gentle slope in the market, away from heavy selling pressure. This logical trend of profit-taking is a testament to mature investor behavior. Bitcoin flows to exchanges are also at very low levels; Bitcoin held on exchanges now account for just 1.25% of the total supply—the lowest level in over a decade. This significant reduction in potential selling pressure has kept Bitcoin’s price stable in the face of short-term volatility.
Behaviorally, the market is also showing signs of maturation. The number of daily active addresses has remained stable, but unlike during the buying frenzy, we are no longer seeing retail traders rushing into exchanges or mass wallet outflows. In other words, on-chain activity has stabilized, similar to the behavior of traditional mature markets—markets driven by data and structure, not emotion. From a macro perspective, the outlook for Bitcoin in the medium term is also positive. Many analysts and institutions, including Global X ETFs, see Bitcoin’s growth to $200,000 within the next 12 months as achievable. Technical analysis from some sources has also outlined the $140,000 range as the next price target in the next 100 days, provided that the VIX volatility index remains low and macroeconomic data maintains its current trajectory. However, a more conservative scenario sees a price consolidation in the $95,000-$100,000 range if geopolitical pressures increase or ETF inflows weaken.
Overall, Bitcoin is moving ahead in the summer of 2025 not only on the back of crypto market excitement, but also on the back of strong fundamentals and structured institutional capital inflows. Accumulation by long-term holders, a steady decline in supply on exchanges, a reasonable profit-taking balance, and a formal investment structure via ETFs have all combined to bring the market to a stable state and ready for further increases. If this trend holds, levels of $125,000-$140,000 in the short term, and a range of $180,000-$200,000 by the end of the year, are not far off!
On the other hand, BlackRock’s Bitcoin ETF (IBIT) managed to record the fastest growth in history among all ETFs, surpassing $80 billion in assets in just 374 days! For comparison, it should be noted that the S&P500 Index ETF needed about 5 times this time! BlackRock now holds about 706,000 Bitcoins (equivalent to 56% of the total ETF share).
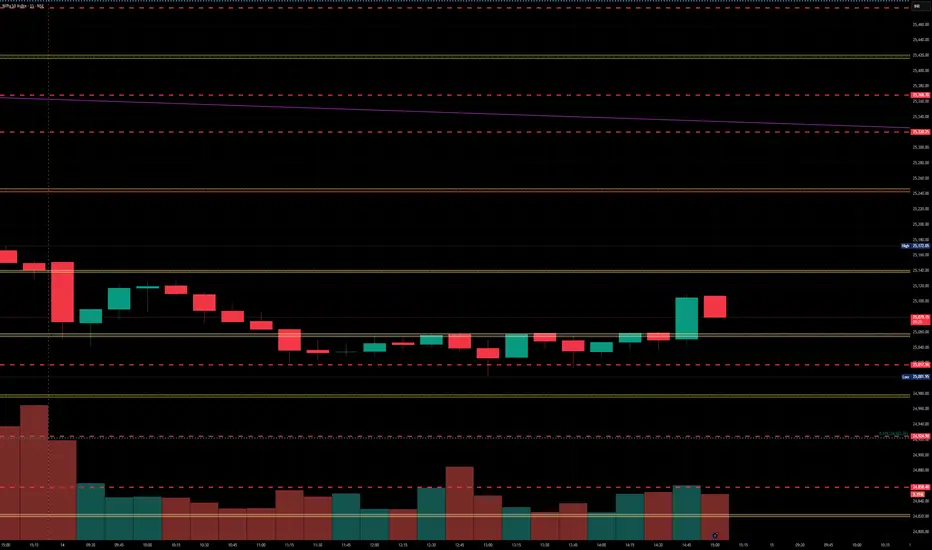
Nifty levels - Jul 15, 2025Nifty support and resistance levels are valuable tools for making informed trading decisions, specifically when combined with the analysis of 5-minute timeframe candlesticks and VWAP. By closely monitoring these levels and observing the price movements within this timeframe, traders can enhance the accuracy of their entry and exit points. It is important to bear in mind that support and resistance levels are not fixed, and they can change over time as market conditions evolve.
The dashed lines on the chart indicate the reaction levels, serving as additional points of significance to consider. Furthermore, take note of the response at the levels of the High, Low, and Close values from the day prior.
We hope you find this information beneficial in your trading endeavors.
* If you found the idea appealing, kindly tap the Boost icon located below the chart. We encourage you to share your thoughts and comments regarding it.
Wishing you success in your trading activities!
EURGBP – Waiting for the Market to Come to UsWe are patiently waiting for price to correct
and reach our level.
📌 If the price touches the level and gives us a valid signal,
we will buy.
📉 But if the level is broken, we don't panic —
we simply wait for a pullback and enter a short position.
🧠 No guessing, no stress.
We let the market come to us, and then we react — according to plan.

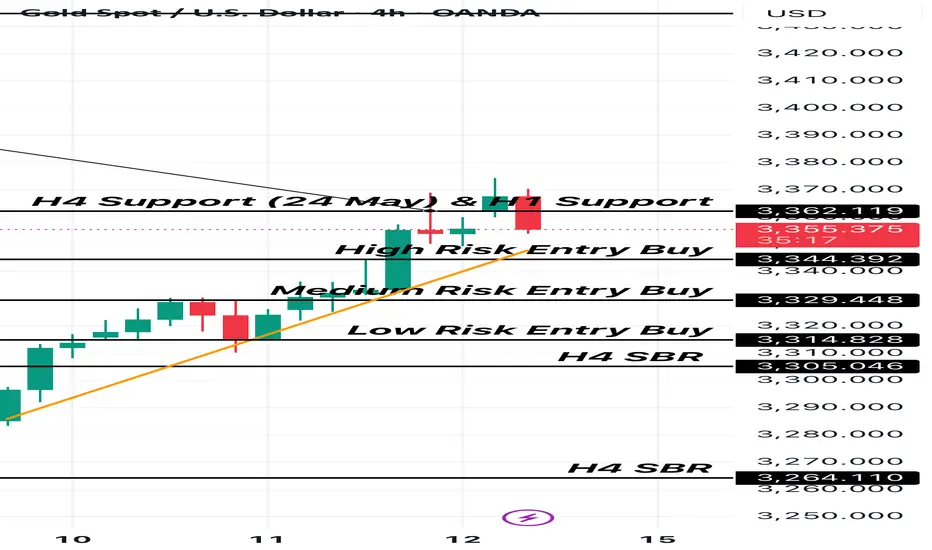
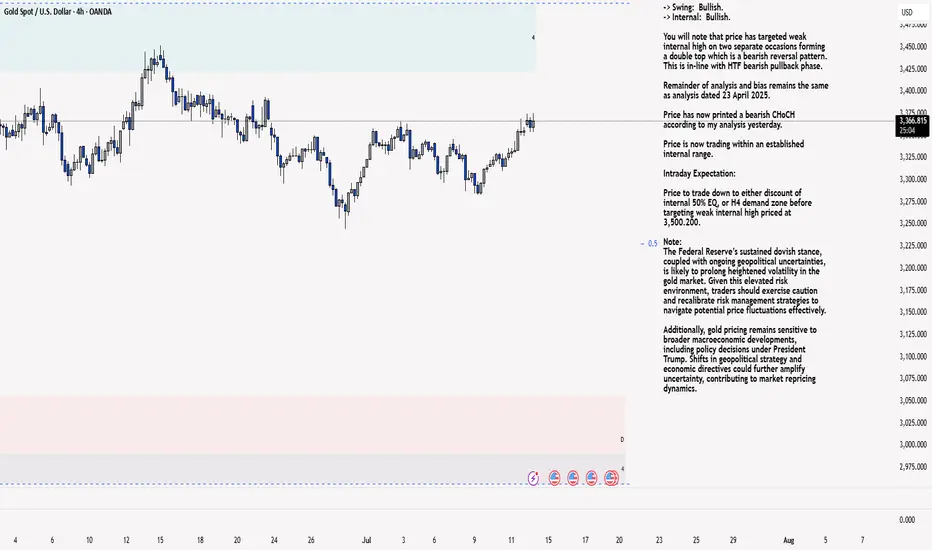
XAU/USD 14 July 2025 Intraday AnalysisH4 Analysis:
-> Swing: Bullish.
-> Internal: Bullish.
You will note that price has targeted weak internal high on two separate occasions forming a double top which is a bearish reversal pattern. This is in-line with HTF bearish pullback phase.
Remainder of analysis and bias remains the same as analysis dated 23 April 2025.
Price has now printed a bearish CHoCH according to my analysis yesterday.
Price is now trading within an established internal range.
Intraday Expectation:
Price to trade down to either discount of internal 50% EQ, or H4 demand zone before targeting weak internal high priced at 3,500.200.
Note:
The Federal Reserve’s sustained dovish stance, coupled with ongoing geopolitical uncertainties, is likely to prolong heightened volatility in the gold market. Given this elevated risk environment, traders should exercise caution and recalibrate risk management strategies to navigate potential price fluctuations effectively.
Additionally, gold pricing remains sensitive to broader macroeconomic developments, including policy decisions under President Trump. Shifts in geopolitical strategy and economic directives could further amplify uncertainty, contributing to market repricing dynamics.
H4 Chart:
M15 Analysis:
-> Swing: Bullish.
-> Internal: Bullish.
H4 Timeframe - Price has failed to target weak internal high, therefore, it would not be unrealistic if price printed a bearish iBOS.
The remainder of my analysis shall remain the same as analysis dated 13 June 2025, apart from target price.
As per my analysis dated 22 May 2025 whereby I mentioned price can be seen to be reacting at discount of 50% EQ on H4 timeframe, therefore, it is a viable alternative that price could potentially print a bullish iBOS on M15 timeframe despite internal structure being bearish.
Price has printed a bullish iBOS followed by a bearish CHoCH, which indicates, but does not confirm, bearish pullback phase initiation. I will however continue to monitor, with respect to depth of pullback.
Intraday Expectation:
Price to continue bearish, react at either M15 supply zone, or discount of 50% internal EQ before targeting weak internal high priced at 3,451.375.
Note:
Gold remains highly volatile amid the Federal Reserve's continued dovish stance, persistent and escalating geopolitical uncertainties. Traders should implement robust risk management strategies and remain vigilant, as price swings may become more pronounced in this elevated volatility environment.
Additionally, President Trump’s recent tariff announcements are expected to further amplify market turbulence, potentially triggering sharp price fluctuations and whipsaws.
M15 Chart:
DOW JONES INDEX (US30): Classic Gap Trade
I see a gap down opening on US30 index.
As always, there is a high chance that this gap is going to be filled.
A bullish imbalance candle and a local change of character CHoCH
indicate a highly probable rise to a gap opening level.
Target - 44300
❤️Please, support my work with like, thank you!❤️
I am part of Trade Nation's Influencer program and receive a monthly fee for using their TradingView charts in my analysis.

WTI Crude Oil Analysis – 4-Hour TimeframeWTI Crude Oil Analysis – 4-Hour Timeframe
At the moment, the price is trading below a key resistance zone (marked in red), which has previously triggered multiple pullbacks. The current price behavior near this area reflects market hesitation to break through this level.
🔴 Bullish Scenario:
If the price manages to break above this resistance zone and holds above it, we can expect the upward movement to continue toward higher resistance levels. This move may unfold in a step-by-step trend, accompanied by intermediate pullbacks. The next resistance zones could act as potential targets for the bullish wave.
🔴 Bearish Scenario:
If the price reacts negatively to the current resistance area and fails to break through, a bearish correction may follow. In this case, the nearby short-term support levels could be the first targets for sellers. If those supports are also broken, the likelihood of a deeper decline and continuation of the downward trend increases.

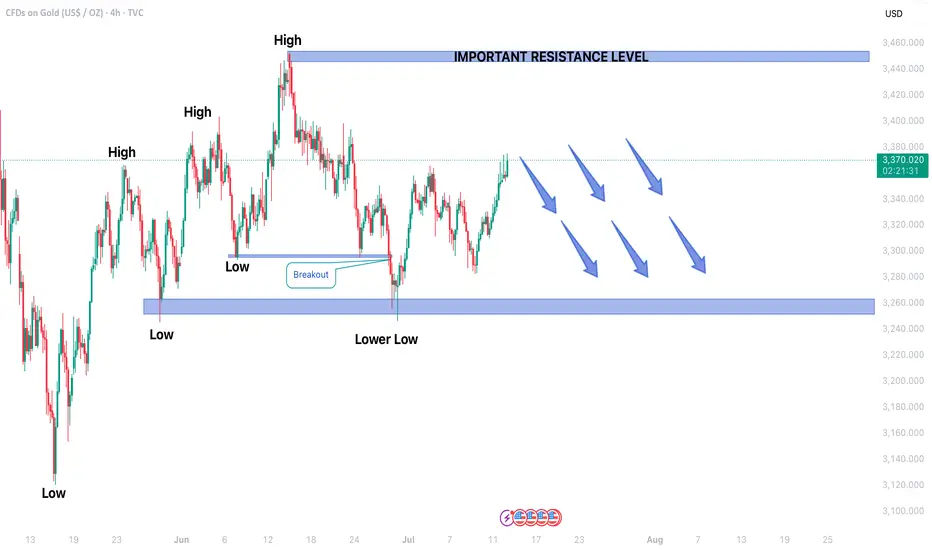
GOLD TRADING IN BEARISH TREND IN 4H TIME FRAMEGold price forming Lower lows which indicated Bearish trend movement.
Price is currently moving in Secondary Trend.
In upcoming sessions secondary trend may end and price may start forming Primary trend.
After a candlestick reversal pattern, Gold may continue to fall.
Price may hit the support level of 3250$ in upcoming sessions.
On higher side 3450$ may act as an important resistance level.
Silver Analysis – Strong Bulls and a Clean Setup AheadLast month, Silver printed a new multi-decade high, a major technical milestone.
Since then, price has entered a sideways consolidation, forming a rectangle — but what stands out is this:
👉 Silver bulls have absorbed every dip, even when Gold dropped.
That’s strength. And strength usually precedes breakout.
🔍 Current Situation
At the time of writing, price is trading around 37.20,
and from the current structure, it looks like nothing is standing in the way of an upside break.
We don’t predict — we prepare...
And this chart looks ready.
🎯 Next Target: 40.00 USD?
A push to 40.00 looks like the next “normal” target.
But don’t forget: that’s a 3,000 pip move.
This type of move will require patience
Plan your trade.
Respect your risk.
Let the bulls work. 🚀
Disclosure: I am part of TradeNation's Influencer program and receive a monthly fee for using their TradingView charts in my analyses and educational articles.

Gold (XAUUSD) Analysis – 4-Hour TimeframeGold (XAUUSD) Analysis – 4-Hour Timeframe
Currently, the price is moving in an upward trend and approaching a key resistance area. Recent volatility suggests that buyers have shown enough strength to break through previous resistance zones and are now attempting to overcome the next significant barrier ahead.
🔴 Bullish Scenario:
If the price manages to break above the current resistance and hold above it, we can expect a continuation of the upward move toward higher zones. In this case, the bullish wave could extend toward the next resistance levels (marked in blue).
🔴 Bearish Scenario:
If the price reacts negatively to the current resistance area and fails to break above it, a corrective decline may follow. The nearest support zone below could play a crucial role in maintaining the bullish structure. However, if this support is also broken, the path could open for a deeper pullback toward lower support levels.

XRPUSD SELL 3.197On the daily chart, XRPUSD stabilized and rebounded, with short-term bulls in the lead. At present, attention can be paid to the resistance near 3.197 above, which is a potential short position for a bearish bat pattern. At the same time, this position is in the previous supply area, and the downward target is around 2.340.

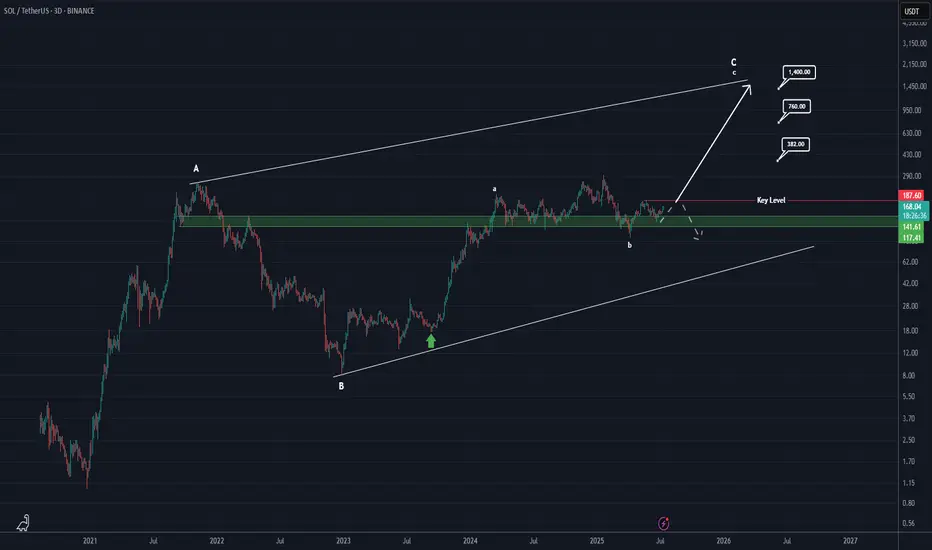
Will Solana reach $1400?After analyzing Solana’s complete data, it appears that a large diametric pattern is forming in the long term.
Currently, it seems we are in wave c of C.
If the key level of $187 is broken and price consolidates above it, we can be much more confident that we are indeed in wave c of C, confirming this scenario.
However, if the price fails to break and hold above $186 on higher timeframes like the 3D or weekly, and gets rejected downward, this scenario will be invalidated.
If confirmed, the targets for wave c of C are marked on the chart.
For risk management, please don't forget stop loss and capital management
When we reach the first target, save some profit and then change the stop to entry
Comment if you have any questions
Thank You
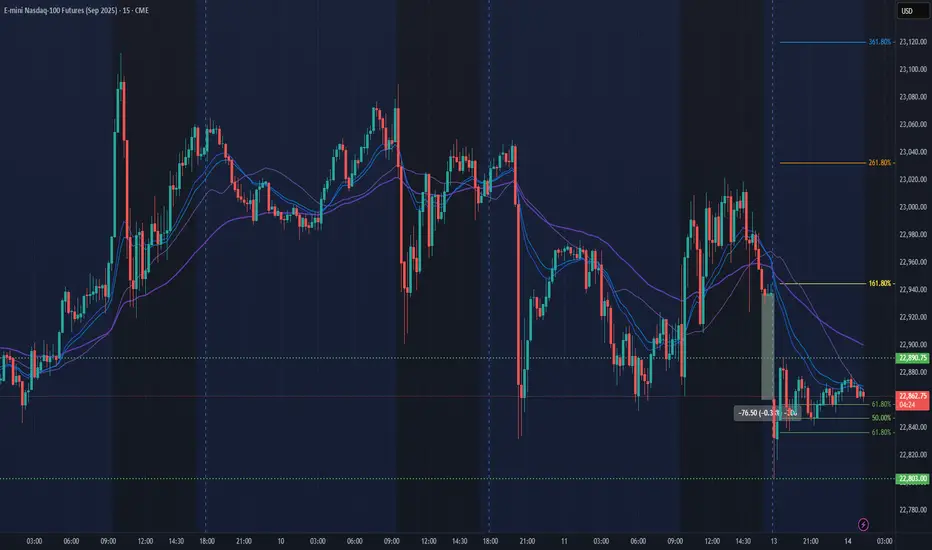
NQ Power Range Report with FIB Ext - 7/14/2025 SessionCME_MINI:NQU2025
- PR High: 22890.50
- PR Low: 22803.00
- NZ Spread: 195.0
No key scheduled economic events
0.33% weekend gap to previous week low, unfilled
Session Open Stats (As of 1:15 AM 7/14)
- Session Open ATR: 289.88
- Volume: 36K
- Open Int: 270K
- Trend Grade: Neutral
- From BA ATH: -1.0% (Rounded)
Key Levels (Rounded - Think of these as ranges)
- Long: 23239
- Mid: 21525
- Short: 20383
Keep in mind this is not speculation or a prediction. Only a report of the Power Range with Fib extensions for target hunting. Do your DD! You determine your risk tolerance. You are fully capable of making your own decisions.
BA: Back Adjusted
BuZ/BeZ: Bull Zone / Bear Zone
NZ: Neutral Zone
NZD/JPY – 4H Technical and Fundamental AnalysisNZD/JPY – 4H Technical and Fundamental Analysis
NZD/JPY remains supported fundamentally by a hawkish stance from the Reserve Bank of New Zealand, which recently held rates at 5.50%, emphasizing ongoing caution around inflation. This tone continues to favor NZD strength in the short to medium term.
Adding to that, seasonal trends also support bullish momentum July and August have historically been weak for the Japanese yen and relatively strong for the New Zealand dollar, aligning with the current upside bias.
On our Technical Side
NZD/JPY recently broke above a minor key resistance at 87.900, following a multi-week period of consolidation. This breakout signaled renewed buyer interest and a potential shift into a bullish continuation phase.
After the breakout, price entered a clear accumulation zone, where early buyers positioned themselves just above support. However, smart money triggered a stop-loss hunt below 87.900, targeting liquidity trapped beneath that key level.
This liquidity grab formed a Clear liquidity within the liquidity zone, creating a cleaner setup for long opportunities. Price is now heading back toward the previous resistance now flipped into a key support level.
📍 Buy Limit Setup:
Buy Limit Entry: 88.030
Stop Loss: 87.570 (below liquidity zone)
Take Profit: 89.250 (next minor resistance zone)
📌 Disclaimer:
This is not financial advice. Always wait for proper confirmation before executing trades. Manage risk wisely and trade what you see—not what you feel.

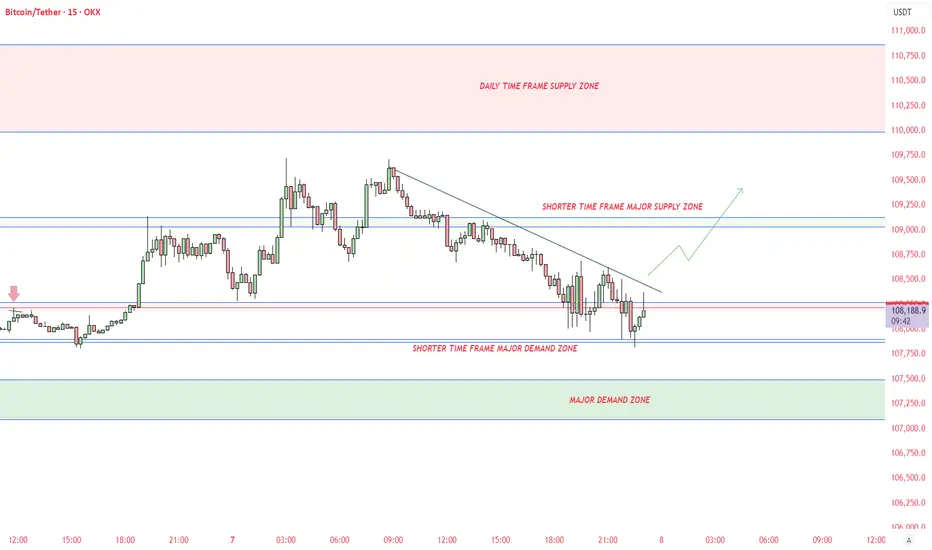
BTCUSDT - MOSTLY UPTREND DIRECTIONAll supply demand zone identified.
May breach till 110000$. Please do your own research before taking any trades