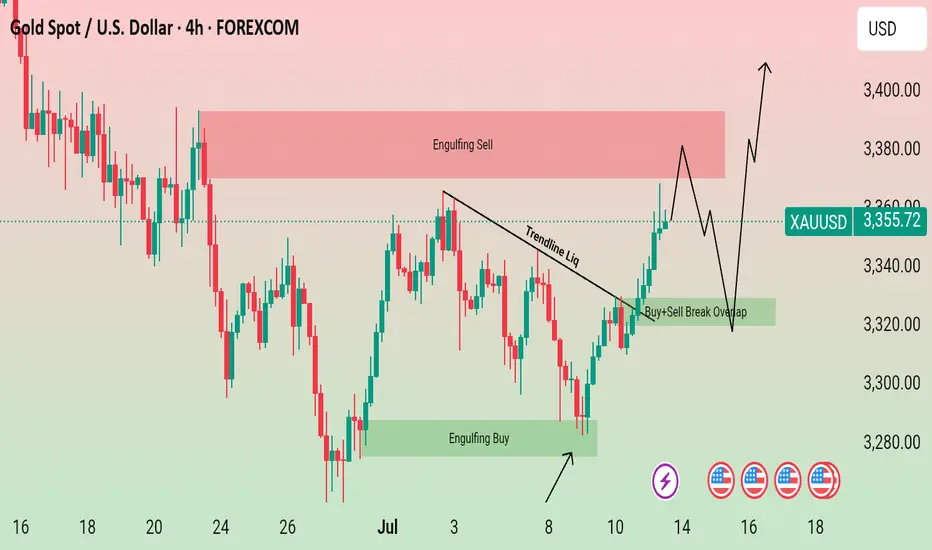
Gold just played an interesting game on the 4-hour chart!🚨 GOLD Technical Outlook – 4H Chart Insight! 🕵️♂️✨
📉 First, we spotted a Bearish Engulfing pattern that created a strong Sell Zone, signaling downward pressure. But guess what? The market wasn't ready to give up just yet…
📈 From the lower end, a powerful Bullish Engulfing stepped in like a hero, offering solid support and pushing the market back up!
Now here's where it gets exciting:
🔥 Gold has formed another bullish engulfing pattern, and the price is once again knocking on the door of that Sell Zone.
🤔 What's next?
A rejection from this sell zone could trigger another drop 📉
But keep an eye on the overlapping support zone below — if price revisits and holds there, we could see a bullish bounce toward the upside again! 🚀
📌 Key takeaway: We’re at a decision point. The next move could be explosive — up or down. Stay sharp! 🔍
⚠️ DYOR – Do Your Own Research! 🚫 This is not financial advice — just a trader's perspective.
Supply and Demand
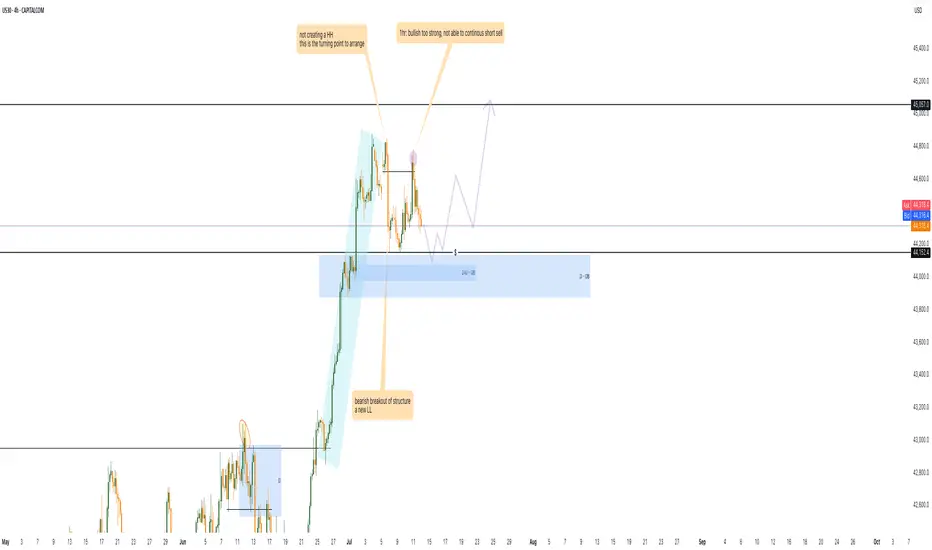
US30 prepare for the bullish 1. there is double bottom at 44152 level, i will tend to wait for the sweep meaning the price go down and hit the 4hr order block.
2. wait for 15m/ 30m TF a strong bullish momentum.
3. retest the 44152 around level or 0.618 to enter the market to long
XLM potentialXLM shows a great performance this cycle so far and it finally show some independency from XRP and lead without XRP getting pump.
Some might think it will go for ever, I am sorry to break your heart it won't be more than $70B market cap. best case scenarios.
Around $15B to $19B there will the first resistance.
1.618 fib in all timeframes will be the next, which will be $20B - $28 Market cap I think safe bet for final exit will be $53B market cap which is 350% from here.
RDNT Looks Bullish (1D)The price is showing bullish signs at the bottom.
Higher lows have formed, a trigger line has been broken, and the price has created a bullish iCH. It is now also above the demand zone.
A buy/long position can be entered upon a pullback to the demand zone.
The main targets have been marked on the chart.
If a daily candle closes below the invalidation level, this analysis will be invalidated.
For risk management, please don't forget stop loss and capital management
When we reach the first target, save some profit and then change the stop to entry
Comment if you have any questions
Thank You

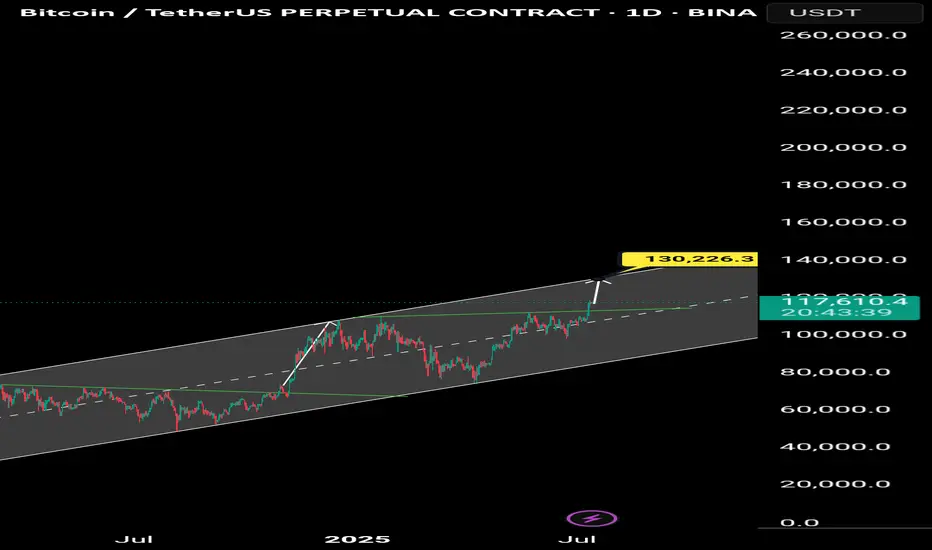
Bitcoin Go 130kBitcoin is heading towards 130,000 tomorrow
The alt season has begun and the market is sharply bullish.
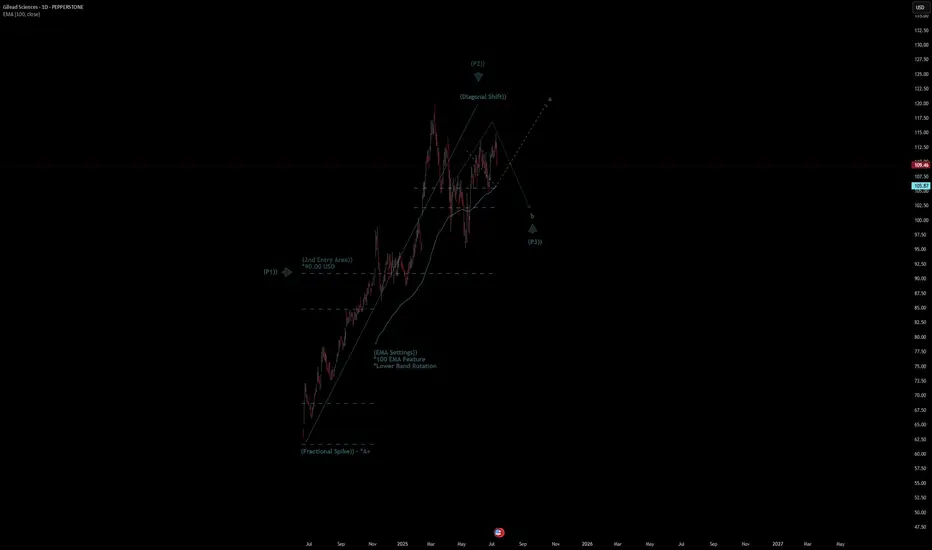
Gilead Sciences Quote | Chart & Forecast SummaryKey Indicators On Trade Set Up In General
1. Push Set Up
2. Range Set Up
3. Break & Retest Set Up
Notes On Session
# Gilead Sciences Quote
- Double Formation
* (Fractional Spike)) - *A+ | Completed Survey
* (2nd Entry Area)) - *90.00 USD | Subdivision 1
- Triple Formation
* (P1)) / (P2)) & (P3)) | Subdivision 2
* (TP1) = a / Long Consecutive Range
* (TP2) = b / Short Consecutive Pullback | Subdivision 3
* Daily Time Frame | Trend Settings Condition
- (Hypothesis On Entry Bias)) | Regular Settings
- Position On A 1.5RR
* Stop Loss At 98.00 USD
* Entry At 110.00 USD
* Take Profit At 126.00 USD
* (Uptrend Argument)) & No Pattern Confirmation
- Continuation Pattern | Not Valid
- Reversal Pattern | Not Valid
* Ongoing Entry & (Neutral Area))
Active Sessions On Relevant Range & Elemented Probabilities;
European-Session(Upwards) - East Coast-Session(Downwards) - Asian-Session(Ranging)
Conclusion | Trade Plan Execution & Risk Management On Demand;
Overall Consensus | Buy
GBPUSD - Also continued downside continuationLooking at GU. This is a little bit ahead of its time in comparison to EU.
And what i mean by that is EU is a lot further away from its 4H demand zone compared to GBP so it will be super interesting to see how we react at the level we are fast approaching on GU.
I am in a short position as of Friday. I will be posting a video tomorrow showing exactly how and why i got short on GU so stay tuned for that one.
As always if there is anything else i can be of assistance with give me a message and i will be happy to answer any questions you may have

EURUSD - Still Orderflow remains bearishLooking at EU. The 1H Orderflow is still maintaining that bearish intent. My area is set now for where i want to take a potential sell to the downside seeing as everything else is pretty much mitigated.
The only issue with this potential sell of is that we never really had a sweep of liquidity before we rolled over and moved to the downside.
We do have a level of inducement before our POI but i think in an ideal world i would love to see us build up a bit more liquidity before the POI just to induce the early sellers before making that move to the downside.
For now. On the lower TF's i will be looking to take short term long positions back up to our POI before looking for the longer terms short. to our 4H POI in which i will be looking to get long once again.
Any questions feel free to give me a message

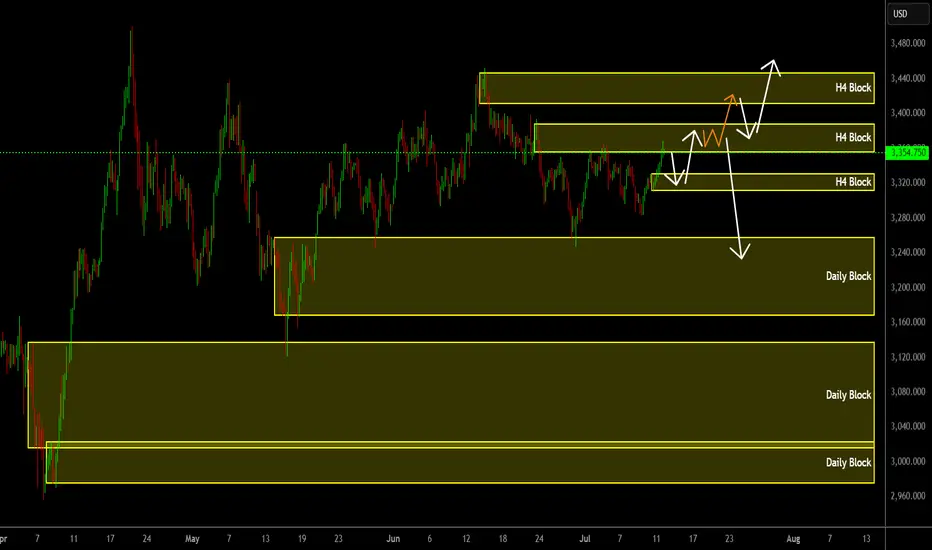
Gold Analysis H4/Daily🧠 Order Block-Based Market Structure Analysis
In this analysis, we leverage Smart Money Concepts (SMC), focusing on the interaction between order blocks and market structure on the H4 and Daily timeframes. This hybrid approach enables a high-probability forecast of price action within a strategic framework.
🟢 Market Structure Overview
The current structure is forming an ascending range with higher lows, suggesting bullish intent — but with no clear breakout above previous structural highs yet. The market is essentially building liquidity traps around premium zones, setting up for a potential expansion move.
🔶 Key Zones Identified
H4 Supply Blocks (Upper Resistance Areas)
Three H4-level order blocks are stacked above the current price, each representing potential points of liquidity absorption or reversal:
First Block: Minor resistance, likely to be breached.
Second Block: Main liquidity zone where sellers may become active.
Third Block: Final trap or target zone in case of aggressive bullish expansion.
Daily Demand Blocks (Deeper Support Areas)
Three major Daily order blocks are marked below. These are institutional accumulation zones and key areas for potential price reaction or reversal:
Zone 1: Short-term support
Zone 2: Mid-term support with stronger price memory
Zone 3: High-confluence zone likely to be defended if reached
📈 Scenario Projections
✅ Bullish Scenario (Primary Path - White Arrows)
Price may first revisit a minor H4 OB below.
If price breaks the local high, we expect movement toward the second and third H4 OBs.
A clean break of those zones confirms a bullish continuation structure.
⚠️ Bearish/Corrective Scenario (Alternative Path - Orange & White Arrows)
If price fails to break above the second H4 OB and shows signs of exhaustion or liquidity sweep:
We could see a sharp rejection.
Breakdown of support may lead to a drop toward the Daily OB at 3240, or even deeper levels near 3080 or 3000 if momentum strengthens.
🔍 Key Trading Insights
Wait for confirmation candles (impulse + volume spike) around order blocks before execution.
Monitor volume behavior at key zones — strong volume without movement can indicate absorption.
Daily blocks are ideal long entry zones if structure and reaction confirm institutional buying.
🎯 Conclusion
This dual scenario strategy based on H4 and Daily order blocks provides traders with a clear directional roadmap. The reaction to the middle H4 OB will be the turning point — either leading to a breakout rally or a breakdown into deeper institutional zones.
📌 Stay patient and let price reveal its intent around these engineered liquidity levels.
Guppy - Long TradeExpecting a bearish move down and then a strong reversal at the levels displayed!
Happy Trading!

EURAUD clearly strong Australian dollarEURAUD is definitelly starting a bearish trend so I have 2 AOI Daily waiting one of them to be retested and once I see a Bearish Engulfing Pattern I am going to get in.

EURGBP trend is your friendSimple trade I am going to look for the retest of the area or touch of the POC with a beatiful and clear Engulfing Pattern on it. Pay attention I do not have any Daily area of interest level, so it may be a risky trade.

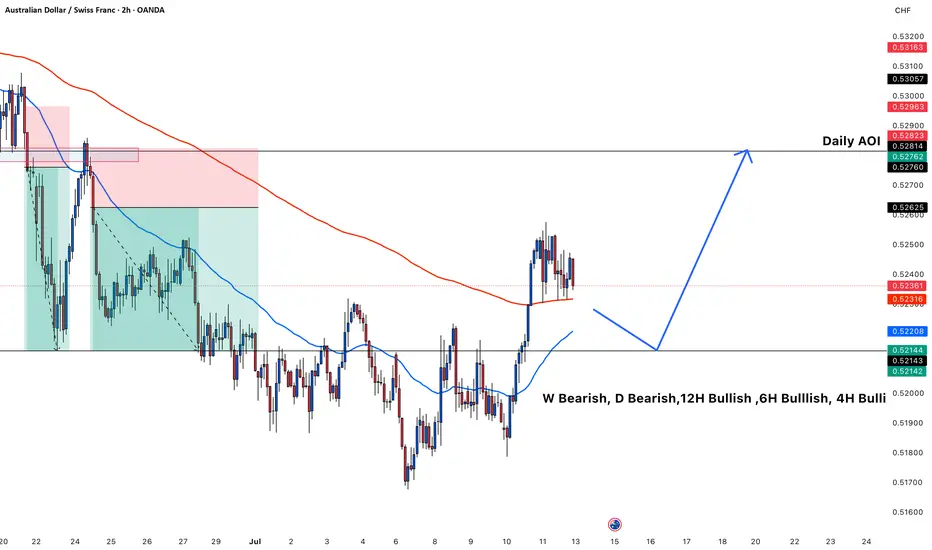
AUDCHF will continue its Bullish BiasIt has accumulated well AUDCHF already broke the structure.
I am just waiting for the Retest of the level.
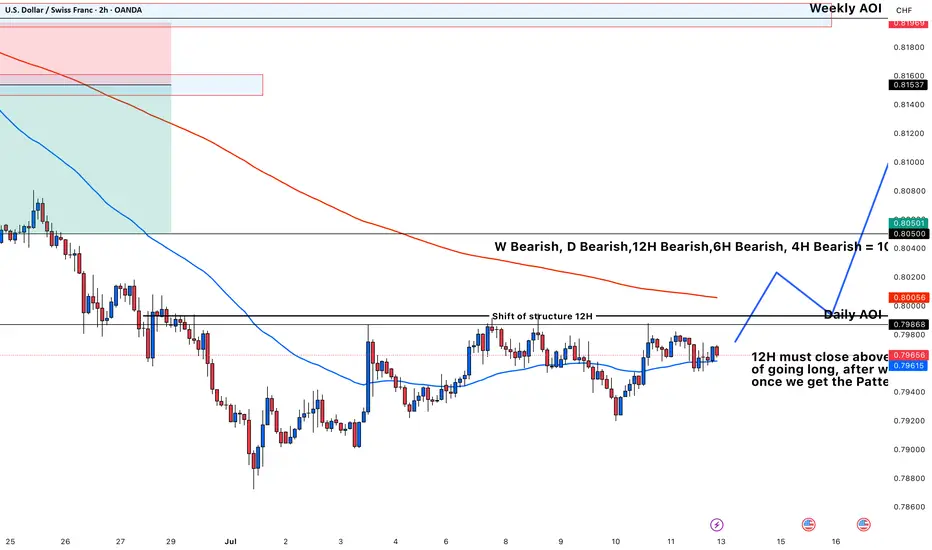
USDCHF once break the structure It will go longUSDCHF in the moment is a Bearish Bias, that is the reason I am wating the 12H to close the body candle above the level, after I am waiting for the retest of the level and once I see my Beautiful pattern { Engulfing Candle } I will take the trade.
Beautiful Long USDCAD is getting ready next weekI love this pair once I will see a break and retest of the level I will place my order long.
In the moment it is on the POC level so it will be soon go long. I am looking for the engulfing pattern to sit on my level and I am going to teke the trade.

PHB Looks Bullish (1D)It appears that wave E has ended after a long consolidation and the formation of a double bottom. A key trigger line has been broken, and the price has reclaimed the flip zone (marked in green).
As long as the green zone holds, the price can move toward the targets and the red box.
The targets are marked on the chart.
A daily candle closing below the invalidation level will invalidate this analysis.
For risk management, please don't forget stop loss and capital management
Comment if you have any questions
Thank You
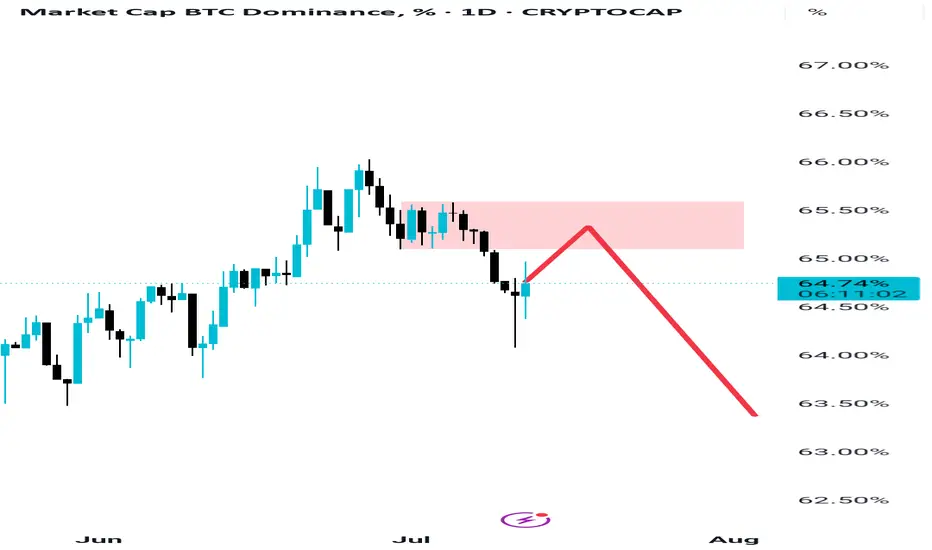
Btc Dominance Just doing retest, HOLD Everyone is selling their altcoins out of fear after minor pumps, but they don’t realize that Bitcoin dominance is only retesting its supply zone. It has already broken its structure, indicating a shift into a downtrend. This retest is not a reversal—yet people are spreading fear among each other as if something major is about to happen. Many will miss what’s coming and regret it later. Don't miss Altseason which is coming in few days not weeks.
Mind It
BTCUSDTWait for breaked ATH for 115K target.
BINANCE:BTCUSDT.P
Now price is in two level trading renge but come entry volume of buyers.

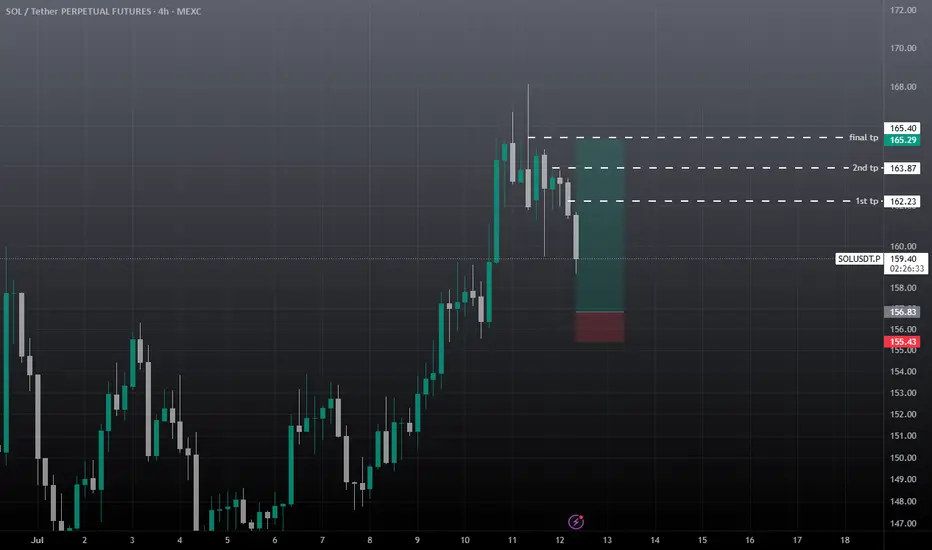
SOL USDT SCALP Long / Buy Setupwait for the entry and then take, as liquidation still lies upside, chances are high that sol will re-visit 164, before any major move to the downside. SL is important on any side. We took good profit on previous SOL short setup.
How "Whales" Manipulate Markets: A Trader's Guide to SucceedEvery chart tells a story of institutional footprints. For most, it's chaotic noise. But when you understand the market's true engine — the constant need of "Smart Money" to capture vast amounts of liquidity to fill their orders — that noise turns into a clear map.
This guide will teach you to read that map. We will break down the main types of manipulation and show you how to use them to identify high-probability zones for potential entries.
So, why exactly is liquidity the fuel for these "Smart Money" players, which for simplicity, we'll call "Whales"? It's because a Whale holds the largest volume of funds in a specific asset and, unlike retail traders like us, it cannot open its huge position at any given moment simply because there aren't enough buy or sell offers on the market.
To fill its orders, the Whale constantly carries out manipulations to capture additional liquidity. This isn't about deception or anything negative—it's how the market constantly forms its movements, how whales achieve their goals by moving from one liquidity pool to another, much like whales in the ocean hunt for plankton to get vital energy for long journeys from one feeding ground to another.
Why will these principles of price movement through manipulation, which worked decades ago, continue to work forever? Because human nature doesn't change over time. The crowd is always driven by greed and fear, making it easy to manipulate. Therefore, manipulation is often the motive for the birth of a future move and is a key element in market mechanics. If you understand these mechanics, you will be able to see the footprints of whales on any chart and not only minimize your chances of becoming their food but also join their next move to get your share of the profit in the boundless ocean of market opportunities.
Let's take a closer look at how whales carry out their manipulations and classify their types.
The Whale is constantly in hedged positions. To fill its large-sum orders without impacting the price, it uses the principles of Sell to Buy (STB) and Buy to Sell (BTS) .
The STB manipulation is used to accumulate long positions. To do this, the Whale opens an opposing short position, activating stop orders and liquidations of buyers, purchasing their positions at a favorable price. It also encourages other retail participants, especially breakout traders, to open short positions. Continuing to accumulate long positions, the Whale sharply moves the price up, liquidating short participants and absorbing their positions. After the price has moved up, the Whale is left with an open losing position from its short manipulation. To close it at breakeven or a small loss, the Whale needs to return the price back to the zone of its manipulation. This return is called mitigation .
In the opposite case, when the Whale needs to drive an asset's price down, it uses the BTS manipulation . To fill its short positions, the Whale opens a long position, activating stop-losses and forced liquidations of sellers, and encouraging retail breakout traders to also open long positions. Continuing to accumulate short positions, the Whale aggressively moves the price down, absorbing and liquidating the positions of impatient longs. After the downward impulse is complete, the Whale is left with an open losing long position. Just as in the first case, to close it at zero or a small loss, the Whale needs to return the price to the manipulation zone, after which another markdown of the asset occurs, and the cycle can be repeated as many times as necessary.
Thus, through manipulation, the Whale achieves two goals at once:
It gets the most favorable price.
It eliminates most of its competitors by liquidating their positions with an opposing move.
Most of the time, the price movement between manipulations is unpredictable. Entering during this movement, for example, in the middle or end of an impulse or within a range, increases the chances that you will become a victim of the next manipulation and liquidity for the Whale. However, if you wait for the price to arrive at the manipulation zone, also known as a Point of Interest (POI) , and ensure that the Whale acknowledges this area (i.e., it has stopped there and is beginning a reversal), the probability of choosing the correct direction for a trade will be on your side.
To help you recognize manipulation zones, let's look at their different types.
🔹 Order Block (OB) - A down candle (sometimes 2, rarely 3 candles) before an impulsive move up (in the case of a bullish OB), or an up candle (sometimes 2, rarely 3 candles) before an impulsive move down (in the case of a bearish OB). In most cases, this short, sharp move should sweep some form of significant liquidity. An additional confirmation of an Order Block is the immediate imbalance or Fair Value Gap (FVG) that follows it, because the Whale's intensive position accumulation and the associated impulse move don't allow enough time for all market participants' orders to be filled.
🔹 Demand/Supply Zones are similar in principle to Order Blocks but differ in that they have a more prolonged action, which can consist of many up or down candles, making these zones often significantly wider than OBs.
Demand Zone - The last downward move before an intensive rally.
Supply Zone - The last upward move before an intensive drop.
Often, an Order Block can be found inside a Demand/Supply zone.
🔹 Range - Also a manipulation zone and essentially an Order Block, but unlike an OB, this manipulation can last for a very long time when the Whale lacks sufficient liquidity from a quick manipulation and accumulates its large position by collecting internal and external liquidity through the range. Ranges, just like Order Blocks and Demand/Supply zones, are points of interest for the Whale to close its losing hedged positions and continue moving towards its goals.
Conditions for Applying and Validity of Manipulation Zones
An important condition for applying manipulation zones is that they can only be used once . That is, if the price has come to a zone and reacted to it, upon a second arrival, that zone is no longer valid. For convenience in marking used zones, I shorten them to the point of the first touch so as not to consider them anymore, but to understand which way the order flow is directed—a very important concept that, unlike structure, shows the true direction of the Whale's movement. Order flow is manifested by the price reacting to manipulation zones from below in an uptrend and from above in a downtrend.
It is also very important to understand that it makes sense to identify and use manipulation zones as one of a trade's entry conditions only from below for an uptrend and from above for a downtrend . Any counter-trend zones formed in the path of a trend are highly likely to be broken and serve as liquidity.
In ranges, manipulations formed after deviations can be used for entries from both sides.
Only manipulations that were formed at the beginning of an impulsive price move can be considered valid for entry. That is, they must be the manipulations that directly triggered the start of the move; in Smart Money terminology, they are often called the "origin" . Any manipulation in the middle or end of a move will most likely serve as liquidity on the way back to mitigate the origin zone.
How long does a manipulation zone remain relevant? It remains relevant until a new structural element (a higher high or a lower low) is formed , especially if the price has already come close to the manipulation zone, for example, into the FVG before the zone. This most likely means the Whale has already finished its business there and closed one of its losing hedged positions at a small loss. When the trend changes, such a zone will act as liquidity, not a POI. So, a manipulation zone will not always be mitigated; often, a reversal occurs from the FVG before it. However, entering from an FVG is much less reliable than from an Order Block, Demand/Supply zone, or Range. I personally skip such entries and wait for a new manipulation zone to form and be mitigated; they happen on the market constantly.
A good bonus that further strengthens the probability of a setup working out during the mitigation of manipulation zones is a liquidity sweep upon reaching them.
Consider the context and supplementary conditions. Although manipulation zones are the strongest areas for price reversals, they should always be used in conjunction with other supplementary conditions and tools, for example, with Fibonacci retracement levels or liquidity sweeps. "Context" implies any other conditions that can either confirm or contradict the likely direction of price movement. For example: in which phase of correction is the price? For a long, safe entries can only be considered from the discount zone (below the 50% Fib level); for shorts, only from the premium zone (above the 50% Fib level). Is there significant, un-swept liquidity nearby, such as previous daily, weekly, or monthly highs/lows, or an untouched Asian session high/low? What upcoming news could affect the asset and hit the stop before the setup plays out? At what time of day did the price mitigate the manipulation? Taking context into account is a crucial and integral part of analysis in the search for entry points.
Due to the fractal nature of market charts, manipulations can be seen on any timeframe. On weekly and daily timeframes, manipulation zones can be used for swing trading or investment purchases. 4-hour and 1-hour timeframes will show potential entries from manipulations for intraday trading or holding positions for several days. 5-minute and 1-minute timeframes will show manipulations in the form of order flow for final entry confirmation.
Whatever type of analysis you use for your trading, understanding the nature of market manipulations and practicing their recognition will allow you to be one step ahead of most market participants and open your trades with an understanding of which way institutional capital is most likely to move next.
~~~~~~~~~~~~~~~~~~~~~~~~~~~~~~~~~~~~~~~~~~~~~~~~~~~~~~~~~~~~~~~~~
If you found this guide helpful, support it with a Boost! 🚀
Have a question or a "lightbulb moment" from this article? Share it in the comments! I read every single one. 💬
► Follow me on TradingView for more educational content like this and to not miss my next detailed trade idea .
~~~~~~~~~~~~~~~~~~~~~~~~~~~~~~~~~~~~~~~~~~~~~~~~~~~~~~~~~~~~~~~~~

GME LONG IDEA UPDATEDIn my previous post regarding the long opportunity on GME stock, I called a long signal after a break out of a downtrend line. However, price had dropped down to the demand zone, giving another long opportunity.
To take advantage of this long opportunity, you can buy at the current market price, while the exit will be at $20.30 and the targets can be at $35.70, $47.90 and the final target at $64.70.
Confluences for the long idea are as follows:
1. Weekly break of structure
2. Valid Inducement
3. Orderflow
4. Price within the discount
5. Price respecting bullish trendline
6. Hammer candlestick confirmation
7. Price at a support level
Disclaimer: This is not a financial advice. The outcome maybe different from the projection. Don't take the signal if you're not willing to accept the risk.

BTCUSDT[BITCOIN]:Price is Likely to be Heading Towards $144,000.Recently, Bitcoin has shown extreme bullish price behaviour, and there’s no sign of bearish influence in the market. After monitoring the price since May 4th, we believe there’s a high possibility of price hitting the 120k region first. This could be followed by a small correction around 105k, where a strong bullish price influence will lead the price to our final target at 140k. Both fundamental and technical factors support this view, but it doesn’t guarantee the price will follow our expectations.
Before investing or trading cryptocurrencies, do your own research as they carry significant financial risk. This chart analysis is for educational or secondary purposes only.
Good luck and trade safely.
If you want to support and encourage us, you can do the following: ❤️
-Like the idea
-Comment the idea
-Share ;)
Team Setupsfx_

#BTCUSDT(BITCOIN): Two Targets First $130,000 And Then $150,000Bitcoin is poised for significant distribution, with a potential price surge to $130,000, followed by a swing target of $150,000. The current accumulation phase is poised to transition into a substantial bullish move. We anticipate a surge in bullish volume in the coming days or weeks. Our analysis anticipates this transition to be completed by the end of the year or sooner.
It is important to note that this analysis does not guarantee a specific price movement and is provided solely for educational purposes.
We extend our best wishes for your successful trading endeavours. If our analysis has been of assistance, we would appreciate it if you could express your gratitude by liking and commenting.
For further insights, please follow our account.
Team Setupsfx_
