BTC 4 HR TIME FRAME ANALYSIS 4H Technical Analysis – BTCUSDT.P (Bitcoin Perpetual on Bitget)
✅ 1. Trend Overview:
Current Market Phase: Strong uptrend.
Price has broken multiple H4 BOS (Break of Structure) levels with strong bullish momentum.
The last impulse candle shows a vertical breakout, often a sign of aggressive buyers or FOMO.
🔄 2. Key Structure Zones:
🔵 Demand Zones (Highlighted in Green):
Around 113,700–114,000 → fresh demand zone after last breakout.
Around 108,000–110,000 → mid-level zone from earlier accumulation.
Deeper zone at ~96,000–98,000 → higher timeframe demand (may hold if larger correction happens).
🔴 Supply Zones (No immediate supply shown, but...)
Watch for reaction zones around 118,000–120,000 as psychological resistance.
📍 3. Price Action & Structure:
The current move is parabolic, indicating momentum exhaustion may soon follow.
However, the last CHoCH and BOS signals are clearly bullish, and pullbacks are being aggressively bought.
Short-Term Expectation:
A correction or sideways consolidation may happen near 118,000–119,000.
Best scenario: price pulls back into the 113,700 zone, forming a bullish continuation setup.
🔍 4. Candlestick Patterns:
At the top, the last 2 candles are showing wicks, indicating possible early rejection or take-profit activity.
No confirmed reversal pattern yet (e.g., no bearish engulfing, pin bar, or evening star).
Wait for confirmation if considering a reversal trade.
📉 5. Risk Zones:
If price breaks below 113,700, then correction may deepen toward 110,000 or even 108,000.
Below 108,000 would invalidate the current short-term bullish structure and signal trend weakening.
📌 6. Key Levels to Watch:
Type Price Zone Notes
Resistance 118,500–120,000 Current high zone, psychological barrier
Demand Zone 1 113,700–114,000 Nearest fresh demand
Demand Zone 2 108,000–110,000 Mid support
HTF Demand ~96,000–98,000 Deep liquidity + structural demand
✅ Conclusion:
Market is in a strong bullish trend on the 4H chart.
Wait for a healthy pullback to demand zones before considering new longs.
Watch for bearish candlestick confirmation (like engulfing or M-structure) near highs for possible short-term reversals.
⚠️ Disclaimer:
This is not financial advice or a trading signal.
It's purely educational analysis.
Always trade based on your personal strategy and risk management. BITGET:BTCUSDT.P
Supply and Demand

NZDCAD Bullish 15 min ICT 15 minute Entry:
1. Sell - side liquidity swept.
2. BOS up onM15 confirm shift.
3. Entry from bullish OB or FVG after pullback.
4. SL below liquidity sweep.
5. TP internal high/TP2 premium zone.

USDT Dominance Is Still Bearish (1D)This index is still bearish. It could either drop from here or turn bearish again after a pullback to a higher level.
The larger structure is bearish, and the price is breaking through structures in an attempt to reach the main demand zone. This bearish trend is expected to continue.
Let’s wait and see what happens.
For risk management, please don't forget stop loss and capital management
Comment if you have any questions
Thank You

Pnutusdt buy opprotunityPNUTUSDT is showing a well defined bottoming structure, completing a rounded reversal formation. Price is currently building momentum within the buy-back zone, supported by a successful break of the mid-structure line (MSL). Continuation above the IIRL neckline could trigger the next impulsive leg toward the immediate target at 0.8526, with the final setup target projected at 1.9521. Holding above 0.1831 is critical for maintaining bullish structure.

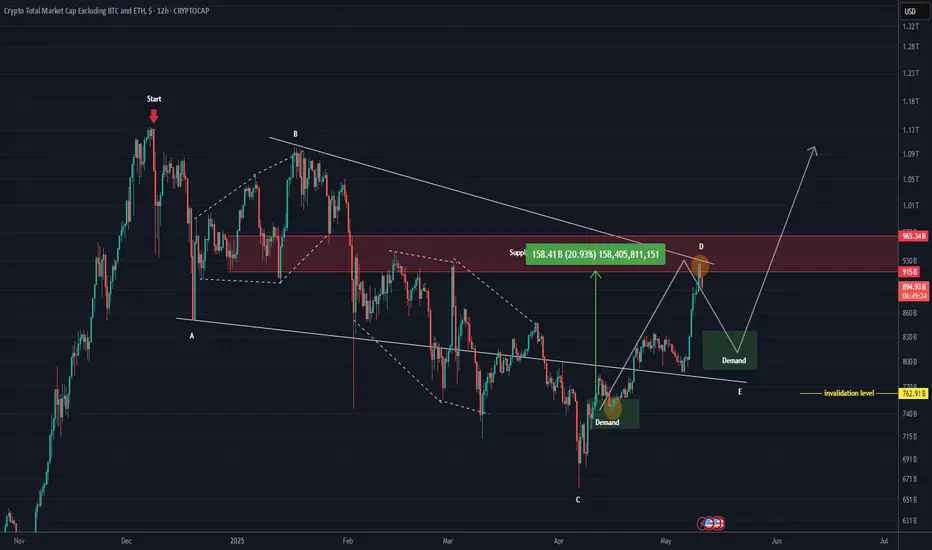
TOTAL 3 New Update (12H)This analysis is an update of the analysis you see in the "Related publications" section
TOTAL3 refers to the total crypto market cap excluding Bitcoin and Ethereum.
It pumped from the lower demand zone to the marked red box and has surged by 21%.
We now need a retracement to make the price more attractive.
If the invalidation level and the green zone hold, we could witness another bullish wave.
In this analysis, the invalidation level has been updated. A daily candle closing below this level will invalidate the setup.
Some altcoins are currently bullish, and each chart must be analyzed individually| so be cautious with your short positions.
For risk management, please don't forget stop loss and capital management
Comment if you have any questions
Thank You
THE KOG REPORT - UpdateEnd of day update from us here at KOG:
I can't say that was a bad day or week. We got the move from 3310 into our Excalibur target level 3332 and then started looking for a potential reversal. Gold, again, had other plans and just continued to activate Excalibur after Excalibur higher combined with the red box break and close, so all we could do as mentioned in the earlier post, is call it a week early.
For now, we have support at the 3350-45 level with resistance here at 3370. I don't think they will want to leave a wick on that 4H, so let's expect a potential retest of resistance.
The week in Camelot:
RED BOX TARGETS:
Break above 3350 for 3355✅, 3360✅, 3362✅, 3365✅, 3374, 3388 and 3396 in extension of the move
Break below 3335 for 3331✅, 3324✅, 3321✅, 3310✅, 3306✅ and 3293✅ in extension of the move
Wising you all a great weekend,
As always, trade safe.
KOG

GBPUSD. The plan for the next few days.The nearest resistance zones are where it's interesting to look for purchases. We are waiting for a reaction and looking for an entry point.
The post will be adjusted if there are any changes.
Don't forget to click on the Rocket! =)

Solana Wave Analysis – 11 July 2025- Solana broke resistance zone
- Likely to rise to resistance level 180.00
Solana cryptocurrency recently broke the resistance zone between the resistance level 159.80 (which has been reversing the price from the start of June) and the 61.8% Fibonacci correction of the ABC correction (2) from May.
The breakout of this resistance zone should accelerate the active impulse waves 3 and (3).
Given the strongly bullish sentiment seen across the cryptocurrency markets today, Solana can be expected to rise to the next resistance level 180.00.


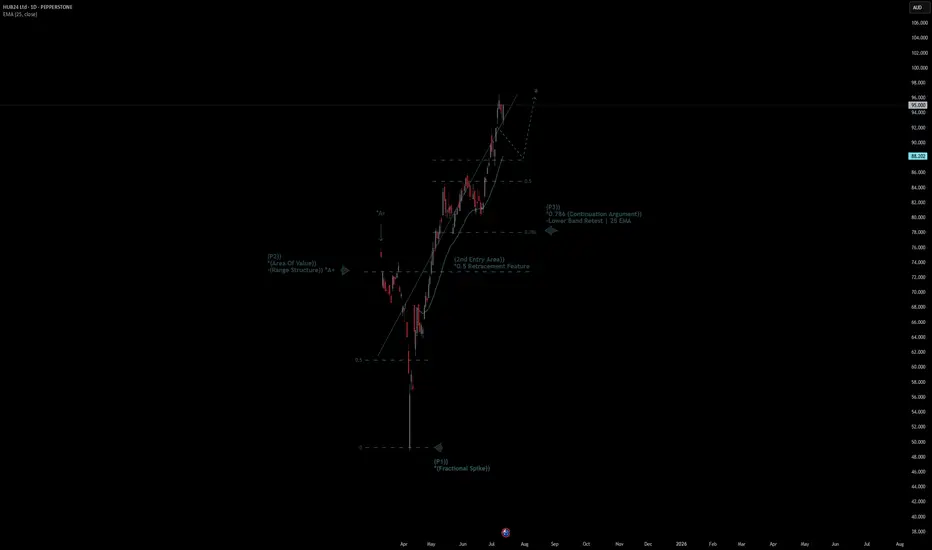
HUB24 Ltd Quote | Chart & Forecast SummaryKey Indicators On Trade Set Up In General
1. Push Set Up
2. Range Set Up
3. Break & Retest Set Up
Notes On Session
# HUB24 Ltd Quote
- Double Formation
* (Area Of Value)) - (Range Structure)) *A+ | Completed Survey
* (2nd Entry Area)) - *0.5 Retracement Feature | Subdivision 1
- Triple Formation
* (P1)) / (P2)) & (P3)) | Subdivision 2
* (TP1) = a / Long Consecutive Range
* (TP2) = b / Short Consecutive Pullback | Subdivision 3
* Daily Time Frame | Trend Settings Condition
- (Hypothesis On Entry Bias)) | Indexed To 100
- Position On A 1.5RR
* Stop Loss At 120.00 AUD
* Entry At 126.00 AUD
* Take Profit At 133.00 AUD
* (Uptrend Argument)) & No Pattern Confirmation
- Continuation Pattern | Not Valid
- Reversal Pattern | Not Valid
* Ongoing Entry & (Neutral Area))
Active Sessions On Relevant Range & Elemented Probabilities;
European-Session(Upwards) - East Coast-Session(Downwards) - Asian-Session(Ranging)
Conclusion | Trade Plan Execution & Risk Management On Demand;
Overall Consensus | Buy
If Pulsechain reaches a penny, it would = a 325XOr around $165 billion in user-based valuation, excluding the significant portion of coins held by the founder.
It's certainly a long shot, and it would probably depend on Ethereum's price reaching well into the teens
(which, as you know, I strongly support).
Thus, it is definitely within the realm of possibility considering the low initial user base and the potential influx of individuals who will join EVMs in the upcoming years.

#GOLD UPDATESIn this analysis we're focusing on 2H timeframe for finding the upcoming changes in gold price.
Here we can see clearly that gold price creates trendline resistance and also price sweep all the SSL and pre. daily LQ sweep. Now I'm waiting for retracement, If price retest my supply zone and give bearish sign or reversal confirmation than we'll execute our trades. This is a higher time frame outlook. Further analyze more deeply into smaller time frame and place our position from an perfect point.
Always use stoploss for your trade.
Always use proper money management and proper risk to reward ratio.
Keep an eye on these levels. Confirmation is key.
#XAUUSD 2H Technical Analysis Expected Move.

PWAS/USDT BIG PUPMPBreak down trend in daily time frame & now probably Big pump for Paws this bad shit coin is coming!

XAUUSD SCALP TRADEentry based on 5m tf, so wait for the entry and take it, must use sl, you can take 1st entry at cmp, 3348.5 2nd at mentioned and set the target and forget.

NFLX Bear Call Spread Near Max Profit – Watching 61.8% Fib Zone📉 I'm currently holding a Bear Call Spread 1300/1280 expiring on Jul 18. After multiple Breaks of Structure (BOS) and strong rejection from 1300, price is trending toward a key 1H demand zone near the 61.8% Fibonacci retracement (1242).
📊 Technical Context:
Bearish CHoCH + BOS confirms short-term trend reversal
Clear rejection from 1280–1300 supply
1242 = strong confluence: Fib + demand zone
🎯 Plan:
Hold the spread close to expiration for max profit
Close before earnings on Jul 17 to avoid volatility
If price shows strength at 1242, I may flip bias and look for a bull call spread post-earnings
🔔 TradingView Alerts:
1242: “Watch for bullish reaction at demand zone”
1278: “Rebound in progress – reassess post-earnings”
📌 This is a two-stage plan: secure gains on the short side, then prepare for potential upside.
➡️ Follow me for more structured trade ideas based on price action, options, and macro timing.

SPX500 Bearish Below 6246 – Eyes 6223 and 6195SPX500 Analysis
SPX500 stays under bearish pressure below 6246, targeting 6223 and possibly 6195 if the decline continues.
Recent tariff escalation by President Trump is adding weight to downside momentum across indices.
Pivot: 6246
Support: 6223, 6195, 6143
Resistance: 6268, 6291

ARB New Analysis (3D)Before anything else, pay attention to the timeframe | it's a higher timeframe and will take time.
The higher timeframe structure of ARB is honestly not that bullish. In this scenario, we’ve considered the entire correction | starting from where the red arrow is placed on the chart | as a diametric/symmetrical pattern.
From a time perspective, wave E has not yet completed, and it is expected to finish somewhere between the two vertical lines. Wave E here is a bearish wave.
If the price pulls back and reaches the green box, we can look for a buy setup in that area.
A 3-day candle closing below the invalidation level will invalidate this analysis.
For risk management, please don't forget stop loss and capital management
When we reach the first target, save some profit and then change the stop to entry
Comment if you have any questions
Thank You

Gold Update H2 Timeframe XAUUSD GOLD Update H2 Timeframe 🙌
- This Analysis is based on educational purposes using Technical aspect ❗️
- According to our Parallel Channel market break that trendy waves and we are looking and waiting for this setup
- The region and text indicates if candle above this region we were looking for bullish opportunities and our milestone will be at 3356 - 3364.00 which is acting as a Strong Resistance levels ❗️
Although candles below 3335 - 3330 will lead us to 3310 - 3300.00
Bearish Opportunities from 3356 - 3364.00 we will wait for our Price and then we will react as a long holding positions 📈
All you need to stick with one Mentor 👋
#XAUUSD

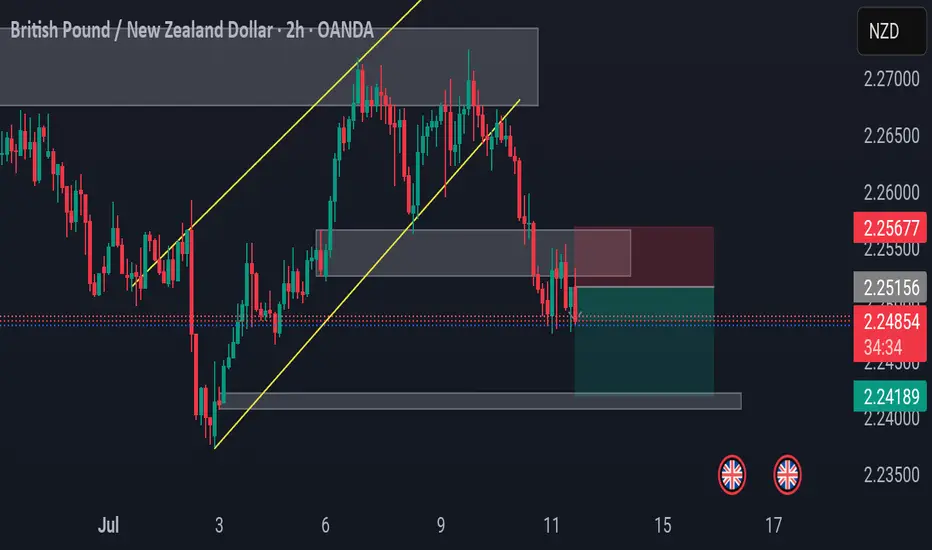
GBP/NZD – Bearish Continuation Setup in Play
🔹 2H Chart Analysis by PULSETRADESFX
The recent structure break on GBP/NZD confirms bearish momentum, with price decisively rejecting the prior bullish channel (marked in yellow). After retesting the broken support zone (now acting as resistance), a clean supply zone formed around 2.25156 – 2.25677, where price has started to stall.
📌 Trade Setup:
Entry: 2.24902
SL: 2.25677 (Above supply)
TP: 2.24189 (Next demand zone)
This aligns with the overall trend shift as buyers failed to hold the previous structure. Expecting further downside toward the next demand zone unless bulls reclaim above 2.25677 with strong momentum.
---
✅ Confluence Highlights:
Break and retest of bullish channel
Supply zone confirmation
Bearish engulfing structure at resistance
Favorable risk-to-reward setup
📅 July 11, 2025
📊 Executed on: TradingView | OANDA Feed
#GBPNZD #Forex #PriceAction #SupplyDemand #BearishSetup #TradingView
DXY (USD Basket) - 3 Month - Short Squeeze In Play?Technicals:
The last 3-month candle closed above the major resistance that tends to hold according to historic levels going back to the year 1967.
Golden Cross is almost complete (50 MA crossing the 200 MA).
Fundamentals:
The dollar has only been more shorted once in history (2018), setting things up for a potential "Short Squeeze" and triggering a "Risk Off" scenario. Tends to hurt risk assets quite hard—for example, tech stocks, crypto, and other leverage plays.
A rise in the DXY could potentially trigger a "Short Squeeze" for foreign countries, companies, and investors that borrow in USD, creating "economic panic" in other countries that get their currency devalued relative to their obligations.
Countries that need USD to service their debt. With the current tariffs, the flow of dollars in the world will change. The question is: what will the effect look like in August when these tariffs start to go live? Like I mentioned before, other countries need the dollars in order to service their debt. If it gets more expensive for US consumers to import (caused by the tariffs), the exporting countries won’t get those dollars—setting it up for a buying cycle that could potentially drive the USD (DXY) higher, even to all-time highs.
Current narrative:
The narrative right now is that the USD will get "worthless," setting the stage to take more risk and use more leverage, maybe without even hedging. A surprise variable to this narrative could be devastating to the financial markets—not just in the US, but even to the world. IF/When this happens, everyone will hunt the USD once again, creating a new bullish narrative for the USD, and everyone will be forced to return to the reserve currency.
Nothing in this post should be considered financial advice. Always do your own research and analysis before investing.

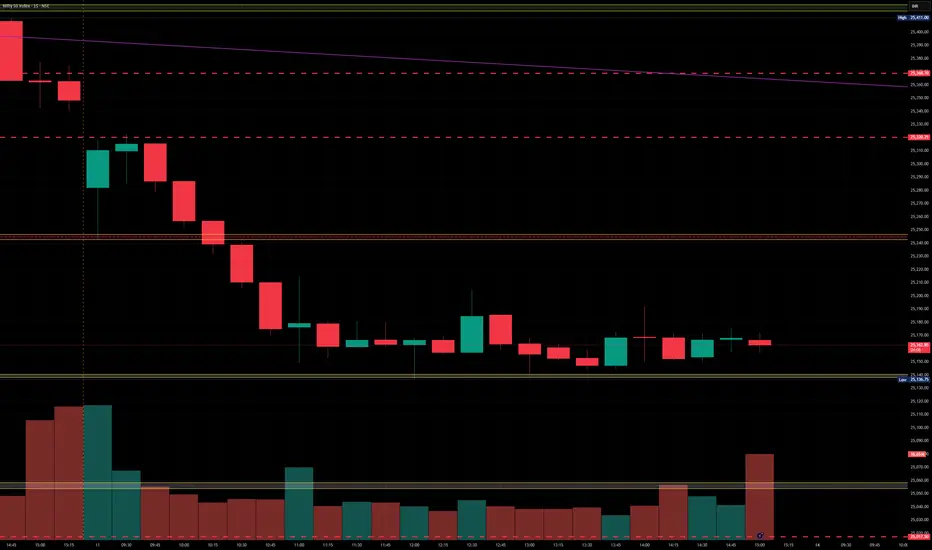
Nifty levels - Jul 14, 2025Nifty support and resistance levels are valuable tools for making informed trading decisions, specifically when combined with the analysis of 5-minute timeframe candlesticks and VWAP. By closely monitoring these levels and observing the price movements within this timeframe, traders can enhance the accuracy of their entry and exit points. It is important to bear in mind that support and resistance levels are not fixed, and they can change over time as market conditions evolve.
The dashed lines on the chart indicate the reaction levels, serving as additional points of significance to consider. Furthermore, take note of the response at the levels of the High, Low, and Close values from the day prior.
We hope you find this information beneficial in your trading endeavors.
* If you found the idea appealing, kindly tap the Boost icon located below the chart. We encourage you to share your thoughts and comments regarding it.
Wishing you success in your trading activities!
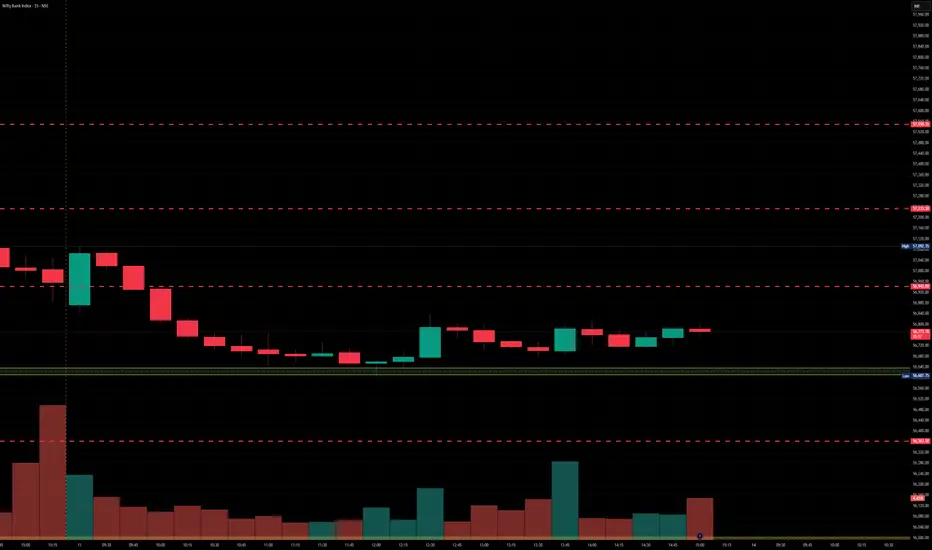
BankNifty levels - Jul 14, 2025Utilizing the support and resistance levels of BankNifty, along with the 5-minute timeframe candlesticks and VWAP, can enhance the precision of trade entries and exits on or near these levels. It is crucial to recognize that these levels are not static, and they undergo alterations as market dynamics evolve.
The dashed lines on the chart indicate the reaction levels, serving as additional points of significance. Furthermore, take note of the response at the levels of the High, Low, and Close values from the day prior.
We trust that this information proves valuable to you.
* If you found the idea appealing, kindly tap the Boost icon located below the chart. We encourage you to share your thoughts and comments regarding it.
Wishing you successful trading endeavors!
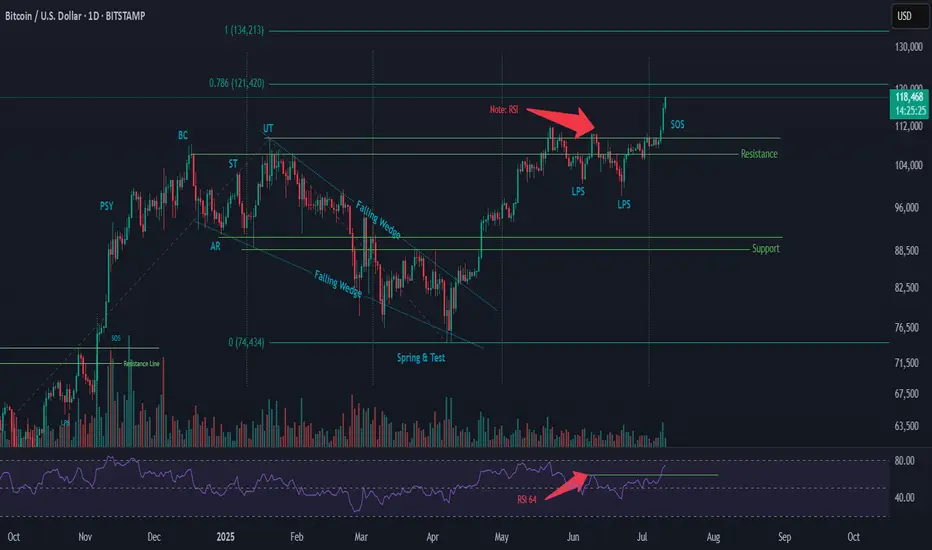
Wyckoff Re-Accumulation (Phase 2) – BTC Market Structure AnalysiThis is an updated outlook on BTC’s current price structure based on Wyckoff methodology.
🔹 Structure Overview:
BTC has broken out above its previous resistance and reached a new ATH. Based on current price action and volume behavior, I believe we are at the Sign of Strength (SOS) phase in a Wyckoff Re-Accumulation Phase 2.
Key Wyckoff Labels in this structure:
PSY – Preliminary Supply
BC – Buying Climax
AR – Automatic Rally
ST – Secondary Test
UT – Upthrust
LPS – Last Point of Support
SOS – Sign of Strength
(For those unfamiliar with the terms, I suggest looking up the Wyckoff Method for detailed definitions.)
The breakout is happening with volume support, and we’ll need to observe how sustained the demand is.
🔹 RSI Observation:
In June, RSI pivoted at 64, and has now reached 73
Both price and RSI are printing higher highs
Daily RSI has not yet reached overbought territory (80+)
If RSI crosses above 80 and then rolls over, it could signal a bearish divergence → followed by a retracement
🔹 Possible Scenarios (3 Outcomes I’m Watching):
📈 Another Re-Accumulation Phase forms after this move
🧊 Market tops out at ATH and enters a Distribution Phase
🚀 A parabolic move (Blow-off Top) happens, followed by a sharp crash and Distribution
🔹 My Personal Trading Plan:
As price enters the next phase, I’ll be watching closely for signs of PSY and BC (Preliminary Supply & Buying Climax). If bearish divergence aligns with these, it may indicate an upcoming retracement.
Once BC forms, I expect an AR (Automatic Reaction) to follow
I’ll look for short entries during the retracement
A Trading Range could form between the BC (resistance) and AR (support)
⚠️ Be cautious of fakeouts, especially during breakout attempts at the range boundaries.
🔹 Price Projection (Fibonacci Extension – For Reference Only):
Using Fibonacci Extension based on the following price coordinates:
Point A: 49,577
Point B: 109,356
Point C: 74,434
🎯 Target Zones:
0.786 extension → 121,420
1.000 extension → 134,213
Again, these are not predictions — just reference points based on market structure.
🔹 Final Note:
This analysis reflects my personal interpretation of the current market structure. Price action can change rapidly based on macro and technical factors. Patterns and phase transitions may take days or even weeks to fully develop.
Feel free to share your thoughts, criticisms, or alternate views — I’m open to feedback from fellow traders.
#Wyckoff #BTC #Bitcoin #CryptoTA #Reaccumulation #TradingPlan #TechnicalAnalysis #RSI #FibExtension #MarketStructure