NQ Power Range Report with FIB Ext - 7/11/2025 SessionCME_MINI:NQU2025
- PR High: 23039.75
- PR Low: 23004.50
- NZ Spread: 78.75
No key scheduled economic events
High 200+ range volatility during Asian hours
Session Open Stats (As of 1:35 AM 7/11)
- Session Open ATR: 301.79
- Volume: 48K
- Open Int: 268K
- Trend Grade: Neutral
- From BA ATH: -0.6% (Rounded)
Key Levels (Rounded - Think of these as ranges)
- Long: 23239
- Mid: 21525
- Short: 20383
Keep in mind this is not speculation or a prediction. Only a report of the Power Range with Fib extensions for target hunting. Do your DD! You determine your risk tolerance. You are fully capable of making your own decisions.
BA: Back Adjusted
BuZ/BeZ: Bull Zone / Bear Zone
NZ: Neutral Zone
Supply and Demand

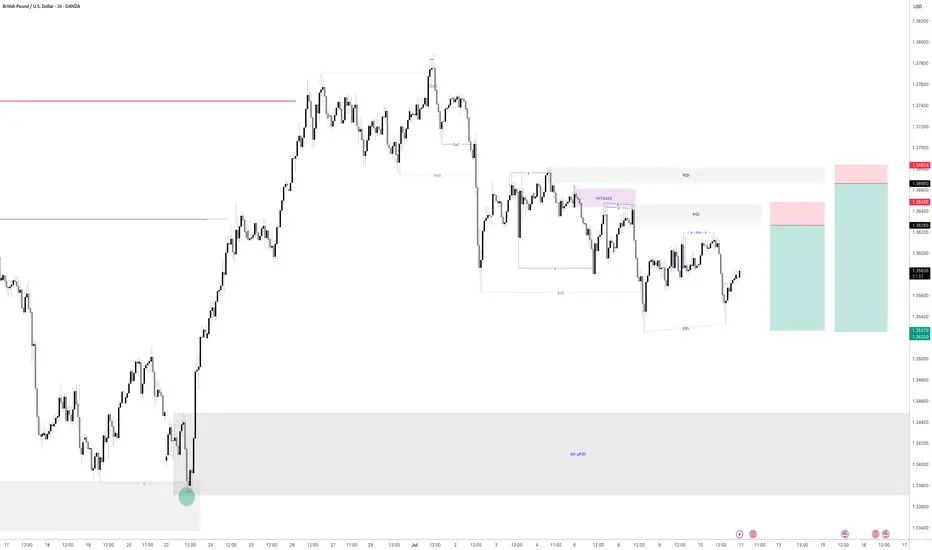
GBPUSD - 1H - 95% PredictionGBPUSD - 1H
Bumping to 5 minutes order block and then dumping to create new lower low.

GBPUSD - 15m - 95% PredictionGBPUSD - 15m
Bumping to 5 minutes order block and then dumping to create new lower low.

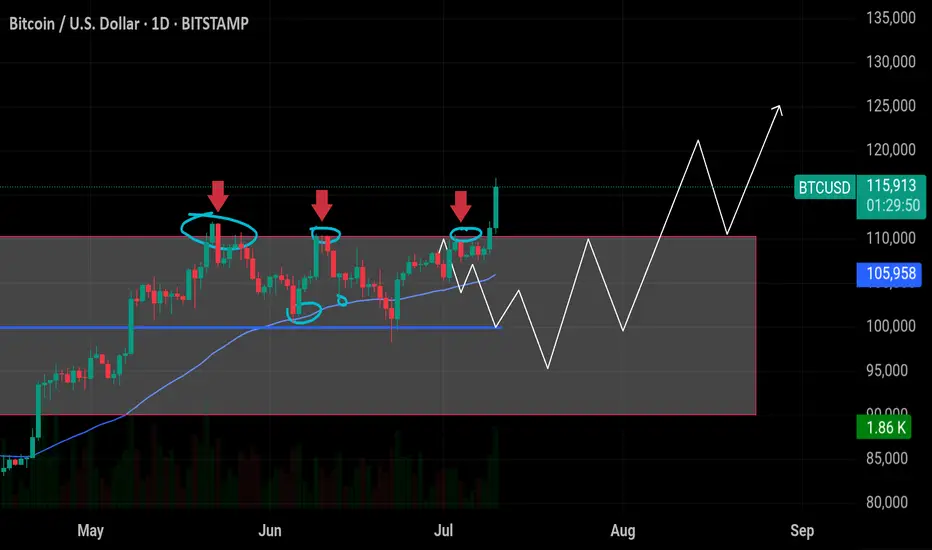
BTC Long / Buy SetupBTC is strongly Bullish towards 120k liquidity level, I'm not seeing any healthy correction before hitting the 120k level. If BTC strongly breaks and closes below 106.9k then chances are high that it will touch the weekly level and again come to 107k level, but this time it will struggle to break the 107k level because it will become bearish fvg, if it holds the 107k level and give any strong reaction from the zone then the next level is 120k. even a wick towards 105k or below doesn't matter, any body closing below the 106.9k (at least 4hrs) will lead short term weakness to the trend.

BTC Intraday SetupWait for the liquidation sweep on any side, then take entry, btc moving in sideways for many days, remember that first breakout will be fakeout on any side.

ETH Long / Buy SetupAs of many times mentioned that, will short eth above 3k or 3k, but it still shows Bullish momentum no sign of weakness, maybe this entry triggers during weekend due too low volume, search for ifvg, if any 1D or 4hr Bullish fvg truns into bearish ifvg then will take short on ETH. For now will take long with SL and proper risk management.

GBPNZD - Look for Long (SWING) 1:3GBPNZD currently shows no signs of reversal, having broken the trendline and heading toward the next supply zone on the higher timeframe. This presents a potential opportunity to go long in line with the prevailing trend, never trade against it. Let’s observe how the price action unfolds.
Disclaimer:
This is simply my personal technical analysis, and you're free to consider it as a reference or disregard it. No obligation! Emphasizing the importance of proper risk management—it can make a significant difference. Wishing you a successful and happy trading experience!

AUD/USD Long Setup – 1H Demand to 4H Supply 🧠 Trade Breakdown:
Price tapped into a clear 1H demand zone and showed bullish reaction. The setup is targeting a 4H supply zone above. This is a classic demand-to-supply flow with room for clean upside.
⸻
📍 Key Confluences:
• Strong 1H demand (reaction zone clearly respected)
• Clear bullish structure: Higher highs + higher lows
• 4H supply zone above as natural target zone
• Momentum supported by clean bullish candles on the way up
• Entry aligns with a pullback to demand zone wick rejection
⸻
📈 Trade Setup:
• Pair: AUD/USD
• Entry: 0.65881
• Stop Loss: 0.65570 (below demand wick)
• Take Profit: 0.66583 (4H supply zone)
• Risk-to-Reward (RR): ~1:6
⸻
🧠 Mindset:
Let this setup breathe — it’s demand into higher timeframe supply. No need to panic on minor retracements. Trust your bias. Let the setup develop. Protect your capital, but don’t micromanage the trade.
“Trade Simple. Live Lavish.”

AUDUSD 60/5 Pullback Short1-hr chart showing bear and now the price is at sell zone. Wait for pull up and short.
RRR could be higher than +2R is the pull up is greater.

TECHNICAL ANALYSISI BTC 1 HR TIME FRAME 📊 Technical Analysis – BTCUSDT.P (1H Chart)
✅ 1. Overall Trend:
The market is in a strong bullish trend on the 1-hour chart, confirmed by multiple CHoCH (Change of Character) and BOS (Break of Structure) points.
📌 2. Price Structure:
🔹 First CHoCH:
Indicates weakness in the prior downtrend.
The following BOS confirms a structure shift to the upside.
🔹 Second CHoCH:
After a minor correction, buyers regained control.
Another BOS confirms continuation of bullish momentum.
🟢 3. Demand Zones:
Multiple demand zones are marked in green.
The most relevant zone right now is between 113,100 – 113,600, still untested.
A bullish reaction is likely if price pulls back into this area.
⚠️ 4. Current Price Action:
Price has reached around 115,487 after the latest BOS.
A minor bearish reaction is visible, suggesting a possible short-term correction.
As long as the BOS level holds, the overall structure remains bullish.
🔍 5. Candlestick Signal:
No clear Engulfing candle yet, but if:
A strong red candle forms followed by a full bullish engulfing candle within the demand zone,
→ that would be a valid Bullish Engulfing pattern and a potential reversal signal.
🎯 Conclusion:
Market structure is currently bullish.
Watch for pullbacks to the 113,100–113,600 zone.
Ideal entries come with confirmation (e.g., engulfing candle or strong rejection).
Always apply strict risk management.
❗️Disclaimer:
This analysis is for educational purposes only and does not constitute financial advice or a buy/sell signal.
Please do your own research and trade based on your personal strategy and risk tolerance.
BITGET:BTCUSDT.P

4 HOUR CONFIRMATION- USDCAD ENTRY UPDATEPrice tapped in our Weekly Demand ideal 👌 for long buys.
Previously i anticipated a trend shift H4 as guide , cmp price just break our int previous high meaning change a in trend as we anticipated
Now waiting for price to drop to our int demand then we rise or the breaker block can hold - major reactions

Gold is in the Bearish DirectionHello Traders
In This Chart GOLD HOURLY Forex Forecast By FOREX PLANET
today Gold analysis 👆
🟢This Chart includes_ (GOLD market update)
🟢What is The Next Opportunity on GOLD Market
🟢how to Enter to the Valid Entry With Assurance Profit
This CHART is For Trader's that Want to Improve Their Technical Analysis Skills and Their Trading By Understanding How To Analyze The Market Using Multiple Timeframes and Understanding The Bigger Picture on the Charts

Gold is in the bullish direction after correcting the supportHello Traders
In This Chart GOLD HOURLY Forex Forecast By FOREX PLANET
today Gold analysis 👆
🟢This Chart includes_ (GOLD market update)
🟢What is The Next Opportunity on GOLD Market
🟢how to Enter to the Valid Entry With Assurance Profit
This CHART is For Trader's that Want to Improve Their Technical Analysis Skills and Their Trading By Understanding How To Analyze The Market Using Multiple Timeframes and Understanding The Bigger Picture on the Charts

GBPUSD is in the Selling DirectionHello Traders
In This Chart GBPUSD HOURLY Forex Forecast By FOREX PLANET
today GBPUSD analysis 👆
🟢This Chart includes_ (GBPUSD market update)
🟢What is The Next Opportunity on GBPUSD Market
🟢how to Enter to the Valid Entry With Assurance Profit
This CHART is For Trader's that Want to Improve Their Technical Analysis Skills and Their Trading By Understanding How To Analyze The Market Using Multiple Timeframes and Understanding The Bigger Picture on the Charts

GBPJPY is in the Down Trend From Resistance LevelHello Traders
In This Chart GBPJPY HOURLY Forex Forecast By FOREX PLANET
today GBPJPY analysis 👆
🟢This Chart includes_ (GBPJPY market update)
🟢What is The Next Opportunity on GBPJPY Market
🟢how to Enter to the Valid Entry With Assurance Profit
This CHART is For Trader's that Want to Improve Their Technical Analysis Skills and Their Trading By Understanding How To Analyze The Market Using Multiple Timeframes and Understanding The Bigger Picture on the Charts

Silver is Again in the Bullish directionHello Traders
In This Chart XAGUSD HOURLY Forex Forecast By FOREX PLANET
today XAGUSD analysis 👆
🟢This Chart includes_ (XAGUSD market update)
🟢What is The Next Opportunity on XAGUSD Market
🟢how to Enter to the Valid Entry With Assurance Profit
This CHART is For Trader's that Want to Improve Their Technical Analysis Skills and Their Trading By Understanding How To Analyze The Market Using Multiple Timeframes and Understanding The Bigger Picture on the Charts

NZDCAD Selling Trading IdeaHello Traders
In This Chart nzdcad HOURLY Forex Forecast By FOREX PLANET
today NZDCAD analysis 👆
🟢This Chart includes_ (NZDCAD market update)
🟢What is The Next Opportunity on NZDCAD Market
🟢how to Enter to the Valid Entry With Assurance Profit
This CHART is For Trader's that Want to Improve Their Technical Analysis Skills and Their Trading By Understanding How To Analyze The Market Using Multiple Timeframes and Understanding The Bigger Picture on the Charts

Gold is in the Bearish direction from a Support levelHello Traders
In This Chart GOLD HOURLY Forex Forecast By FOREX PLANET
today Gold analysis 👆
🟢This Chart includes_ (GOLD market update)
🟢What is The Next Opportunity on GOLD Market
🟢how to Enter to the Valid Entry With Assurance Profit
This CHART is For Trader's that Want to Improve Their Technical Analysis Skills and Their Trading By Understanding How To Analyze The Market Using Multiple Timeframes and Understanding The Bigger Picture on the Charts

GBPJPY is Holding above the SupportHello Traders
In This Chart GBPJPY HOURLY Forex Forecast By FOREX PLANET
today GBPJPY analysis 👆
🟢This Chart includes_ (GBPJPY market update)
🟢What is The Next Opportunity on GBPJPY Market
🟢how to Enter to the Valid Entry With Assurance Profit
This CHART is For Trader's that Want to Improve Their Technical Analysis Skills and Their Trading By Understanding How To Analyze The Market Using Multiple Timeframes and Understanding The Bigger Picture on the Charts

$BTC Breakout Confirmed – Next Stop: $120K? CRYPTOCAP:BTC Breakout Confirmed – Next Stop: $120K?
I told you — if BTC closes above the box, a breakout was imminent… and it just confirmed!
Price has cleanly closed above the $110K resistance zone after multiple rejections — this breakout signals strong bullish momentum. 📈
Next stops: $120K and beyond
Breakout buyers are now in control — as long as BTC stays above $110K.
GBPUSD - 2 Selling opportunitiesLooking at GBPUSD
We have 2 opportunities to get short. Both have a build of liquidity before the areas of supply before them. This means we are looking for the early seller to get into the market before we get in so that all the early seller get stopped out.
As we can see the order flow on this is still bearish. So until the market shows me it want to go higher then we will remain bearish
Keep a close eye on this for tomorrow
USDJPY | Supply zone rejection 💣📉Price ran out internal liquidity, tapped into a refined supply zone, and showed early signs of distribution. Entry taken post-confirmation at the mitigation of the order block, with a clean R:R toward the next demand zone.
🔹 BOS + Liquidity Grab
🔹 Supply Zone Rejection
🔹 Premium Pricing Entry
🔹 Targeting unmitigated demand below (HTF imbalance)
Setup is built around smart money principles—waiting for price to deliver the sell-off. Clean and mechanical.
#SMC #USDJPY #SmartMoney #LiquiditySweep #FXTradingClub #MarketStructure

Bitcoin ATHBINANCE:BTCUSDT This is amazing for crypto community because this level-up all of lover crypto currencies.
Next target: 120.000K
Best for pollback levels: 111.000K & 105.500K
👓We are this time keep calms emotional in buy or sell.
