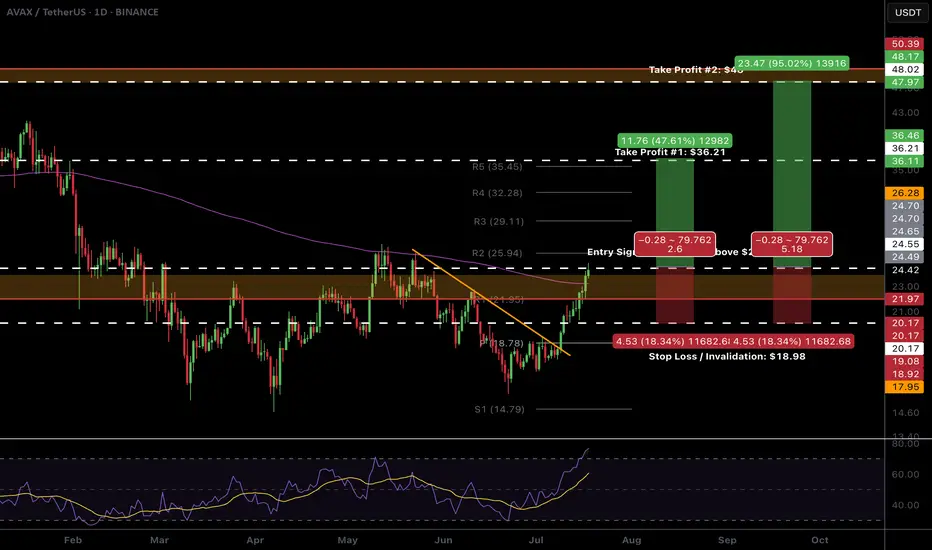
$AVAX Ready to breakout!CRYPTOCAP:AVAX looks ready to pop.
High Volume Node resistance and daily 200EMA is clear and now support. We don't want to see price rejected and moving back below this area.
The R5 daily pivot is my first partial take profit $35-36 followed by the major resistance High Volume Node at $48
Daily RSI is overbought with unconfirmed bearish divergence so watch out for this but should be good to run in the mean time. BTC permitting...
Safe trading
Supply and Demand
SHIBUSDT🕯 The key resistance level, identified as the best resistance for a break and pump, stands at 0.0000135, with a potential price increase to 0.00001567 if breached, serving as the next target (Pullback level). On the support side, the main level is observed at 0.0000115, and should the price fall below this, it may decline further to the lower Major Level of 0.0000100.
🔽 Resistances:
Main resistance level: 0.0000135 (potential break for pump)
Next target (Pullback level): 0.00001567
🔼 Supports:
Main support level: 0.0000115
Lower level (Major Level): 0.0000100
⚠️Contorl Risk management for trades.

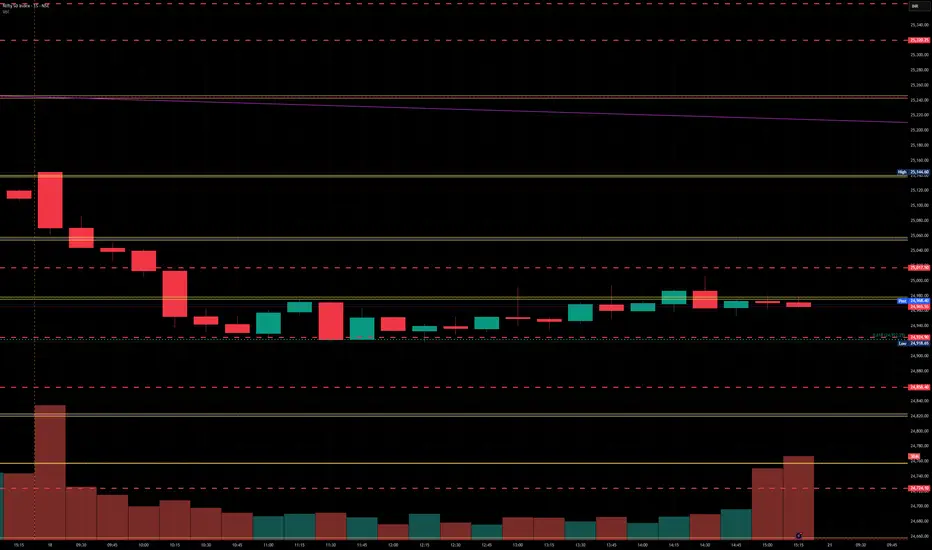
Nifty levels - Jul 21, 2025Nifty support and resistance levels are valuable tools for making informed trading decisions, specifically when combined with the analysis of 5-minute timeframe candlesticks and VWAP. By closely monitoring these levels and observing the price movements within this timeframe, traders can enhance the accuracy of their entry and exit points. It is important to bear in mind that support and resistance levels are not fixed, and they can change over time as market conditions evolve.
The dashed lines on the chart indicate the reaction levels, serving as additional points of significance to consider. Furthermore, take note of the response at the levels of the High, Low, and Close values from the day prior.
We hope you find this information beneficial in your trading endeavors.
* If you found the idea appealing, kindly tap the Boost icon located below the chart. We encourage you to share your thoughts and comments regarding it.
Wishing you success in your trading activities!
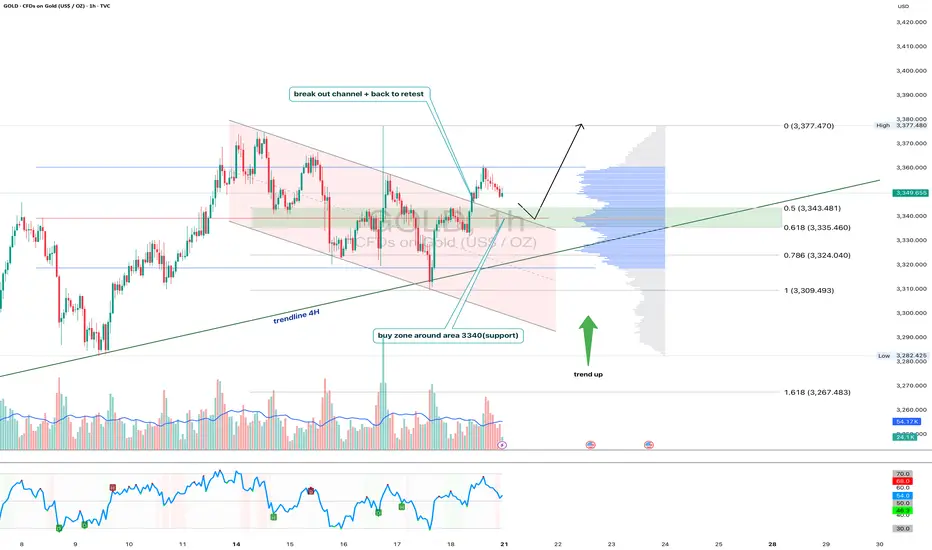
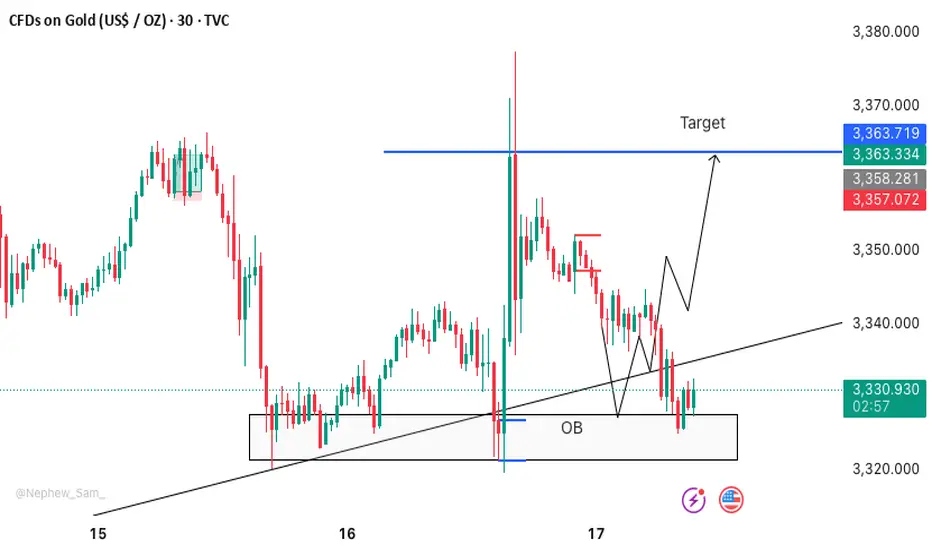
Gold 1H - Retest of channel & support zone at 3340After breaking out of the falling channel, gold is currently retesting its upper boundary — now acting as support. The 3340 zone is particularly important as it aligns with the 0.618 Fibonacci level and high volume node on the visible range volume profile. The price action suggests a potential bullish rejection from this area. With both the 50 and 200 EMA below price on the 1H, the short-term trend remains bullish. The 4H trendline further supports this setup. RSI is cooling off near the neutral zone, leaving room for another leg higher toward the 3377 resistance zone. If 3340 fails, 3324 (0.786 Fibo) becomes the next line of defense. Until then, the structure remains bullish following the successful breakout and retest of the channel.
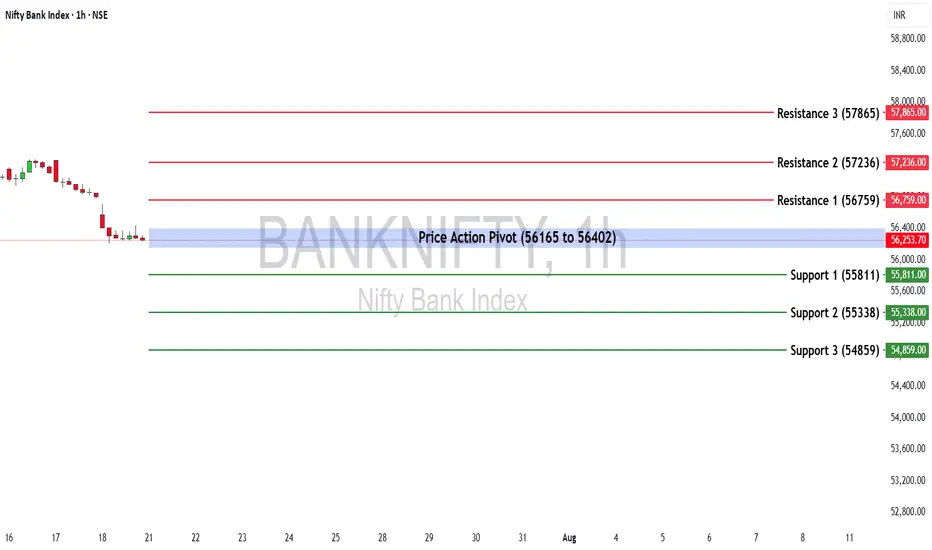
Bank Nifty Weekly Insights: Key Levels & TrendsBank Nifty ended the week at 56,283.00, registering a marginal decline of -0.83%.
🔹 Key Levels for the Upcoming Week
📌 Price Action Pivot Zone:
The critical zone to monitor for potential trend reversals or continuation lies between 56,165 and 56,402.
🔻 Support Levels:
Support 1 (S1): 55,811
Support 2 (S2): 55,338
Support 3 (S3): 54,859
🔺 Resistance Levels:
Resistance 1 (R1): 56,759
Resistance 2 (R2): 57,236
Resistance 3 (R3): 57,865
📈 Market Outlook
✅ Bullish Scenario:
If Bank Nifty sustains above the pivot zone (56,402), it may trigger renewed buying interest, potentially pushing the index toward R1 (56,759) and higher levels like R2 (57,236) and R3 (57,865).
❌ Bearish Scenario:
A breakdown below the lower end of the pivot zone at 56,165 may attract selling pressure, dragging the index towards S1 (55,811) and possibly lower levels like S2 (55,338) and S3 (54,859).
Disclaimer: lnkd.in

XAUUSD M30 BUY SETUP FOR TODAYScenario:
Best buy zone for Gold as of now: 3327–3323 💰
Strong Order Block zone + Double Bottom pattern 📉📈
Let’s ride the 🚀 from here — follow proper risk management! 🛡️📊
BankNifty levels - Jul 21, 2025Utilizing the support and resistance levels of BankNifty, along with the 5-minute timeframe candlesticks and VWAP, can enhance the precision of trade entries and exits on or near these levels. It is crucial to recognize that these levels are not static, and they undergo alterations as market dynamics evolve.
The dashed lines on the chart indicate the reaction levels, serving as additional points of significance. Furthermore, take note of the response at the levels of the High, Low, and Close values from the day prior.
We trust that this information proves valuable to you.
* If you found the idea appealing, kindly tap the Boost icon located below the chart. We encourage you to share your thoughts and comments regarding it.
Wishing you successful trading endeavors!

BONKUSDT: The Meme Coin Ready to Bounce! 📊 Key Stats (Live Update)
- Current Price: $0.000022
- Volume: $1.33M (Accumulation phase)
📈 Critical Levels
- Strong Support: $0.0000192
- Immediate Resistance: $0.000027
- Breakout Target: $0.00004 (+85% upside)
🔥 Why BONK Could Moon
1. Extreme Discount: 92% below ATH ($0.00003275)
2. Meme Coin Rally: WIF +12% today showing sector strength
3. Technical Setup: Bullish divergence forming
🎯 Trading Plan (Updated)
- Ideal Entry: $0.000019-$0.000020 zone 🚀
- Scalp Targets:
→ $0.000025 (+13.2%)
→ $0.000027 (+22.2%)
- Swing Targets:
→ $0.000028 (+40%)
→ $0.000035 (+75%)
- Risk Management:
→ Stop Loss: $0.000018
→ Position Size: 1-3% of portfolio
⚠️ Crucial Notes
1. High volatility expected - set alerts
2. Watch BTC dominance for market direction
3. Smaller exchanges may have price discrepancies
📌 Unique Opportunity
At current levels, BONK offers one of the highest risk/reward ratios in meme coins with:
- 80%+ upside potential to ATH
- Limited downside to strong support
🔍 Live Metrics to Watch
1. 4H RSI: 52 (neutral)
2. Volume Spike: $2M+ needed for breakout
3. Exchange inflows/outflows
---
NOT FINANCE ADVICE | DYOR always 💡 Visual Enhancements
Ready for the BONK resurgence? Would you like me to adjust the entry strategy for more conservative traders? 🐶

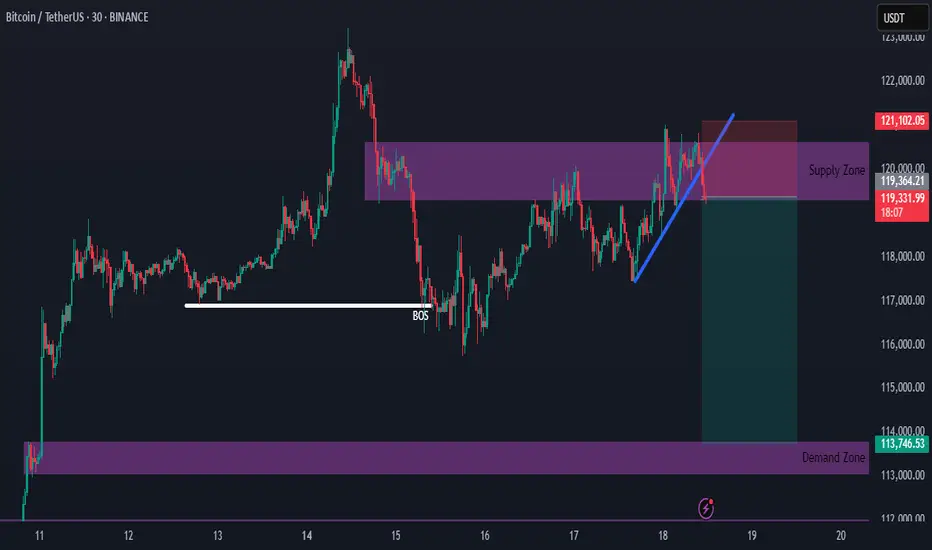
Bitcoin Supply Zone Intact — New Short Setup DevelopingHello everybody!
The supply zone we discussed in the previous idea is still holding.
We have a new opportunity to go short upon the break of the upward trendline.
The most likely target is around 114,000.
eth mini scalp simple trade using order block 15minutes , but its not powerfull ob so maybe can go to our sl , just manage the risk , dyor!


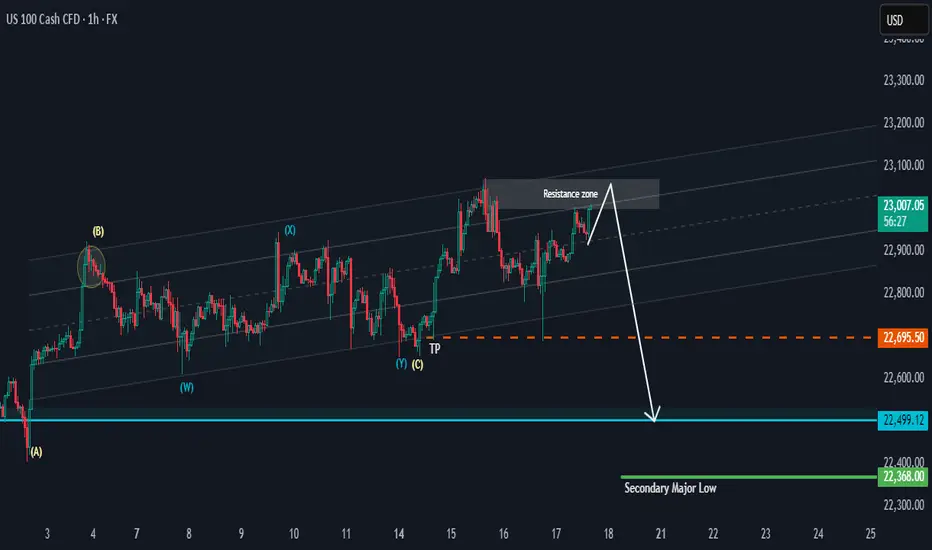
NAS 100 Potential PullbackHi there,
NAS100 has the potential to drop as it keeps testing the resistance zone in the range of 23100. This looks more like bull exhaustion than a reversal. The 22695.50 is the target for a bias of 22499.12
The overall bigger trend is bullish, with price highs aiming as far as 23717.44, 24837.28, and 26222.31, making this a potentially massive bullish trend, and it will take time to reach those highs.
Happy Trading, 🌟
K.
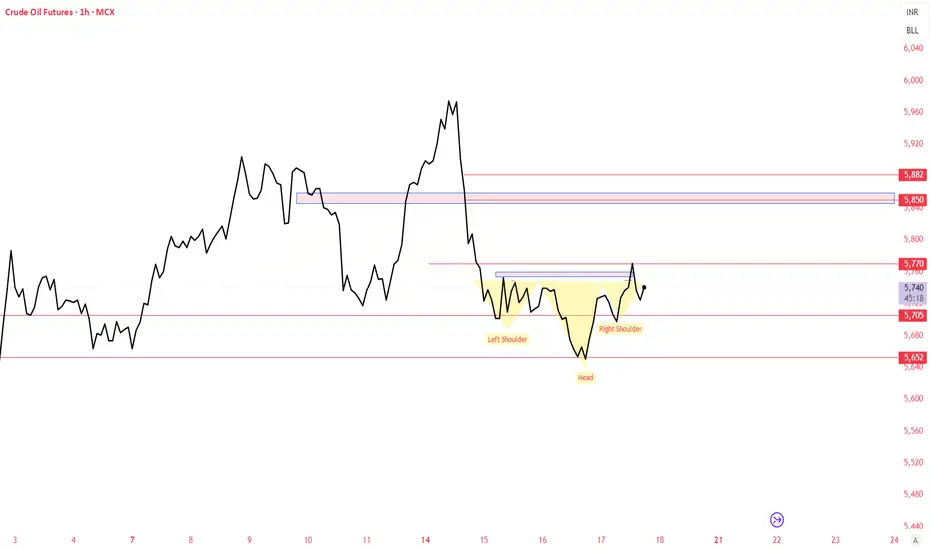
CRUDEOIL - MCX INVERTED HEAD AND SHOULDERCrudeoil on 1 hour time frame forming Inverted head shoulder which is consider as bullish Pattern. Strong Support of 5680 , crudeoil may do 5826-5820-5850
Please do your own research before taking any trading decisions
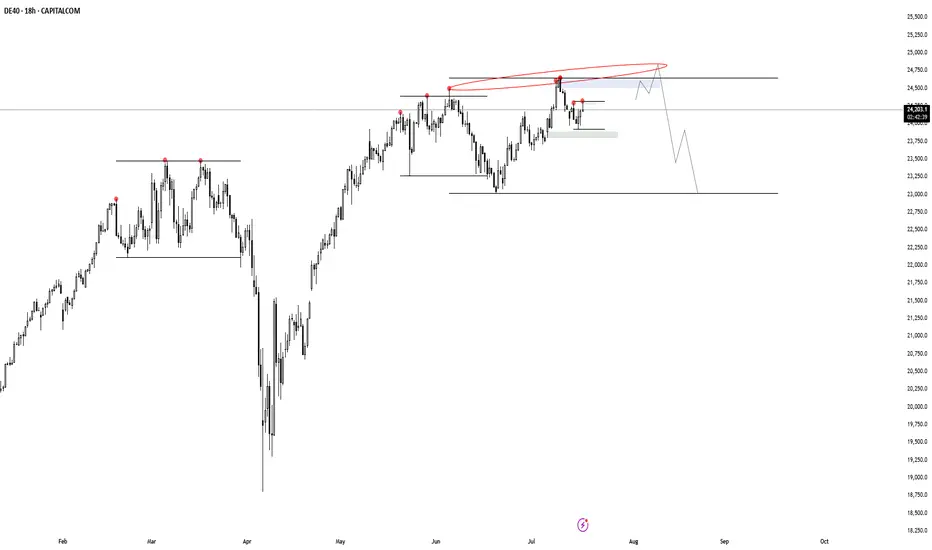
DE40 HTF DistributionI'm watching the DE40 closely here. It's putting in distribution over distribution, which simultaneously leads to the creation of a potential higher time frame distribution model. There are many other indices with a similar behaviour, but this one looks the cleanest so far. I'm waiting for invalidations/confirmations at the POI's.
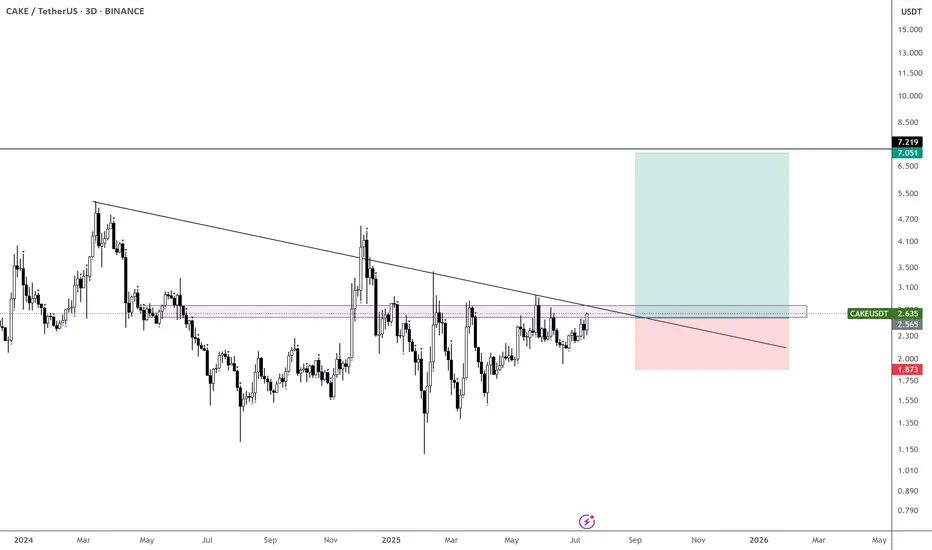
$CAKE is coiling up nicely - Aiming for $7
It hasn’t done much over the past few months, but it’s now above the yearly open and on its 6th attempt to break through the monthly supply zone.
Could this finally be the breakout that leads us toward $7?
Taking bids here and exercising patience.
With CRYPTOCAP:XRP , CRYPTOCAP:ETH , CRYPTOCAP:HBAR , and EURONEXT:ALGO already moving — and possibly CRYPTOCAP:BNB next — this could be a perfect setup for a delayed BINANCE:CAKEUSDT catch-up play.
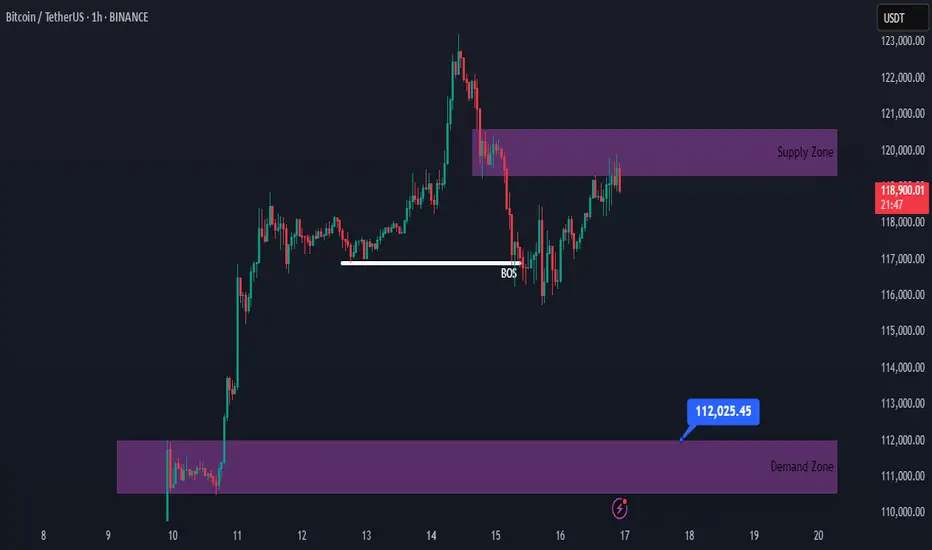
Bitcoin Bullish, but a Correction Might Be AheadHello traders!
Obviously, Bitcoin has a strong bullish momentum.
However, after noticing a minor shift in market structure, we may see a correction toward the 112,000 area.
If the supply area doesn’t break, we can look for a sell position here.
#BTC #Bitcoin
WTI Crude Oil ShortWTI Crude Oil – Technical & Macro Outlook
🔻 1. Supply Zone Rejection Expected (66.50–68.00 Range)
Price is currently approaching a newly established supply zone between $66.50 and $68.00, which coincides with a prior consolidation area that preceded the recent sharp sell-off. This confluence enhances the zone’s relevance, especially given its position just below the 0.5 Fibonacci retracement level (~$69.47), derived from the swing high at $75.79 to the swing low.
📌 Outlook:
This region is expected to act as a high-probability rejection zone, likely attracting institutional sell-side interest. Price action within this zone should be monitored for signs of weakness or distribution.
📉 2. Downside Target: $61.50–$63.00 Demand Cluster
Should the supply zone hold, downside momentum could drive WTI toward the $61.50–$63.00 demand range. This area is technically significant, supported by the following factors:
Previous Change of Character (ChoCH) at $63.49, which marked the beginning of the recent bullish correction and represents a key structural pivot.
Presence of stacked demand zones below $64, increasing the likelihood of a meaningful reaction from buyers.
📌 Outlook:
This zone is expected to attract strong buying interest, making it a short-term profit-taking region for bears and a potential entry point for swing long setups, depending on confirmation.
🌍 Geopolitical Risk Landscape & Supply Dynamics
Recent geopolitical developments continue to influence crude oil pricing dynamics:
Middle East instability (e.g., Iraqi disruptions and ceasefire delays) has led to tightened supply conditions, pushing WTI above $67.
Persistent uncertainty stemming from Iranian nuclear negotiations, ongoing U.S.–China tariff risks, and regional tensions contributes to a sustained risk premium.
While OPEC+ is incrementally increasing production, this is offset by rising Saudi exports and weakening demand forecasts, which may result in inventory builds by late 2025.
Russia’s export resilience—bolstered by strategic redirection toward Asia—suggests that any anticipated supply contraction could be less severe than expected.
🛢 WTI at $62 – Technical and Macro Implications
A decline to $62 would place WTI at a major technical support level, closely watched by institutional participants. If tested, the market could react in the following ways:
Bargain hunting and value-based buying may emerge, especially if macroeconomic data aligns with a recovery narrative.
Heightened volatility is likely, driven by sensitivity to any shifts in global risk sentiment—particularly those tied to trade policy, OPEC+ production surprises, or further geopolitical escalations.
📌 Summary
Resistance: $66.50–$68.00 (pre-breakdown supply + 0.5 Fib)
Support / Target: $61.50–$63.00 (demand + structural ChoCH)
Bias: Short-term bearish toward demand, with high reactivity expected near $62
Risk Factors: Elevated geopolitical uncertainty and diverging supply dynamics across OPEC+, Russia, and the U.S.

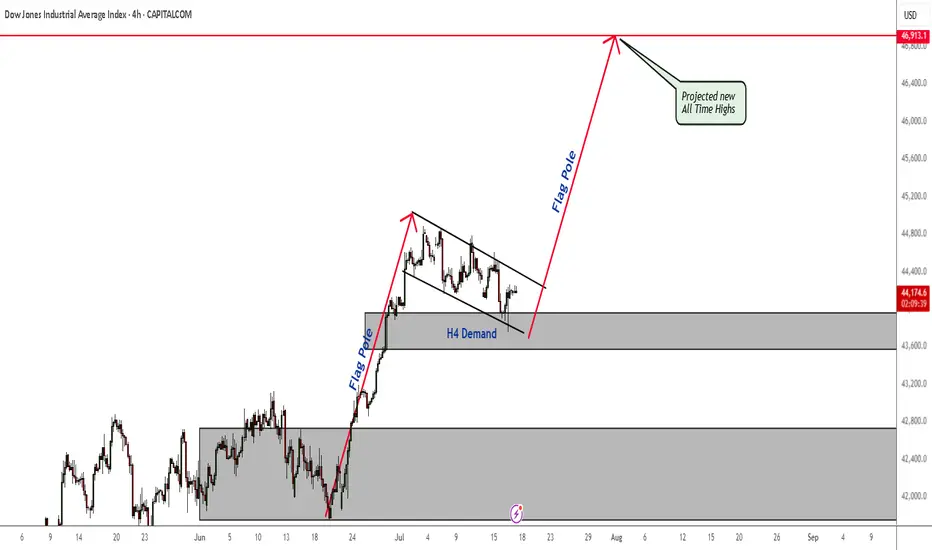
US30 Bullish Flag - All Time Highs The plan for Dow Jones has not changed. Price is still in an H4 demand zone. As soon as price breaks out of this bull flag, nothing will stop the bull run and new All Time Highs being claimed.
Don't miss it.
EURGBP Bear To Bullish Outlook.Hi there,
EURGBP looks bearish at the M30, aiming toward the weekly trendline support targeting the 0.86322 zone area, and we might see a reversal back to the weekly resistance trendline, passing two price targets on the way for a bias of 0.87211 sustained by the overall bullish momentum in the weekly.
Happy Trading,
K.

AUDJPY - POTENTIAL?USDJPY is getting super interesting.
If we can get some bearish intent to try and induce the early sellers to the downside creating some buyside liquidity then i will be all over this for a trade.
Lets see how price has moved by the morning as it does need a bit more development before we can consider entering for a short position

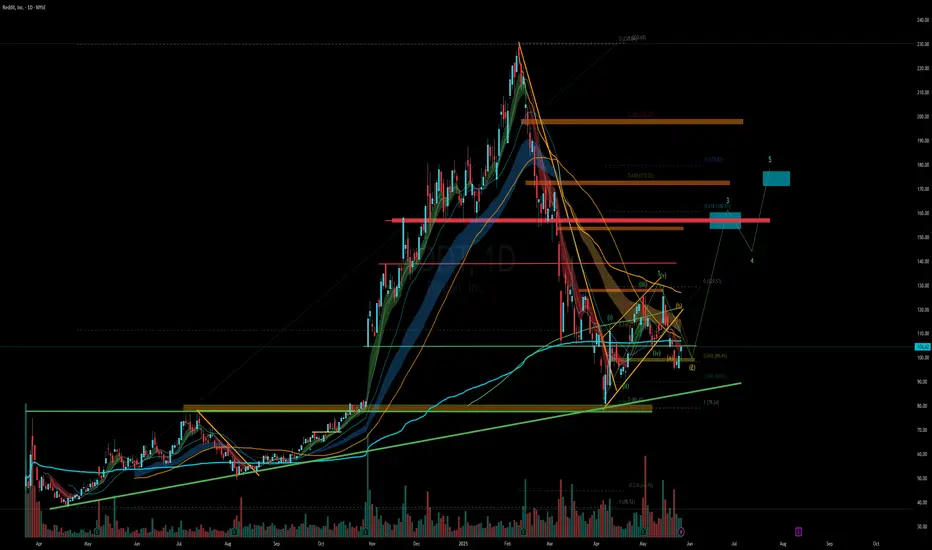
RDDT - Ready for Round 2?RDDT is setting up a base here, let's see if it holds this previous support level around 80.
Target 1 - 160
Target 2 - 180
Stop loss - 75
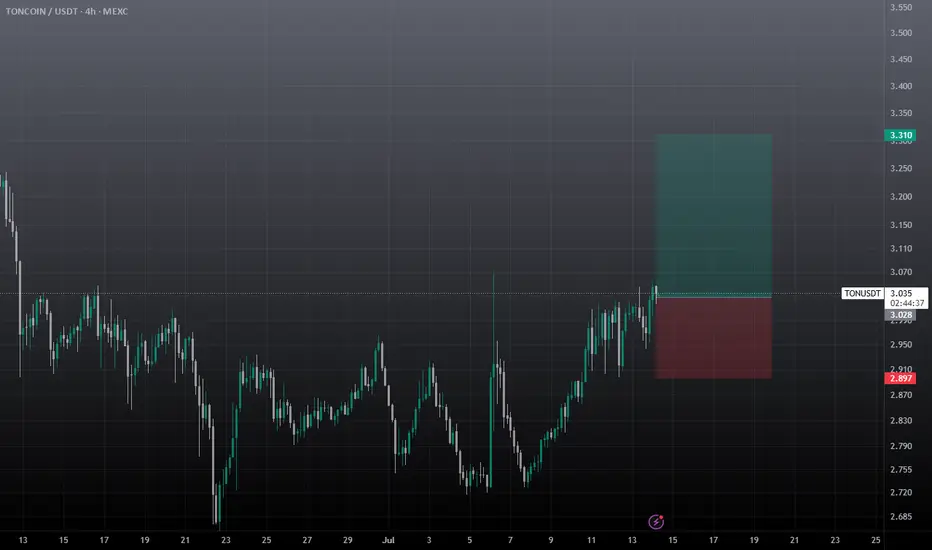
Ton USDT Intraday Setup / Long SetupTake with tight SL, an easy 2RR, take it at cmp (Current Market Price), While if you holding spot bag, it can easily hit 4.5-5$ mark in this week. Best Of Luck