$CLSK Resistance Ready to break?NASDAQ:CLSK is attempting to push above the resistance at $12.4 continuing the path from the recent analysis.
A breakthrough could push it rapidly to the High Volume Node resistance at $18.
Safe trading
Supply and Demand

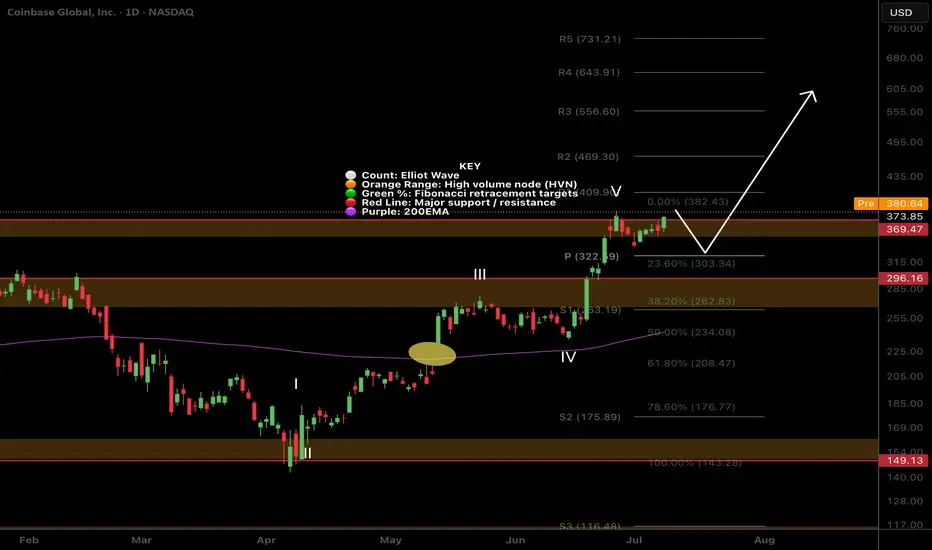
$COIN Price discovery?I was looking for a deeper pullback on NASDAQ:COIN but it appears to be heading into price discovery!
The pivot at $322 was my target but sentiment must be bullish if investors are impatient! Still... i wouldn't count out another sell off as a bear trap on a poke above the swing high.
Safe trading
$ETH clear for an impulsive move to $3600?CRYPTOCAP:ETH has slowly but surely cleared resistance, with just the swing high to tackle which will activate another trade signal in my Trade Signals Substack.
Major support High Volume Node, daily pivot and daily 200 EMA proved tough support and demand continues to come in.
ETFs had an astonishing amount of inflows yesterday at $200M+
Analysis is invalidated below $2100
Safe trading

$HBAR Resistance at daily 200EMA!CRYPTOCAP:HBAR analysis continues to play out but should consolidate for a while before moving to the next target at $0.22.
This area should be tough resistance as its the daily 200EMA and major High Volume Node resistance and R1 daily pivot.
The CRYPTOCAP:HBAR signal has now hit take profit #1 from my Trade Signals Substack posted last week.
Safe trading

$MARA at Resistance!NASDAQ:MARA continues its rally and has come into the High Volume Node resistance target and R2 daily pivot.
Daily 200EMA was tested as support after price smashed through. I expect continuation to the upside $24 target at the R5 daily pivot after some consolidation at this resistance.
Analysis is invalidated way below wave 2 at $13
Safe trading

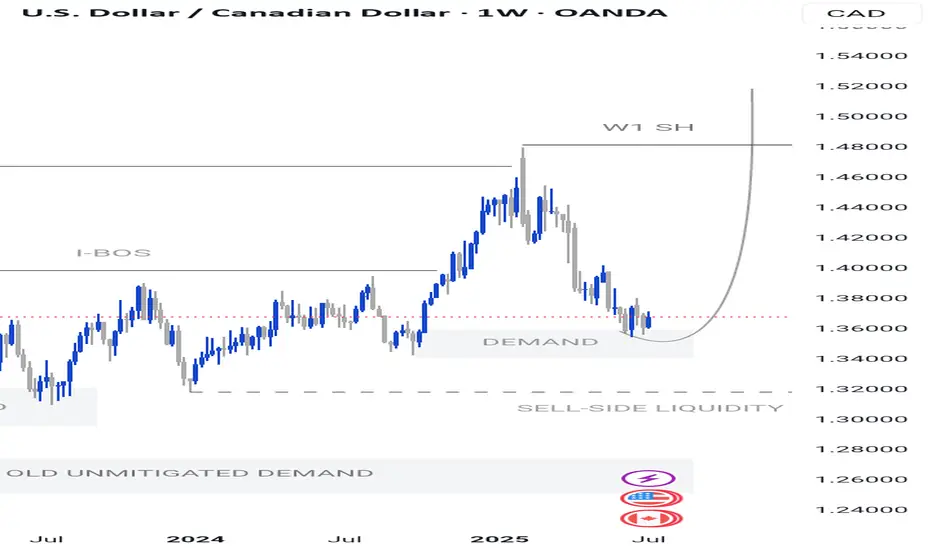
UPDATE - PRICE HAS MITIGATED OUR DEMAND IDEAL FOR LONGSPreviously we were waiting for that retracement or pullback to Weekly Demand ideal for long buys
Now anticipating a trend change - Use H4 for confirmation then we can buy this to the moon.
I will drop the confirmation once confirmed
$MSTR Continues on last weeks path!NASDAQ:MSTR continues to breakout above the channel after a retest as support.
High Volume Node at $440 may proof tough but if price breaks through we could see a strong FOMO induced breakout into price discovery.
Analysis is invalidated below the channel at $358.
Safe Trading

$SUI Big Breakout Happening?CRYPTOCAP:SUI is smashing above triple resistance: a major High Volume Node , daily 200EMA and the daily pivot. The signal I posted in my trading signals Substack is now live, and the HBAR one is about to hit take profit 1.
Target for this rally remains $4.2 High Volume Node near the swing high.
Analysis is invalidated below the daily pivot at $2.8
Safe trading

$XRP Bias Change: Bullish Elliot Wave CountCRYPTOCAP:XRP is breaking out the descending resistance causing me to take another look at my WXYXZ corrective Eliot Wave count expecting lower. I have adjusted the count to WXY and a 1-2 new motif wave with a target of $3.8
Price is well above the daily 200EMA and daily pivot after testing both as support including the High Volume Node. Closing above the descending resistance today will be a bullish signal but a retest of that resistance as support before continuing onwards its what to look out for.
Analysis is invalidated below $1.8
Safe Trading

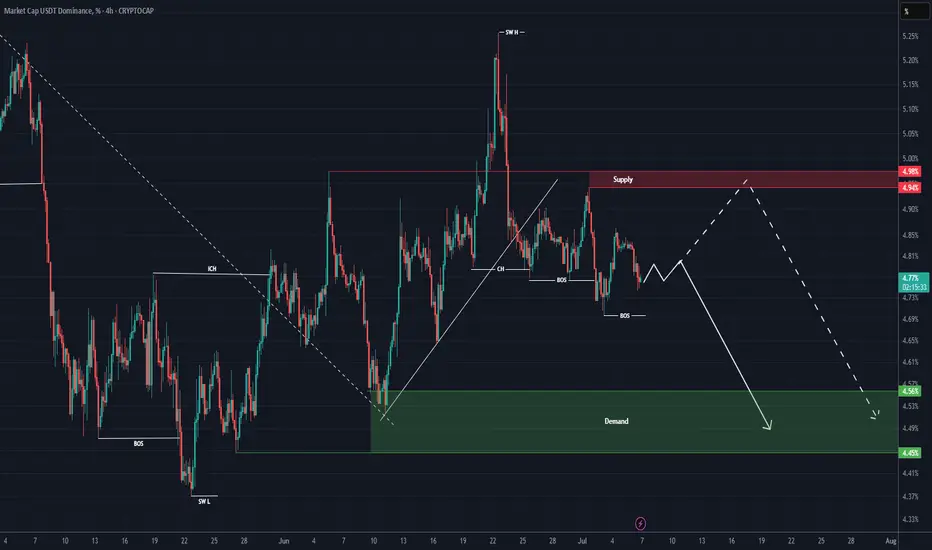
USDT DOMINANCE New Update (4H)By analyzing the chart, it becomes clear that the USDT dominance structure is bearish.
After the structural shift to a downtrend, with lower highs and lower lows forming, it is expected that the price will drop to the main support zone in order to collect major orders from lower levels.
The price could drop from the current level or from the upper supply zone, which would signal a bullish move in the overall market.
The target is the green box.
A daily candle closing above the supply zone would invalidate this analysis.
For risk management, please don't forget stop loss and capital management
Comment if you have any questions
Thank You
#TON Update #3 – July 7, 2025🟣 #TON Update #3 – July 7, 2025
After the recent news-driven spike on TON, I mentioned that I wasn’t looking to buy into the rally. In fact, I warned that a correction was likely. One thing I always keep in mind:
Do not buy what's already pumping.
Right now, TON is going through that correction. As long as it doesn’t break below the 2.720 zone , I believe it could continue forming a mild upward structure.
As shown on the chart, I’ve marked a potential long setup near 2.755 . That’s not a signal to buy as soon as price touches it, it’s a level I’ll reassess if reached. Only if price reacts strongly there would I consider entering.
Until then, TON is not in a favorable area for either long or short entries. I’m just watching for now.

TSLA BUY 253.8Recently, TSLA has maintained a volatile operation. Currently, we can pay attention to the area around 253.8 below, which is a potential buying position for a bullish Gartley pattern. At the same time, this position is within the previous demand area.

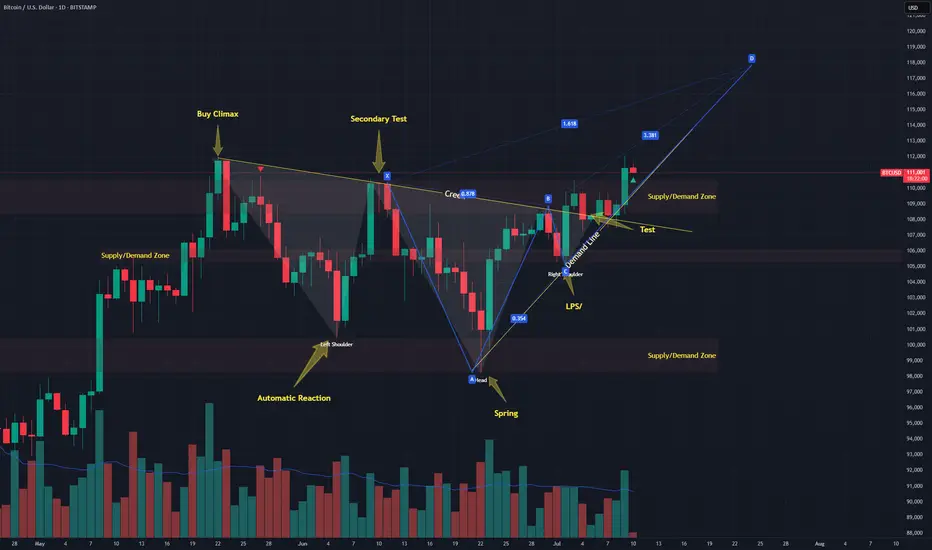
Bitcoin forming a possible deep crabLast week I published a thesis that #Bitcoin might be in a #Wyckoff re-accumulation pattern and we had an ugly ass inverse head and shoulders forming as a part of it.
Well know that test on the creek formed a BC leg of a possible Deep crab. 1.618 is ~117k. Lots of confluence
NQ Power Range Report with FIB Ext - 7/10/2025 SessionNQ Power Range Report with FIB Ext - 7/10/2025 Session
CME_MINI:NQU2025
- PR High: 23065.25
- PR Low: 23033.25
- NZ Spread: 71.5
Key scheduled economic events:
08:30 | Initial Jobless Claims
13:00 | 30-Year Bond Auction
Session Open Stats (As of 12:35 AM 7/10)
- Session Open ATR: 300.61
- Volume: 20K
- Open Int: 270K
- Trend Grade: Neutral
- From BA ATH: -0.4% (Rounded)
Key Levels (Rounded - Think of these as ranges)
- Long: 23239
- Mid: 21525
- Short: 20383
Keep in mind this is not speculation or a prediction. Only a report of the Power Range with Fib extensions for target hunting. Do your DD! You determine your risk tolerance. You are fully capable of making your own decisions.
BA: Back Adjusted
BuZ/BeZ: Bull Zone / Bear Zone
NZ: Neutral Zone

Market Structure Break & Bearish Reaction from Supply Zone.🔍 GOLD – Market Structure Break & Bearish Reaction from Supply Zone
Gold has recently broken its market structure (MSS), which is a significant shift in momentum and a potential indication of a change in the prevailing trend. Following this break, price retraced into a key supply zone, where it was rejected sharply—this rejection came in the form of a strong bearish engulfing candle, highlighting aggressive selling interest.
Interestingly, the market has now printed a second consecutive bearish engulfing from the same zone. This is a powerful signal that sellers are active and defending this level, making it a valid and confirmed short-term resistance zone. The repeated rejection suggests that smart money or institutional sellers may be positioned here.
Given this price action, we can anticipate a potential retracement from the current levels. The most probable downside target for this retracement would be the Fair Value Gap (FVG) that has been marked on the chart. If price respects the FVG and reacts bullishly from there, we may then see a resumption of the uptrend, possibly taking price higher again.
This setup presents a good opportunity for both short-term intraday traders and swing traders to watch for confirmation signals before entering the trade.
📌 Key Takeaways:
MSS indicates shift in trend
Consecutive bearish engulfing candles from supply zone
Sellers likely active in this area
Potential retracement toward marked FVG
Possible bullish continuation from FVG zone
🚨 As always, Do Your Own Research (DYOR) and manage your risk accordingly before making any trading decisions.

Brent Crude Oil Long Setup: Breakout, Retest, and Bullish StructOn the 1-hour timeframe, price formed a tight range after a strong downtrend. Selling pressure weakened, and buyers started stepping in. A bullish engulfing candle broke the range with high volume, signaling accumulation.
Price then retested the breakout with a wick, confirming strength. Since then, we’ve seen higher highs and higher lows — a clear sign buyers are in control and price is ready to move higher.

NKE Pullback-I'm Buying the DipNike (NKE) is under pressure — post-earnings volatility, macro noise, and sentiment all weighing in. But for swing traders, this looks like a textbook accumulation setup.
📌 Entry Zones I’m Targeting:
🔹 $70.00
🔹 $65.00
🔹 $60.00
Profit Targets (Taking wins before 88):
✅ $78.80
✅ $82.50
Let the market come to you — no chasing, just precision.
💬 Drop your thoughts below — are you buying NKE here or waiting for blood?
Disclaimer: This post is for informational and educational purposes only. It does not constitute financial advice or a recommendation to buy or sell any securities. Always do your own research and consult with a licensed financial advisor before making any investment decisions. Trading involves risk, and past performance is not indicative of future results

BTC MTF AccumulationThis is the current accumulation model i am watching to bring BTC back to ATH's and form the second deviation of the HTF distribution model. I would prefer if we could go lower and form a range from there, but at the moment thats all i got.

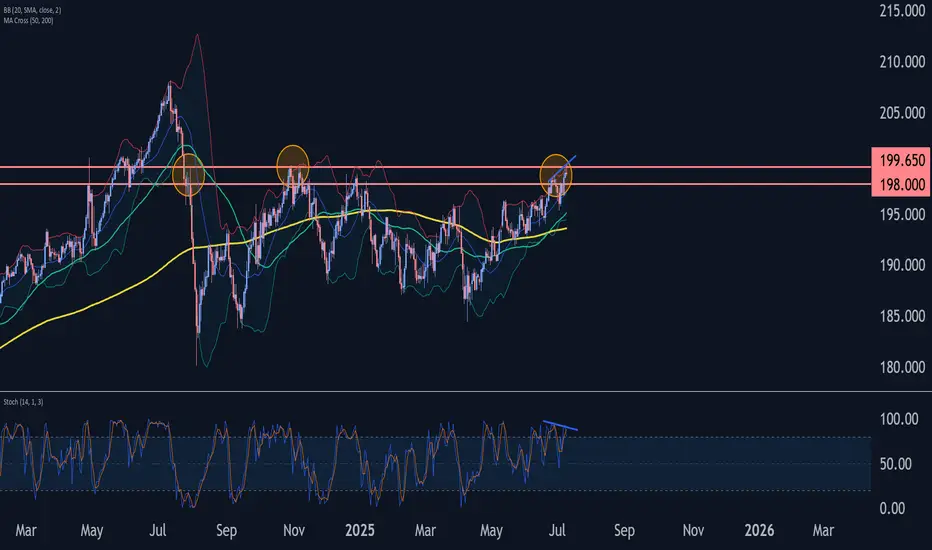
GBPJPY Wave Analysis – 9 July 2025- GBPJPY reversed from long-term resistance level 199.65
- Likely to fall to support level 198.00
GBPJPY currency pair recently reversed from the strong long-term resistance level 199.65 (former strong resistance from October, November and July) standing near the upper daily Bollinger Band.
The downward reversal from the resistance level 199.65 is likely to form the daily Shooting Star reversal pattern.
Given the bearish divergence on the daily Stochastic indicator and the strength of the resistance level 199.65, GBPJPY currency pair can be expected to fall to the next support level 198.00.
Moon artETH moon art. TY. I am just a guy on the internet. If you measure out prior ATH to ATH, it's over a 200% return, top to top. This is assuming business as usual which is not a great predictor

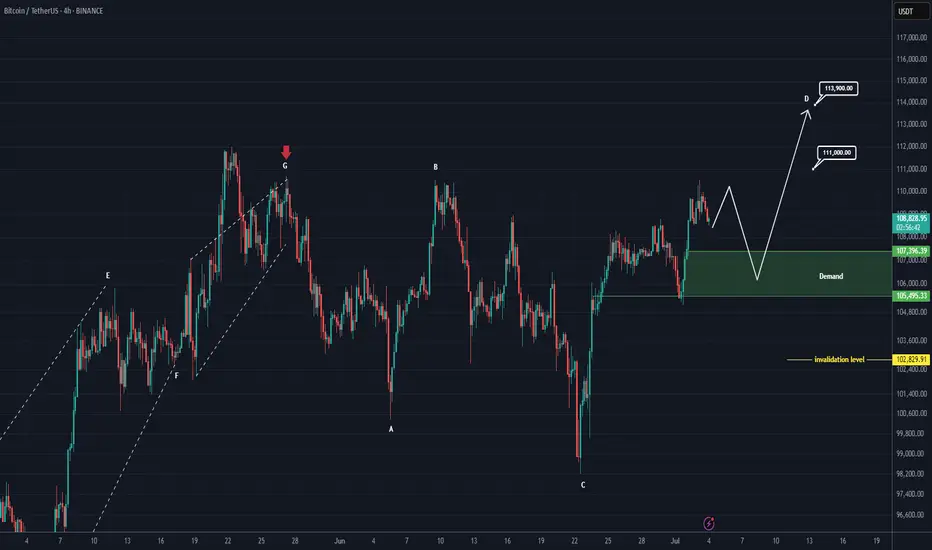
Bitcoin New Update (4H)This analysis is an update of the analysis you see in the "Related publications" section
If we were to publish an update for Bitcoin, wave D could move toward higher levels.
After hitting the green zone and gaining momentum, it could once again move upward to liquidate short positions.
In this update, we've naturally raised and revised the invalidation level.
The new targets have been marked on the chart.
A daily candle closing below the invalidation level would invalidate this analysis.
For risk management, please don't forget stop loss and capital management
Comment if you have any questions
Thank You
Broadcom Ltd Quote | Chart & Forecast SummaryKey Indicators On Trade Set Up In General
1. Push Set Up
2. Range Set Up
3. Break & Retest Set Up
Notes On Session
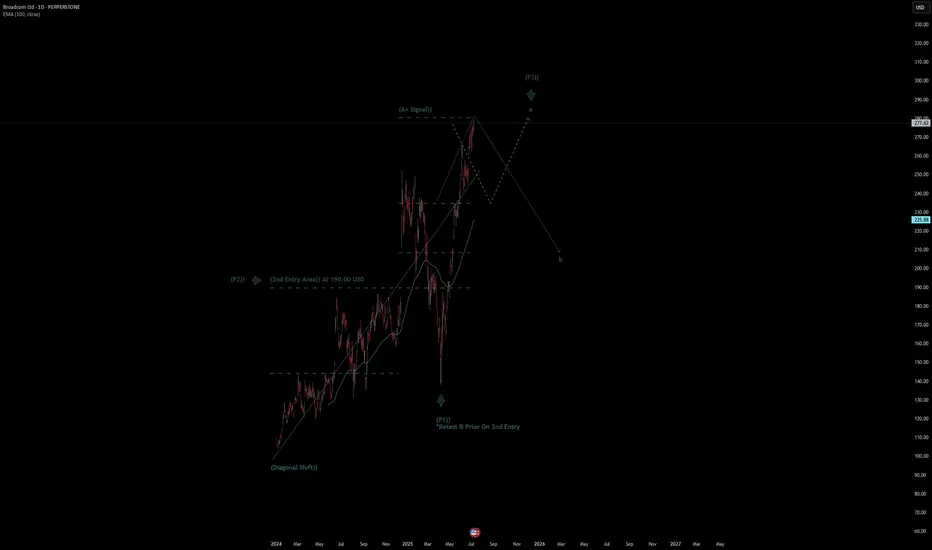
# Broadcom Ltd Quote
- Double Formation
* (Diagonal Shift)) At 95.00 USD | Completed Survey
* (A+ SIgnal)) - *Swing High(Developing) | Subdivision 1
- Triple Formation
* (P1)) / (P2)) & (P3)) | Subdivision 2
* (TP1) = a / Long Consecutive Range
* (TP2) = b / Short Consecutive Pullback | Subdivision 3
* Daily Time Frame | Trend Settings Condition
- (Hypothesis On Entry Bias)) | Regular Settings
- Position On A 1.5RR
* Stop Loss At 242.00 USD
* Entry At 277.00 USD
* Take Profit At 330.00 USD
* (Uptrend Argument)) & No Pattern Confirmation
- Continuation Pattern | Not Valid
- Reversal Pattern | Not Valid
* Ongoing Entry & (Neutral Area))
Active Sessions On Relevant Range & Elemented Probabilities;
European-Session(Upwards) - East Coast-Session(Downwards) - Asian-Session(Ranging)
Conclusion | Trade Plan Execution & Risk Management On Demand;
Overall Consensus | Buy
BTC DOMINANCE Looks Bearish (1D)Bitcoin Dominance seems to have completed its bullish structure.
An order block is forming and has been broken to the downside, a trigger line has been lost, and wave g has come to an end.
If Tether dominance also declines, altcoins may remain in the green.
The 62 level is the target drop zone for this index.
For risk management, please don't forget stop loss and capital management
Comment if you have any questions
Thank You
