#XRP Update #1 – July 8, 2025🟢 #XRP Update #1 – July 8, 2025
XRP has touched the lower edge of its 20-day ascending trendline and is currently holding above the 200 MA, a positive sign technically.
While there is a resistance zone above, it doesn’t appear too strong. Minor selling pressure might emerge around 2.35, but overall the setup looks promising.
▫️ Entry: 2.260
▫️ TP1: 2.320 (50%)
▫️ TP2: 2.390 (50%)
▫️ Stop: 2.235
▫️ RR Ratio: 5.15
❗️ With a tight stop (~1%) and a potential upside of 5.7%, this setup offers a favorable risk-reward opportunity. If it aligns with your capital and risk tolerance, it may be worth considering.
Supply and Demand

Gold’s Bullish Range Holds – Is This the Dip to Buy?With tensions easing in the Middle East and risk appetite moderating, gold has settled into a bullish daily range. The metal recently broke a key high, confirming its upward momentum, but now appears to be consolidating. The central question is whether gold will break lower for a deeper correction or whether this is merely a pause before the next leg higher.
Reduced geopolitical risk has tempered the “risk-on” rally in gold, but the metal remains firmly within a bullish daily range. This indicates that the underlying bid has not disappeared—only short-term speculative flows have adjusted.
Gold recently breached a protected high—likely a higher high or significant resistance level—reinforcing the prevailing bullish momentum. A pullback into imbalance or demand zones is anticipated; however, if a catalyst emerges, price could resume its advance from current levels, with the 0.328 Fibonacci retracement acting as a strong support.
Meanwhile, the DXY is exhibiting signs of a pullback but lacks the fundamental drivers necessary to sustain a broader rally.

EURUSD 60/15 Pullback ShortThe 1hr chart is showing bear. Drop down to 15min, for 2-day is also bear.
I have 2 plans. Plan A is immediate. But if poke through the sell zone, then the outer zone will eventually hit and fall.
Hope New York can bring it down soon.
Set alarm at 1.17321

Bullish time on December this year 2025be ready for a price drop and bearish volume, the chart showing how it keep reject that down trend (green line) I don't think we will break through this time, just be ready for the market tricks.


GBPUSD 15/3 Sell1-hr and 15 are all bear. And it is in a sell zone. Will need to drop down to 3-min to confirm market shift in order to sell to the demand zone.

XAUUSD | Trap Architecture – Retail Burnout!! 🧠 THE REAL GAME – GOLD EDITION (XAUUSD)
This isn’t just a chart — it’s a decoded battlefield between smart money and emotional retail flow.
Every candle you see is backed by narrative and intent — this is not a TA guessing game; it’s Trap Warfare:
⸻
🔍 🎯 Map Breakdown:
1. Liquidity Engineering (Topside):
• 3,364.96 – 3,317.85:
Red zone = Trap Confirmation
Designed as a Retail Long Trigger Zone, disguised as breakout.
• Fake Buy Orders fill
• Retail gets euphoric
• Sellers slam — High RR trap mechanics
• Also doubles as Rejection Zone from previous LH
2. Volume-Free Manipulation Zone:
• “Buy > Sell Manipulation with Volume Fakeouts”
• Emotional entries happen here
• Volumes intentionally low to mislead momentum traders
• Fake Sell Order Wall at top, Fake Buy Order Wall below — both psychological
3. Major Demand Zone (3,246 – 3,257):
• Emotional buyers enter
• SL clustering occurs
• TP1 sits here for shorts
• Smart money fakes support to trap longs before sweeping it again
⸻
💣 3 TP Structure Breakdown:
• TP1 (3,257.85) – Emotional Buy Reaction + First Liquidity Pool
• TP2 (3,214.98) – Liquidity Reaction, Retail SL Triggered
• Bonus TP (3,173.28) – Deep Sweep Zone + Institutional Reload Area
Only valid if Panic Sell Candle + Spread Widening
⸻
🧨 Smart Money Logic Built In:
• Trendline Respect = False Confidence
• Retail SL + Pending Orders = Mapped & Manipulated
• Rejection Zone = Confirmed Burn Trap
• Resting Liquidity Below = Magnet for market makers

Bearish Reversal Zone Approaching🔹 Pair: USDCAD
🔹 Timeframe: H4
🔹 Price: 1.36806
🔹 Bias: Short/SELL Setup Pending
---
💡 Analysis Summary:
USDCAD is approaching a major resistance zone aligned with the 61.8% Fibonacci retracement level from the previous bearish leg.
Structure shows a clear ABC corrective pattern with signs of exhaustion at current levels.
---
📌 Key Levels to Watch:
🔺 Resistance: 1.3720–1.3740 (Potential Reversal Zone)
🔻 Target Zone: 1.3450–1.3500
🔓 Invalidation Above: 1.3760
---
📉 Plan:
Watch for bearish confirmation (e.g., bearish engulfing, double top, divergence) at resistance before entry.
High RR setup expected if price rejects near 1.3740.
---
🔁 Wait. Confirm. Execute.
🧠 Trade smart, not fast.
📊 More updates coming daily.

THE KOG REPORT - UpdateEnd of day update from us here at KOG:
Today was another choppy day on gold with price accumulating in a small range before the break out. We had the bullish above and bearish below level so no choice but to wait for the break. Ultimately, 3320 broke on the 15min indi and then we managed to complete all of our bearish targets for the day. Well worth the wait!
Now we have support below at the 3285 level with resistance sitting at 3310 which is the level that will need to hold us down to target lower. Lower first, which would be ideal, we may get a RIP over the session to come.
RED BOX TARGETS:
Break above 3350 for 3355, 3360, 3362, 3365, 3374, 3388 and 3396 in extension of the move
Break below 3335 for 3331✅, 3324✅, 3321✅, 3310✅, 3306✅ and 3293✅ in extension of the move
Todays levels from Camelot:
Price: 3324
RED BOXES:
Break above 3336 for 3340, 3346, 3350 and 3360 in extension of the move
Break below 3320 for 3310✅, 3306✅, 3304✅ and 3297✅ in extension of the move
As always, trade safe.
KOG

ADA/USDT – Possible ShortADA/USDT – Bearish Reaction from Key Channel Resistance | Short Opportunity
Bias: Short Setup (Counter-Trend)
Cardano (ADA) has reached a significant technical juncture following a strong bullish impulse. Price has tapped into a critical resistance zone marked by:
The upper boundary of a broadening ascending channel
A horizontal liquidity pocket at 0.6195, labeled as “Level 1”
An extended impulsive move without consolidation, suggesting potential overextension
📌 Key Price Levels
Resistance (Short Entry Zone):
Level 1: 0.6195 USDT
Bearish Targets (Take Profits):
TP1: 0.6017 – Local support & minor demand
TP2: 0.5939 – Mid-range value zone
TP3: 0.5842 – Confluence of wedge support & previous demand
The structure resembles a rising broadening wedge, typically a bearish reversal formation, especially after a sharp leg into resistance.
The breakout from the smaller consolidation wedge has now run into major supply, where early short entries may begin to scale in.

SHORT ON GBP/JPYGJ currently has broken a strong low of a rising wedge pattern (which is a bearish reversal pattern.
I am waiting for price to hit the supply zone before entering for a sell.
So a sell limit order will need to placed at the supply zone to take advantage of this opportunity.

XRP: Ripple Ready to Unleash a Tsunami?Ripple (XRP) is coiling like a spring—ready to explode. After five clean re-tests of a powerful demand zone, buyers have repeatedly stepped in to defend key levels, launching 40–75% swings each time. Is this the moment it unleashes the wave?
🔍 Technical Breakdown:
✅ Demand Zone Strength
XRP is bouncing from a long-tested demand zone (5+ re-tests). Each bounce led to substantial upside momentum.
✅ Bull Flag Retest
XRP previously broke out of a large bull flag and has been holding the flag’s top trendline for over 40 days—acting as strong support.
✅ Higher Low Structure
Price formed a higher low (H/L) and has climbed steadily for two weeks—building bullish structure.
✅ Volume Profile
Price reclaimed ground above the high-volume node, signaling accumulation strength.
✅ Market Cipher B Divergence
A weekly hidden bullish divergence is present—not massive, but notable—hinting at momentum shift.
⚠️ What to Watch:
Volume is key: Current consolidation shows a decline in volume—a surge could ignite the breakout.
Confirmation for conservative traders: Wait for a break and hold above $2.33 with volume, or a retest of that level.
If past demand zone reactions repeat, a breakout could be imminent.
What do you think?
📈 As always—this is not financial advice. Do your own research.
🧭 Happy Hunting!

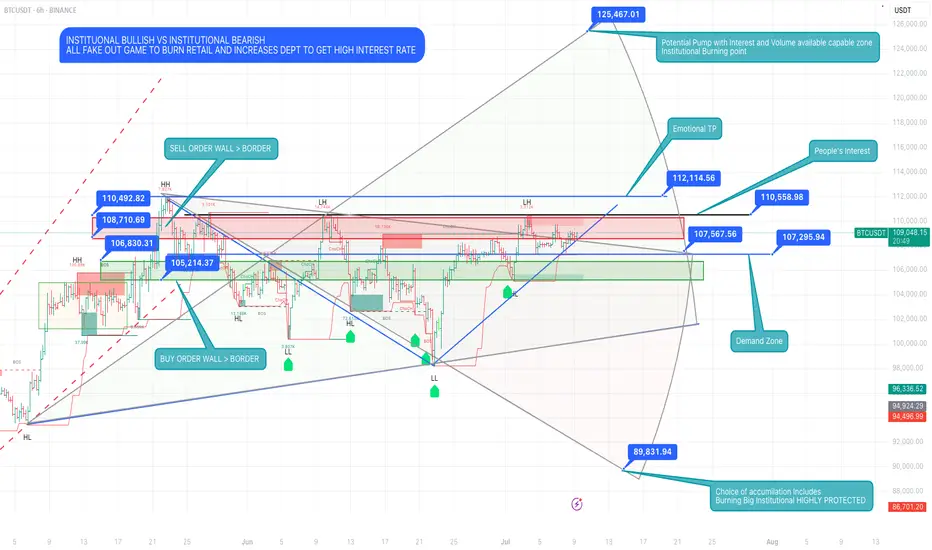
The Whale’s Blueprint: Read It Before It Happens🧠 The Real Game
Institutional Bullish vs Institutional Bearish — It Was Never About Direction.
This chart isn’t about setups.
It’s a blueprint of manipulation, a battlefield map where:
• Retail gets trapped at emotional highs
• Liquidity gets swept in layers
• Institutions reload in silence
• And the price becomes the puppet, not the player
🔺 Top Red Zones (106K–112K):
These aren’t resistance. They’re execution zones for sell walls, fake breakouts, and late long liquidations.
🔻 Green Demand Zones (105K & Below):
Not support. They’re reaction chambers — where whales absorb panic and retail exits in fear.
💥 125K is not a fantasy. It’s a controlled explosion waiting to happen —
But only if the trap is set right and the fuel (volume + interest) loads in.
🧱 Real accumulation doesn’t happen in comfort.
It happens in the shadows, at the edges of fear.
This isn’t price action.
This is power action.
⸻
“Most trade the surface.
Snipers wait beneath it…
and strike before the story reveals itself.”
#BTCUSDT #LiquidityGame #WhaleTrap #InstitutionalZones #SniperMindset #KaizenMethod #TheRealGame
CADJPY Bullish SetupHi
CADJPY has the potential to rise above 107.450, targeting two price areas of 108.056 and 108.934 for a bias of 109.688
If the price breaks active demand (dx) and falls below 105.952, then that will signal a trend reversal.
Happy Trading,
Not trading advice
Khiwe

What is Dynamic Support and Resistance Levels & Zones in Forex
Dynamic supports and resistances play a crucial role in technical analysis.
Unlike classic supports and resistances, these zones change and adapt to a market price action in real time.
Learn what is dynamic support and resistance in Forex, Gold trading and how to find it easily.
Discover its main types and real market examples.
Let's start with the basics.
There are 2 major types of supports and resistances in technical analysis.
The first type is called static .
Such supports and resistances are fixed and don't change with time.
It should be strictly horizontal key levels or the zones.
Market price action and momentum beyond them do not affect these supports and resistances.
In the example above, you can find static supports and resistances on Gold. The market may return to one of those levels or the zones today, tomorrow or in a month, but it will not move.
In comparison to static supports and resistances, the dynamic ones shift with time. They constantly change and adjust as the time flies.
One of the obvious types of dynamic supports and resistances is a trend line.
Above is the example of a dynamic rising support based on trend line.
As the time goes, a support shifts and becomes higher and higher.
I found a great example of a dynamic resistance on Dollar Index.
Depending on the moment when the price tests that, the resistance will be on different levels.
The later the price tests the trend line, the lower is the resistance.
When newbie traders learn dynamic supports and resistances, they usually stop on trend lines.
But it is just a beginning.
Really significant dynamic supports are resistances will be the zones .
The areas based on static horizontal supports and resistances and trend lines.
Examine a price action on GBPCHF forex pair.
We have a static horizontal support area and a dynamic rising trend line.
Two supports intersect, composing a contracting dynamic support zone.
With time, it will become narrower, accumulating buy orders within.
On NZDCAD forex pair, I underlined a contracting dynamic resistance zone that is based on an intersection of a static horizontal resistance area and a falling trend line.
Selling orders will be distributed within.
The 2 dynamic support and resistance zones that we discussed are narrowing , but that is not always the case.
A dynamic support zone that I found on GBPNZD is expanding and broaden with time.
It is based on a dynamic falling trend line and a static horizontal support.
With time its boundaries will be wider and a bullish reaction may initiate from any level within that.
A dynamic resistance area that I spotted on EURCAD forex pair is a great example of an expanding resistance.
It is based on a static horizontal resistance and a rising trend line.
We can easily recognize how it grows with time.
Of course, another types of dynamic supports and resistances exist. But they are more nuanced and rare.
As soon as you learn to recognize the clusters that we discussed in this article, you will be able to recognize the less obvious ones as well.
Next time, when you execute a support and resistance analysis, try to find a dynamic zone. You can find it on any time frame, and forex pair and gold, and it will completely change your perspective on the market.
❤️Please, support my work with like, thank you!❤️
I am part of Trade Nation's Influencer program and receive a monthly fee for using their TradingView charts in my analysis.

BankNifty levels - Jul 10, 2025Utilizing the support and resistance levels of BankNifty, along with the 5-minute timeframe candlesticks and VWAP, can enhance the precision of trade entries and exits on or near these levels. It is crucial to recognize that these levels are not static, and they undergo alterations as market dynamics evolve.
The dashed lines on the chart indicate the reaction levels, serving as additional points of significance. Furthermore, take note of the response at the levels of the High, Low, and Close values from the day prior.
We trust that this information proves valuable to you.
* If you found the idea appealing, kindly tap the Boost icon located below the chart. We encourage you to share your thoughts and comments regarding it.
Wishing you successful trading endeavors!

Nifty levels - Jul 10, 2025Nifty support and resistance levels are valuable tools for making informed trading decisions, specifically when combined with the analysis of 5-minute timeframe candlesticks and VWAP. By closely monitoring these levels and observing the price movements within this timeframe, traders can enhance the accuracy of their entry and exit points. It is important to bear in mind that support and resistance levels are not fixed, and they can change over time as market conditions evolve.
The dashed lines on the chart indicate the reaction levels, serving as additional points of significance to consider. Furthermore, take note of the response at the levels of the High, Low, and Close values from the day prior.
We hope you find this information beneficial in your trading endeavors.
* If you found the idea appealing, kindly tap the Boost icon located below the chart. We encourage you to share your thoughts and comments regarding it.
Wishing you success in your trading activities!

XAUUSD INSIGHTXauusd , price is in descending contracting triangle channelling as shown in the given chart.
We will let the price to break of the channel then we decide our bias for entry.
Keep checking the channel for more update and signals.
If any query do contact me directly 🙏
MES Futures – ORB Strategy Long from London Open Range BreakDescription:
Executed a clean ORB long trade on MES during the London session, with confirmation from the 5-min chart and structure mapped on the 15-min.
Setup Breakdown:
Session: London Open
Strategy: Opening Range Breakout (ORB)
Entry: Break of ORB high with confluence from 15-min demand zone + EMA support
Stop: Below session low and structural demand
Target: Previous session high & key 1HR supply zone
T echnical Context:
Price rejected from previous session low and formed a clear ORB range.
After consolidation, a strong bullish candle broke above the range high with increasing volume and EMA cross.
Trade was managed up to the previous session high and partials secured before price met the diagonal resistance trend line.
Key Zones:
✅ Entry Zone: 6270.00
🟥 Stop Loss: ~6260.25
🎯 Target Area: 6287.75 (Previous Session High)
🟥 15-min Supply overhead could pose resistance
Staakd Rating: ★★★★☆
(Rated 4/5 for textbook ORB play, clean risk:reward, and structure alignment)

GBPUSD BUY TRADEBuy Opportunity on GBPUSD
ENTRY: 1.35900
STOPLOSS: 1.35600
TAKEPROFIT: 1.37000
OUR FUND MANAGEMENT SYSTEM
We only manage (trade) clients fund. It's the responsibility of clients to deposit into their trading account with their preferred broker.
Your Minimum capital must be $100
COMMENT YOUR OPINION
Contact me on X @shajudeakinoba1

POPCAT/USDT – Tight Range = Engineered Liquidity Grab IncomingPOPCAT is currently consolidating in an unusually tight daily range, with candles compressing into a low-volatility coil. When structure becomes this tight, it often signals that market makers are engineering stop hunts—setting the stage for a larger move.
Thesis:
The current range is likely to break with a local liquidity sweep to the downside, followed by a bullish continuation in alignment with:
The macro HTF trend, which remains bullish
Ongoing Bitcoin dominance, which has a strong influence on meme-cap altcoins like POPCAT
This play anticipates the stop-loss liquidity below the range to be grabbed, triggering momentum to the upside once weak hands are flushed.
Setup Summary:
Price compression = manipulation phase
Looking for a sweep of recent lows (range bottom)
Entry after confirmation of trap / bullish reclaim
Target: $0.64+ range highs
Invalidation: Break and acceptance below the red zone
Key Point:
Tight ranges = traps being set. Be patient, let the sweep happen, and position with trend.
XAU/USD 09 July 2025 Intraday AnalysisH4 Analysis:
-> Swing: Bullish.
-> Internal: Bullish.
You will note that price has targeted weak internal high on two separate occasions forming a double top which is a bearish reversal pattern. This is in-line with HTF bearish pullback phase.
Remainder of analysis and bias remains the same as analysis dated 23 April 2025.
Price has now printed a bearish CHoCH according to my analysis yesterday.
Price is now trading within an established internal range.
Intraday Expectation:
Price to trade down to either discount of internal 50% EQ, or H4 demand zone before targeting weak internal high priced at 3,500.200.
Note:
The Federal Reserve’s sustained dovish stance, coupled with ongoing geopolitical uncertainties, is likely to prolong heightened volatility in the gold market. Given this elevated risk environment, traders should exercise caution and recalibrate risk management strategies to navigate potential price fluctuations effectively.
Additionally, gold pricing remains sensitive to broader macroeconomic developments, including policy decisions under President Trump. Shifts in geopolitical strategy and economic directives could further amplify uncertainty, contributing to market repricing dynamics.
H4 Chart:
M15 Analysis:
-> Swing: Bullish.
-> Internal: Bullish.
H4 Timeframe - Price has failed to target weak internal high, therefore, it would not be unrealistic if price printed a bearish iBOS.
The remainder of my analysis shall remain the same as analysis dated 13 June 2025, apart from target price.
As per my analysis dated 22 May 2025 whereby I mentioned price can be seen to be reacting at discount of 50% EQ on H4 timeframe, therefore, it is a viable alternative that price could potentially print a bullish iBOS on M15 timeframe despite internal structure being bearish.
Price has printed a bullish iBOS followed by a bearish CHoCH, which indicates, but does not confirm, bearish pullback phase initiation. I will however continue to monitor, with respect to depth of pullback.
Intraday Expectation:
Price to continue bearish, react at either M15 supply zone, or discount of 50% internal EQ before targeting weak internal high priced at 3,451.375.
Note:
Gold remains highly volatile amid the Federal Reserve's continued dovish stance, persistent and escalating geopolitical uncertainties. Traders should implement robust risk management strategies and remain vigilant, as price swings may become more pronounced in this elevated volatility environment.
Additionally, President Trump’s recent tariff announcements are expected to further amplify market turbulence, potentially triggering sharp price fluctuations and whipsaws.
M15 Chart:

$SUI Gearing Up to Break Triple Resistance?CRYPTOCAP:SUI is consolidating under resistance which often leads to a breakthrough but can take some time.
Price is sat above the daily pivot after breaking the downward trend resistance, but still under the daily 200 EMA and High Volume Node resistance. A pop above $3.09 swing high would be a bullish signal to long towards a first target of $4.2 High Volume Node.
Analysis is invalidated with a move below $2.7, leaving heavy resistance still ahead.
Safe trading
