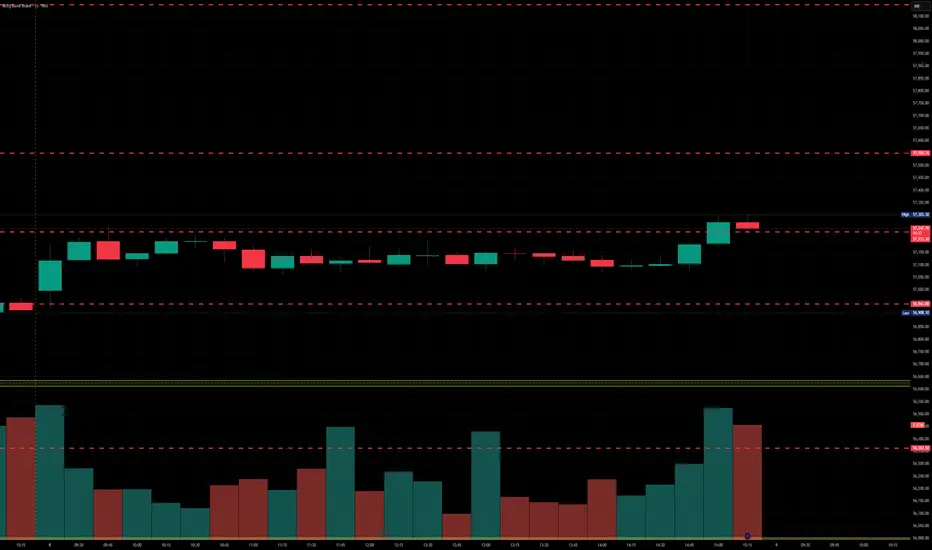
BankNifty levels - Jul 09, 2025Utilizing the support and resistance levels of BankNifty, along with the 5-minute timeframe candlesticks and VWAP, can enhance the precision of trade entries and exits on or near these levels. It is crucial to recognize that these levels are not static, and they undergo alterations as market dynamics evolve.
The dashed lines on the chart indicate the reaction levels, serving as additional points of significance. Furthermore, take note of the response at the levels of the High, Low, and Close values from the day prior.
We trust that this information proves valuable to you.
* If you found the idea appealing, kindly tap the Boost icon located below the chart. We encourage you to share your thoughts and comments regarding it.
Wishing you successful trading endeavors!
Supply and Demand
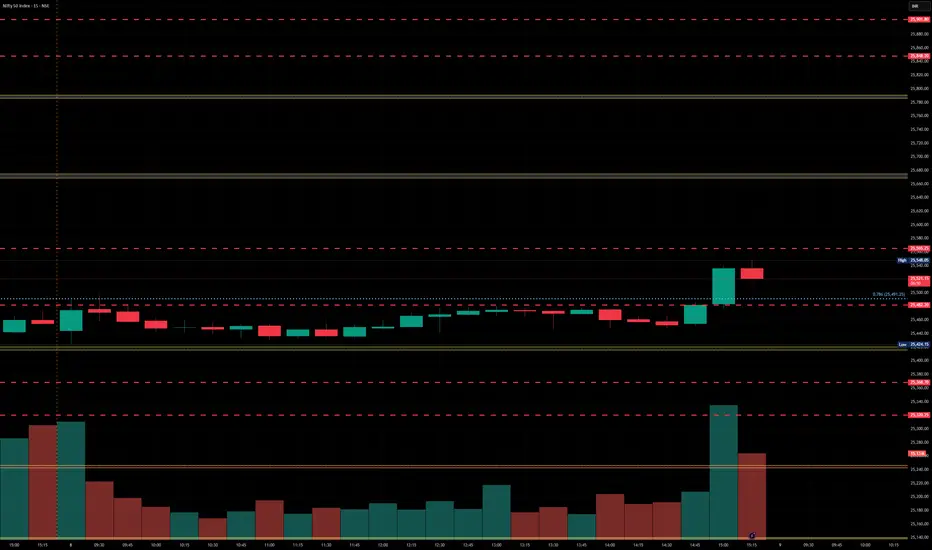
Nifty levels - Jul 09, 2025Nifty support and resistance levels are valuable tools for making informed trading decisions, specifically when combined with the analysis of 5-minute timeframe candlesticks and VWAP. By closely monitoring these levels and observing the price movements within this timeframe, traders can enhance the accuracy of their entry and exit points. It is important to bear in mind that support and resistance levels are not fixed, and they can change over time as market conditions evolve.
The dashed lines on the chart indicate the reaction levels, serving as additional points of significance to consider. Furthermore, take note of the response at the levels of the High, Low, and Close values from the day prior.
We hope you find this information beneficial in your trading endeavors.
* If you found the idea appealing, kindly tap the Boost icon located below the chart. We encourage you to share your thoughts and comments regarding it.
Wishing you success in your trading activities!
GBPCAD: Bullish Continuation Ahead?! 🇬🇧🇨🇦
One of the pairs that we discussed on the today's live stream
is GBPCAD.
The price nicely respected a key daily/intraday horizontal support.
A double bottom pattern on that and a bullish violation of its neckline
provide strong bullish confirmations.
I expect up move to 1.8666
❤️Please, support my work with like, thank you!❤️
I am part of Trade Nation's Influencer program and receive a monthly fee for using their TradingView charts in my analysis.

Bulls buyNB: Overall trend is still sells as we have a resistance line for sell area. Currently we ride the buys as its forming a flag. Any break bellow the flag resistance line indicate end of the flag hence we enter sells.
Trade cautiously

NAS100 sell setup15 min supply zone engineering during market open yesterday will be the key trigger for todays sell off

BTC SCALP TRADE / Long Setupwait for the entry, must use SL. If final tp is achieved then trade is not valid, active till final tp. Must use proper risk management. Expecting upside move. If SL hit then take previous trade, It's still valid.

GBPUSD swing sell GBPUSD brexit was never a good idea, it looks bullish, many will have that bias and if you look carefully tapped into 4h supply multiple times, and its due for a correction

The Unicorn Model: : Guide to ICT’s Best Standalone setup🦄 The ICT Unicorn: The Most Powerful Setup in ICT
Among all the concepts of ICT, the Unicorn setup stands out as the ultimate precision entry model, it’s confluence perfected. Why? Because it merges two of the most potent ideas in ICT theory: Breaker Blocks and Fair Value Gaps into a single zone.
This combination creates the most high-probability, sniper-level setup in the entire ICT playbook.
Why It’s the Best you think?
Most ICT setups (like simple FVGs, order blocks, or liquidity sweeps) offer high-probability trades on their own, but the Unicorn setup stacks the odds in your favor by combining multiple layers of confirmation. This makes it the most disciplined and rewarding entry model for traders who rely on market structure.
Core Concepts Explained
A breaker block is a former order block that gets invalidated when price breaks structure, then acts as support or resistance upon a retest. It’s a sign of a shift in market intent, from bullish to bearish or vice versa.
A fair value gap (FVG) is a three-candle pattern where a sudden price move creates an imbalance, a "gap" between the wicks of the first and third candle. Price often retraces into that gap before continuing its trend.
When these two concepts overlap, a breaker block and a fair value gap in the same zone, it forms the “unicorn” setup. It suggests a strong level where liquidity has been taken and institutions may re-enter.
How the Setup Work s
First, you identify a market structure shift, like a break in a previous high or low. Then look for the breaker block left behind by that move. Within that block, check if there’s a fair value gap (the imbalance zone). When price retraces back into that confluence zone, wait for a reaction, often a strong reversal or continuation.
Entry is usually taken when price shows rejection within the zone on a lower timeframe. Your stop-loss goes just beyond the breaker block, and your target can be the next high/low or a logical liquidity pool.
Example of a bearish Unicorn Model:
Best Conditions to Use It
This setup works best when used in line with the higher timeframe trend. Many traders analyze structure on the 1-hour or 4-hour chart, then drop to 5-minute or 15-minute charts to enter. It’s commonly used in forex and indices but also works well in crypto or commodities.
Avoid using it during news events though. Like all ICT concepts, it requires patience and practice to identify clean setups and avoid forcing trades.
Example spotted on a Gold setup:
ICT Unicorn Model was first introduced in 2022, primarily applied to the Nasdaq 100 (NQ) and S&P 500 (ES). What stood out immediately was its precision, the kind of clean structure and consistency you don’t often find in most strategies.
As it was tested further, it was clear this wasn’t just for indices. The model transitioned beautifully into forex, especially on major pairs like GBP/USD and EUR/USD, delivering sharp entries as well.
I also tested it on metals like gold (XAU/USD) and silver (XAG/USD), as well as the Dollar Index (DXY), and the results spoke for themselves. Even in crypto, where volatility is the norm, the Unicorn setup held its ground.
It’s rare to find a trading model that adapts across markets this well.
Final Thoughts
The ICT Unicorn is all about confluence and precision. You’re not trading every breaker or every FVG, only the ones that align, especially with a clean shift in structure. When used with proper risk management, it can be a high-probability setup in your playbook.

XAU/USD 08 June 2025 Intraday AnalysisH4 Analysis:
-> Swing: Bullish.
-> Internal: Bullish.
You will note that price has targeted weak internal high on two separate occasions forming a double top which is a bearish reversal pattern. This is in-line with HTF bearish pullback phase.
Remainder of analysis and bias remains the same as analysis dated 23 April 2025.
Price has now printed a bearish CHoCH according to my analysis yesterday.
Price is now trading within an established internal range.
Intraday Expectation:
Price to trade down to either discount of internal 50% EQ, or H4 demand zone before targeting weak internal high priced at 3,500.200.
Note:
The Federal Reserve’s sustained dovish stance, coupled with ongoing geopolitical uncertainties, is likely to prolong heightened volatility in the gold market. Given this elevated risk environment, traders should exercise caution and recalibrate risk management strategies to navigate potential price fluctuations effectively.
Additionally, gold pricing remains sensitive to broader macroeconomic developments, including policy decisions under President Trump. Shifts in geopolitical strategy and economic directives could further amplify uncertainty, contributing to market repricing dynamics.
H4 Chart:
M15 Analysis:
-> Swing: Bullish.
-> Internal: Bullish.
H4 Timeframe - Price has failed to target weak internal high, therefore, it would not be unrealistic if price printed a bearish iBOS.
The remainder of my analysis shall remain the same as analysis dated 13 June 2025, apart from target price.
As per my analysis dated 22 May 2025 whereby I mentioned price can be seen to be reacting at discount of 50% EQ on H4 timeframe, therefore, it is a viable alternative that price could potentially print a bullish iBOS on M15 timeframe despite internal structure being bearish.
Price has printed a bullish iBOS followed by a bearish CHoCH, which indicates, but does not confirm, bearish pullback phase initiation. I will however continue to monitor, with respect to depth of pullback.
Intraday Expectation:
Price to continue bearish, react at either M15 supply zone, or discount of 50% internal EQ before targeting weak internal high priced at 3,451.375.
Note:
Gold remains highly volatile amid the Federal Reserve's continued dovish stance, persistent and escalating geopolitical uncertainties. Traders should implement robust risk management strategies and remain vigilant, as price swings may become more pronounced in this elevated volatility environment.
Additionally, President Trump’s recent tariff announcements are expected to further amplify market turbulence, potentially triggering sharp price fluctuations and whipsaws.
M15 Chart:

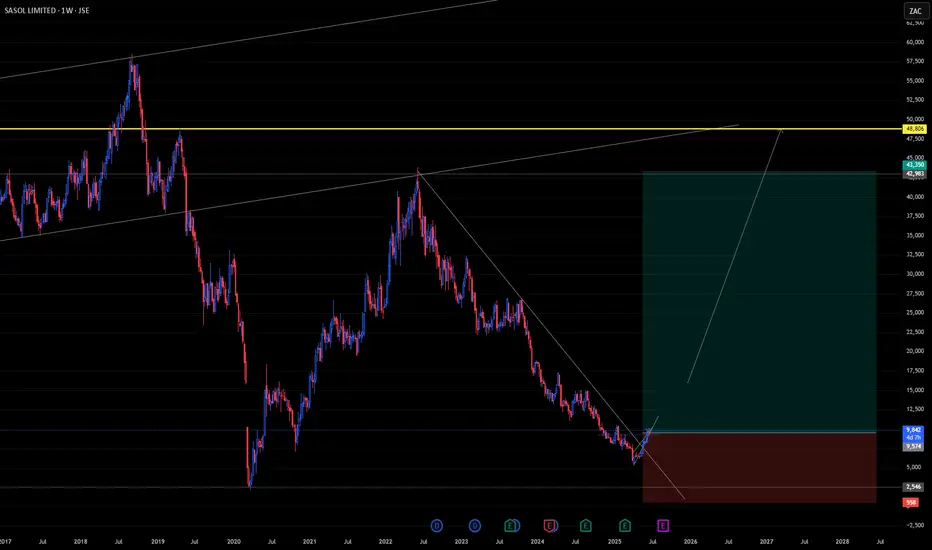
SOL Long Term Long PositionJSE:SOL credit rating has been stamped with a Ba1 by Moody's which is very unfavourable to the company, wholistically. This is as a result of its weakening operating performance mainly attributed to low demand in the chemicals market and weak oil prices.
With expectations of higher FX:USOIL prices and JSE:SOL being pretty much undervalued, trading near its supporting level of 8600 ZAC, a positive outlook is still evident. Long positions have been executed at 9574 ZAC with a possibility to further capitalize when necessary.
Cite: Sasol outlook downgraded to negative by Moody's Ratings, Ba1 rating affirmed - Luke Juricic
#SOL Update #3 – July 8, 2025🟠 #SOL Update #3 – July 8, 2025
Solana, much like Litecoin, is still undergoing corrections following its latest impulsive move. While it currently holds above a strong support level, two significant resistance zones are ahead.
The market is undecided, and Solana's direction remains uncertain, making it one of the riskiest assets to trade today.
If the $145 support fails, the price may drop toward $137. Conversely, a daily close above $159 could trigger a move toward $167. For now, it's best to stay on the sidelines and monitor the price action closely.

🇪🇺 EURUSD – July 8 | Ranging After FakeoutAfter breaking Thursday’s low, EURUSD gave us 30 pips then started ranging right at that level. Today’s price action is mildly bullish, but likely just a retest of the 4hr bearish structure that’s formed.
📌 Key Levels:
🔼 Safe Buys:
Above 1.18075 (strong resistance)
→ Breakout = ~70 pip opportunity
🔽 Sells / Deeper Pullback:
Below 1.16869
→ Potential 60 pip drop into next liquidity zone
⚠️ Current range is tight and indecisive — not worth trading until we get a break.
Bias still bullish longer-term, but patience needed here.

🇨🇦 USDCAD – July 8 | Trendline Test and Liquidity WatchYesterday USDCAD closed strong bullish (+100 pips) into the March 2024 trendline, which it’s respected multiple times this year.
But there’s a key detail:
➡️ Today’s high is a pip away from yesterday’s — and there’s no upper wick.
That makes this a liquidity risk zone.
📌 What I’m watching:
🔻 Break of 1.36383 = potential shift to bearish intraday structure
→ First target: 1.35827 (yesterday’s low)
→ Then: 1.35432 for swing sell continuation
🔺 Small liquidity grab above today's high possible before drop
🧭 Bias: Bearish on daily + higher timeframes
🎯 Waiting for confirmation, not assumption

XAUUSD SELLThe price has come to our poi so we are shorting from the zone .
please follow to support me .
Thank you !
BTCUSD BUY 105750On the 4-hour chart, BTCUSD is currently oscillating at a high level. Currently, we can pay attention to the support near 105750, which is a potential buying position for the bullish bat pattern. At the same time, this position is in the demand area.

NQ Power Range Report with FIB Ext - 7/8/2025 SessionCME_MINI:NQU2025
- PR High: 22853.50
- PR Low: 22808.50
- NZ Spread: 100.5
No key scheduled economic events
Session Open Stats (As of 12:25 AM 7/8)
- Session Open ATR: 318.85
- Volume: 24K
- Open Int: 269K
- Trend Grade: Neutral
- From BA ATH: -0.8% (Rounded)
Key Levels (Rounded - Think of these as ranges)
- Long: 23239
- Mid: 21525
- Short: 20383
Keep in mind this is not speculation or a prediction. Only a report of the Power Range with Fib extensions for target hunting. Do your DD! You determine your risk tolerance. You are fully capable of making your own decisions.
BA: Back Adjusted
BuZ/BeZ: Bull Zone / Bear Zone
NZ: Neutral Zone

#TITAN Equilibrium ( DEMAND AND SUPPLY ZONE)Entry Rules:
Demand Zone Buy:
Wait for price to return to a demand zone.
Look for bullish reversal candlestick patterns (e.g., hammer, engulfing).
Enter long with a stop-loss below the zone.
Supply Zone Sell:
Wait for price to return to a supply zone.
Look for bearish reversal candlestick patterns (e.g., shooting star, bearish engulfing).
Enter short with a stop-loss above the zone.
Exit Rules:
Take profit at the next key supply/demand zone or using a risk-reward ratio (1:2 or 1:3).
Trail stop-loss if price moves favorably.

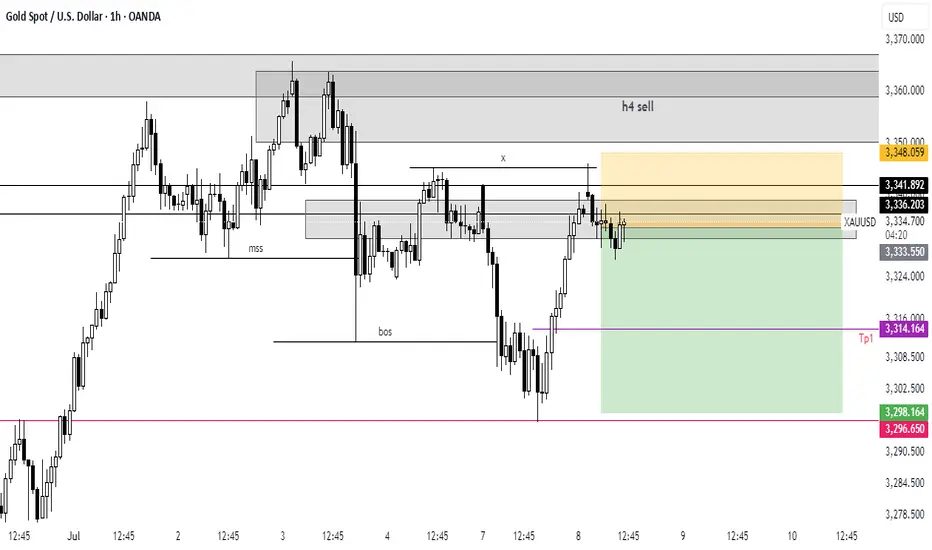
Gold sell off before continuation higher? Pending order set on this one before bed
Will see what develops overnight

EURUSD - Potential sell at LDN or NY openLooking for sell from the POI highlighted
We have raided buy side liquidity so now its time to look at the origin of the move and see if we can further capitalise on a similar set up I took yesterday in order to bank a lovely 8.5% profit on this single trade.
Will post the trade below

USDCHF - Potential downside incominglooking at UCHF we have just swept a level of liquidity.
We have had a Change of Character on the 15min to the downside and left a nice inducement / liquidity level alongside a nice FVG that has left a nice bearish orderblock
Once the spreads calm down I will set my pending order on this level and hope to be tagged into this position.
Due to the time it will be a reduced risk entry as I won't be able to manage the trade during the night.

XMR 3 Month Heikin Ashi Trend ChartWe have here a trend outlook chart for Monero on a 3 monthly timeframe (Heikin Ashi candlestick chart). XMR is one of a handful of high market cap coins which have showed signs of strength on a variety of indicators (despite high volatility with various other high market cap coins), including the positive MACD and RSI indicators as shown in this chart.
In addition, there has been significant buy volume in the 170 - 277 price range, as can be seen in the Price-Volume indicator to the right of the chart, keeping the price up.
Monero has withstood the political and economic turmoil in recent months making it a strong contender against some of the largest market cap coins. With the current price sitting at approximately USD$315, there is potential for further upside in the long-term.
_____________
This publication and the information contained in it are for educational purposes only, and is not meant to be nor does it constitute financial, investment, trading or other types of advice or recommendations.

06/30 Weekly Gamma Exposure Outlook🧠 SPX Weekly Outlook — Gamma Breakout + Short Week Setup
The bulls finally broke through after weeks of painful grinding — and they did so with force.
📈 Thursday & Friday brought a textbook gamma squeeze as SPX sliced through the long-standing 6100 call wall , triggering sharp upside acceleration.
We are now firmly in positive Net GEX territory.
🔺 Entire GEX structure has shifted higher.
🎯 New squeeze zone at 6225 , with major call resistance near 6200 .
🔍 What Just Happened?
📊 The 6060–6120 zone acted as a tough resistance range for weeks — until last week’s breakout.
💥 Put skew collapsed , suggesting downside hedges are being unwound.
📉 VIX and IV keep dropping , confirming a shift toward lower-volatility environment .
🧲 Strong Net GEX across expiries created sustained upward dealer pressure → we’re in long gamma mode .
✅ Bullish Bias — But Stay Tactical
We're in a bullish gamma regime , so dips are likely to be bought.
Key pullback zone to watch: 6125–6060 .
🛠️ Strategy Ideas:
• Wait for a 6060–6125 retest before re-entering longs
• Use shorter-DTE bull put spreads or 0DTE gamma scalps above 6130+
• Scale out or trim risk near 6200–6225
⚠️ Risks to Watch
We’re overextended short-term.
🚨 Losing 6130–6125 could spark a quick flush to 6050 .
Bearish signals to monitor:
• IV spike or renewed put buying
• Loss of 6100 = no-man’s land without confirmation
• Consider short-term debit put spreads if breakdown confirms
🗓️ Short Trading Week Note
🇺🇸 U.S. markets closed Friday, July 5 for Independence Day.
This compresses flows into 4 sessions. Expect:
📌 Early week dealer hedging
📌 Possible positioning unwind on Thursday
💡 Weekly Trade Idea — Structure in Place
💼 Setup:
• Put Butterfly below spot
• 3x Call Diagonal Spreads above spot (5pt wide)
• Slight net negative delta , 11 DTE
🎯 Why it works:
• Leverages IV backwardation
• Profits from time decay
• Favors a stable or modestly bullish week
• Takes advantage of horizontal skew (July 11 vs July 14)
💰 Profit Target: 10–20% return on ~$1,730 risk.
Take profits before time decay kills the center valley — don’t overstay. 🏃💨
📌 Final Thoughts:
The 6100 breakout was technically & gamma-structurally significant ,
but big moves often retest before continuing.
Let price breathe.
Stay aligned with gamma exposure profile. 🔄

EURUSD OUTLOOK 8 - 11 JULYNFP and unemployment rate came out bullish for the dollar which caused that big push to the down side. The job market is still holding well thus we are less likely to see the FED cut rates.
Other economic data is still showing that the dollar is weaker against the euro so I'm not going to change my direction bias just yet. Technical analysis also clearly shows that we are still bullish on EURUSD.
We don't have much fundamental data coming out this week so I'm anticipating price to continue lower to give a deeper pullback off of last weeks data, Then next week depending how CPI, PPI and Retails sales go we will get a clearer picture on how to trade the pair.
Last week's 4H outlook is still valid and is more useful when looking to execute trades. This daily Analysis just gives the bigger picture for more of a swing setup analysis
