NQ Power Range Report with FIB Ext - 7/8/2025 SessionCME_MINI:NQU2025
- PR High: 22853.50
- PR Low: 22808.50
- NZ Spread: 100.5
No key scheduled economic events
Session Open Stats (As of 12:25 AM 7/8)
- Session Open ATR: 318.85
- Volume: 24K
- Open Int: 269K
- Trend Grade: Neutral
- From BA ATH: -0.8% (Rounded)
Key Levels (Rounded - Think of these as ranges)
- Long: 23239
- Mid: 21525
- Short: 20383
Keep in mind this is not speculation or a prediction. Only a report of the Power Range with Fib extensions for target hunting. Do your DD! You determine your risk tolerance. You are fully capable of making your own decisions.
BA: Back Adjusted
BuZ/BeZ: Bull Zone / Bear Zone
NZ: Neutral Zone
Supply and Demand

#TITAN Equilibrium ( DEMAND AND SUPPLY ZONE)Entry Rules:
Demand Zone Buy:
Wait for price to return to a demand zone.
Look for bullish reversal candlestick patterns (e.g., hammer, engulfing).
Enter long with a stop-loss below the zone.
Supply Zone Sell:
Wait for price to return to a supply zone.
Look for bearish reversal candlestick patterns (e.g., shooting star, bearish engulfing).
Enter short with a stop-loss above the zone.
Exit Rules:
Take profit at the next key supply/demand zone or using a risk-reward ratio (1:2 or 1:3).
Trail stop-loss if price moves favorably.

Gold sell off before continuation higher? Pending order set on this one before bed
Will see what develops overnight

EURUSD - Potential sell at LDN or NY openLooking for sell from the POI highlighted
We have raided buy side liquidity so now its time to look at the origin of the move and see if we can further capitalise on a similar set up I took yesterday in order to bank a lovely 8.5% profit on this single trade.
Will post the trade below

USDCHF - Potential downside incominglooking at UCHF we have just swept a level of liquidity.
We have had a Change of Character on the 15min to the downside and left a nice inducement / liquidity level alongside a nice FVG that has left a nice bearish orderblock
Once the spreads calm down I will set my pending order on this level and hope to be tagged into this position.
Due to the time it will be a reduced risk entry as I won't be able to manage the trade during the night.

XMR 3 Month Heikin Ashi Trend ChartWe have here a trend outlook chart for Monero on a 3 monthly timeframe (Heikin Ashi candlestick chart). XMR is one of a handful of high market cap coins which have showed signs of strength on a variety of indicators (despite high volatility with various other high market cap coins), including the positive MACD and RSI indicators as shown in this chart.
In addition, there has been significant buy volume in the 170 - 277 price range, as can be seen in the Price-Volume indicator to the right of the chart, keeping the price up.
Monero has withstood the political and economic turmoil in recent months making it a strong contender against some of the largest market cap coins. With the current price sitting at approximately USD$315, there is potential for further upside in the long-term.
_____________
This publication and the information contained in it are for educational purposes only, and is not meant to be nor does it constitute financial, investment, trading or other types of advice or recommendations.

06/30 Weekly Gamma Exposure Outlook🧠 SPX Weekly Outlook — Gamma Breakout + Short Week Setup
The bulls finally broke through after weeks of painful grinding — and they did so with force.
📈 Thursday & Friday brought a textbook gamma squeeze as SPX sliced through the long-standing 6100 call wall , triggering sharp upside acceleration.
We are now firmly in positive Net GEX territory.
🔺 Entire GEX structure has shifted higher.
🎯 New squeeze zone at 6225 , with major call resistance near 6200 .
🔍 What Just Happened?
📊 The 6060–6120 zone acted as a tough resistance range for weeks — until last week’s breakout.
💥 Put skew collapsed , suggesting downside hedges are being unwound.
📉 VIX and IV keep dropping , confirming a shift toward lower-volatility environment .
🧲 Strong Net GEX across expiries created sustained upward dealer pressure → we’re in long gamma mode .
✅ Bullish Bias — But Stay Tactical
We're in a bullish gamma regime , so dips are likely to be bought.
Key pullback zone to watch: 6125–6060 .
🛠️ Strategy Ideas:
• Wait for a 6060–6125 retest before re-entering longs
• Use shorter-DTE bull put spreads or 0DTE gamma scalps above 6130+
• Scale out or trim risk near 6200–6225
⚠️ Risks to Watch
We’re overextended short-term.
🚨 Losing 6130–6125 could spark a quick flush to 6050 .
Bearish signals to monitor:
• IV spike or renewed put buying
• Loss of 6100 = no-man’s land without confirmation
• Consider short-term debit put spreads if breakdown confirms
🗓️ Short Trading Week Note
🇺🇸 U.S. markets closed Friday, July 5 for Independence Day.
This compresses flows into 4 sessions. Expect:
📌 Early week dealer hedging
📌 Possible positioning unwind on Thursday
💡 Weekly Trade Idea — Structure in Place
💼 Setup:
• Put Butterfly below spot
• 3x Call Diagonal Spreads above spot (5pt wide)
• Slight net negative delta , 11 DTE
🎯 Why it works:
• Leverages IV backwardation
• Profits from time decay
• Favors a stable or modestly bullish week
• Takes advantage of horizontal skew (July 11 vs July 14)
💰 Profit Target: 10–20% return on ~$1,730 risk.
Take profits before time decay kills the center valley — don’t overstay. 🏃💨
📌 Final Thoughts:
The 6100 breakout was technically & gamma-structurally significant ,
but big moves often retest before continuing.
Let price breathe.
Stay aligned with gamma exposure profile. 🔄

EURUSD OUTLOOK 8 - 11 JULYNFP and unemployment rate came out bullish for the dollar which caused that big push to the down side. The job market is still holding well thus we are less likely to see the FED cut rates.
Other economic data is still showing that the dollar is weaker against the euro so I'm not going to change my direction bias just yet. Technical analysis also clearly shows that we are still bullish on EURUSD.
We don't have much fundamental data coming out this week so I'm anticipating price to continue lower to give a deeper pullback off of last weeks data, Then next week depending how CPI, PPI and Retails sales go we will get a clearer picture on how to trade the pair.
Last week's 4H outlook is still valid and is more useful when looking to execute trades. This daily Analysis just gives the bigger picture for more of a swing setup analysis

USDCAD...potential further upside expectedHey Hey TradingView fam! Hope you guys are doing absolutely amazing today...hope your trading weeks are off to an amazing start and hopefully this post can be helpful for the remainder of this week for you! Let's dive in!
OK so for USDCAD this is a post to piggyback off of the previous swing position post I did for USDCAD longs a couple weeks ago...those positions played out well and now wanted to revisit this currency pair because it is giving another potential opportunity to mover to the upside and so wanted to break down what I see here. Let's make it simple
1. Weekly demand zone
2. Strong momentum from buyers on Daily timeframe
3. Higher low formed WITH STRENGTH (big clue of interest)
4. Fib extension lining up with daily supply zone
5. Higher low forming would then now expect a new higher high to form
OK hope that made sense! I want to make these posts as simple as possible so hopefully this added some value for you guys!
Please boost and follow my page for more highly accurate setups! Cheers!

NZDUSD Clear Bearish Continuation🧠 Timeframe Sentiment Overview
Weekly (W): Bullish
Daily (D): Bullish
12H, 6H, 4H: Bearish
Bias: Weak bearish retracement inside HTF bullish trend. Caution advised—likely a counter-trend play or short-term pullback trade.
📉 Market Structure Analysis
Bearish BOS recently occurred on 4H with a sharp drop.
Red arrow forecasts a continuation lower if price respects the short-term supply zone.
📊 EMA Confluence
Price is currently below both the 50 EMA (blue) and 200 EMA (red) → indicates a bearish short-term trend.
EMAs act as dynamic resistance in the supply zone.
Risk-Reward Ratio: Approximately 2:1 or better.
🔁 Strategy Notes
Since HTF is bullish (W + D), this is a counter-trend move, so confirmation (e.g. on 1H or 15m) is important.
Text on chart suggests waiting for 1H structure shift before executing the trade for better timing and lower risk.
✅ Confluences Supporting the Short
Clear 4H BOS and bearish momentum.
Bearish EMAs alignment (50 < 200).
Price entering previous support turned resistance.
Weekly AOI (target) is a high-probability demand zone.
Bearish momentum from 12H/6H/4H despite higher TF bullishness.
⚠️ Caution
Since W and D are bullish, price could bounce aggressively from the Weekly AOI.
Monitor LTF reaction closely for exit/reversal.

potential short setup on NZD/CAD🧠 Timeframe Sentiment Overview
Weekly (W): Bullish
Daily (D): Bullish
12H, 6H, 4H: Bearish
Bias: Weak bearish retracement inside HTF bullish trend. Caution advised—likely a counter-trend play or short-term pullback trade.
📉 Market Structure Analysis
Bearish BOS recently occurred on 4H with a sharp drop.
Price is now forming a potential lower high at previous support flipped resistance (around 0.82400–0.82550), shown in the red box.
Red arrow forecasts a continuation lower if price respects the short-term supply zone.
📊 EMA Confluence
Price is currently below both the 50 EMA (blue) and 200 EMA (red) → indicates a bearish short-term trend.
EMAs act as dynamic resistance in the supply zone.
🟥 Short Trade Setup
Entry Zone: Pullback into 0.82400–0.82577 (marked supply zone).
Stop Loss: Just above the red zone at ~0.82638.
Take Profit (TP): Weekly AOI at ~0.81680–0.81770, previous demand + liquidity zone.
Risk-Reward Ratio: Approximately 2:1 or better.
🔁 Strategy Notes
Since HTF is bullish (W + D), this is a counter-trend move, so confirmation (e.g. on 1H or 15m) is important.
Text on chart suggests waiting for 1H structure shift before executing the trade for better timing and lower risk.
✅ Confluences Supporting the Short
Clear 4H BOS and bearish momentum.
Bearish EMAs alignment (50 < 200).
Price entering previous support turned resistance.
Weekly AOI (target) is a high-probability demand zone.
Bearish momentum from 12H/6H/4H despite higher TF bullishness.
⚠️ Caution
Since W and D are bullish, price could bounce aggressively from the Weekly AOI.
Monitor LTF reaction closely for exit/reversal.

short setup on AUD/CAD🧠 Market Sentiment by Timeframe
Weekly (W): Bearish
Daily (D): Bullish
12H, 6H, 4H: Bearish
Bias: Short-term continuation to the downside after retest of supply/imbalance.
🔍 Technical Breakdown
🔴 1. Structure & Momentum
Price broke down from previous 4H support (~0.88900–0.89000) creating a lower low.
A bearish BOS confirms momentum shift.
Price is now consolidating below the 200 EMA and 50 EMA → indicating bearish pressure.
🟥 2. Weekly AOI / Supply Zone
Red box above (0.89058–0.89307) marks Weekly AOI (Supply).
It represents a strong resistance area where price previously sold off.
Expected lower high (LH) to form at the retest of this supply.
🟦 3. Trade Plan
Entry Zone: Anticipated pullback into 0.88922–0.89058 (Daily AOI + 200 EMA resistance).
Stop Loss: Above the Weekly AOI at ~0.89307.
Take Profit (TP): Toward the Daily AOI around 0.88000–0.87999, a previous demand zone.
RR: Over 2:1 potential, depending on exact entry.
🔵 4. EMA Dynamics
Price currently sits below both the 50 EMA (blue) and 200 EMA (red), confirming bearish alignment.
EMAs act as dynamic resistance zones, giving confluence to the short.
📉 Bearish Confluences
Bearish market structure on 4H, 6H, 12H.
EMA crossover and rejection.
Weekly AOI = major supply.
Daily AOI just rejected.
Anticipated lower high to form before continuation.
✅ Summary of Setup
Type: Counter-trend against Daily bullish bias, with HTF bearish confirmation.
Setup: Pullback → rejection → short continuation.
Target: Clean sweep of liquidity near 0.8800 Daily AOI.

short setup on AUD/USD 🧠 Overall Context
W (Weekly): Bullish
D (Daily): Bearish
12H, 6H, 4H: Bearish
Bias: Short-term bearish retracement inside higher timeframe bullish structure.
🔍 Technical Breakdown
🔴 1. Market Structure
Price broke below a significant support zone (around 0.65300–0.65400), flipping it into resistance (now labeled Weekly AOI).
A bearish BOS (Break of Structure) has occurred on 4H.
Lower high formation is anticipated at the AOI (area of interest) around 0.65200–0.65400.
🔵 2. EMA Confluence
Price is now below the 50 EMA (blue) and testing the 200 EMA (red) as dynamic resistance/support.
The rejection near the 200 EMA (red) is forming consolidation, suggesting distribution before another leg down.
🟥 3. Supply Zone (Weekly AOI)
Clear supply zone rejection in red box: previous support → resistance flip.
The red rectangle represents a potential entry zone for a short, with SL above 0.65400.
🟩 4. Trade Setup
Entry: Rejection or mitigation at 0.65200–0.65400 zone (Weekly AOI).
SL: Just above the supply zone, around 0.65465.
TP: Near Daily AOI at 0.64500–0.64490, aligning with a strong demand zone from late June.
RR (Risk-Reward): Approximately 1:2 or better, depending on exact entry.
🔻 5. Projection Path
Bearish move expected after potential pullback.
Red arrow shows anticipated path: rally to Weekly AOI → rejection → continuation to Daily AOI → possible reaction at Weekly AOI below 0.6400 if sell pressure continues.
✅ Confluences for Short
HTF (4H, 6H, 12H) bearish structure.
Rejection at flipped Weekly AOI.
Bearish EMA alignment.
Clear BOS and lower-high formation.
Clean TP target at Daily AOI (logical liquidity pool).

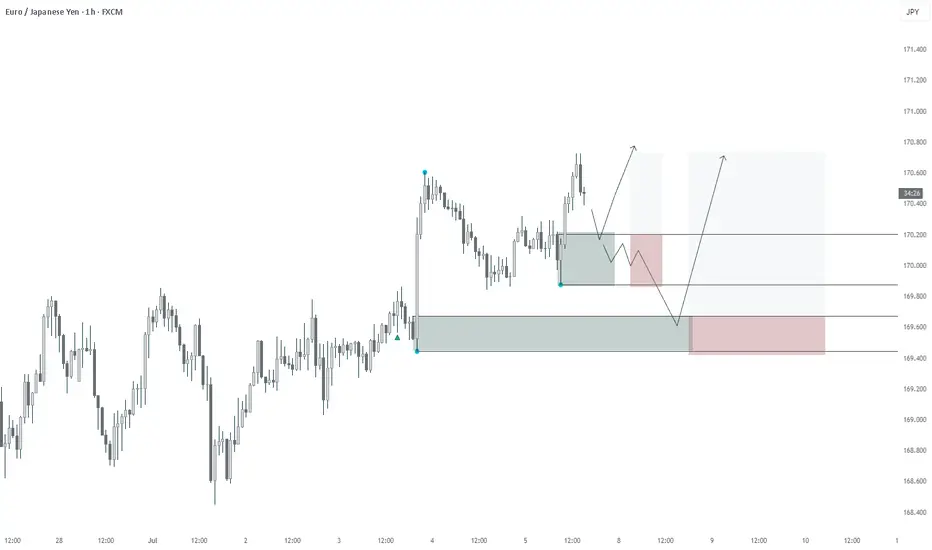
EUR/JPY: Healthy Correction Expected Before the Next Leg UpWelcome back! Let me know your thoughts in the comments!
** EURJPY Analysis !
We recommend that you keep this pair on your watchlist and enter when the entry criteria of your strategy is met.
Please support this idea with a LIKE and COMMENT if you find it useful and Click "Follow" on our profile if you'd like these trade ideas delivered straight to your email in the future.
Thanks for your continued support! Welcome back! Let me know your thoughts in the comments!

Weekly Forex Outlook Sun.July.6.2025 - Fri.July.11.2025Like and Comments would be appreciated :D Not Financial Advice, Just my outlook/opinion

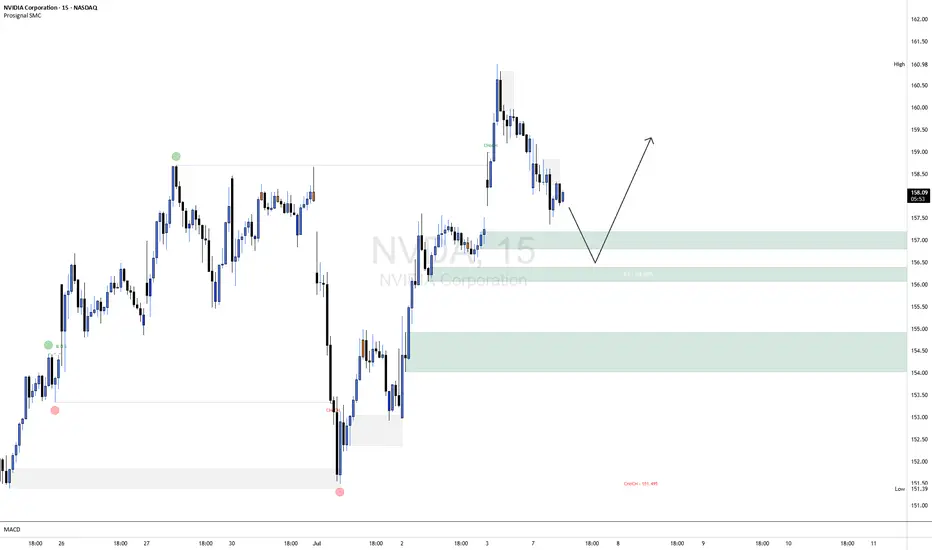
NVDA ShortNVDA is currently exhibiting short-term bearish order flow on the 15-minute chart, with price making lower highs and lower lows following a clear CHoCH (Change of Character) to the downside. The current leg suggests continued weakness as price retraces toward the highlighted bullish order block around the 156.20–157.00 range, aligning closely with the 50% equilibrium level of the last bullish impulse.
This area represents a high-probability demand zone where we anticipate a potential bullish reaction. A confirmation entry (e.g., bullish BOS or lower timeframe CHoCH within the OB) will be required to validate a long setup from this zone. Should confirmation present itself, upside targets can be trailed back toward recent highs near 159.00–160.00.
Risk Management Note:
Always wait for confirmation before entering against the prevailing short-term trend. Use a well-defined stop-loss below the order block and calculate your position size based on your overall risk tolerance (typically 0.5–1% of account equity per trade). Avoid overleveraging, and remember that patience and discipline are key to capital preservation.
GBPJPY sitting at resistance – Is a drop to 193.360 likely?GBPJPY is sitting right at a key daily resistance zone. This is a level where it has struggled to break through and reversed strongly to the downside. So this makes it definitely one to monitor, especially if you’re eyeing potential short setups.
If we start seeing signs that the price is getting rejected here: like long wicks, strong bearish candles, it could be the early indication of another move lower. My focus is on a moderate drop toward the 193.360 area, similar to what we’ve seen in past pullbacks. Nothing too dramatic, just a simple downside play if sellers step in again.
But if we get a strong breakout? That changes everything: it would hint that bulls are taking full control. This area is pretty important and could give us a better idea of where price is headed next.
Just sharing my thoughts on support and resistance, this isn’t financial advice. Always confirm your setups and manage your risk properly.
Disclosure: I am part of Trade Nation's Influencer program and receive a monthly fee for using their TradingView charts in my analysis.

EURGBP reached strong resistance: Likely reversal incomingPrice has been in a strong impulsive rally, pushing aggressively into a well established resistance zone. This zone is marked by a prior sharp sell-off, suggesting it could trigger selling interst again.
The current move appears overextended in the short term. The ascending channel is extremly vertical, showing momentum, but this type of movement often leads to exhaustion, especially when met with a key zone like so. Volume profile shows a lack of recent trading activity at these levels, which can exaggerate volatility once price enters this area.
Given how clean and one-sided the climb has been, a pullback is not only likely, but it would be healthy. The projected reaction toward the 0.85800 area makes sense technically: it corresponds with key Fibonacci retracement levels (between 0.5 and 0.618), adding confluence to the idea of a corrective move before any continuation or reversal.
Until there’s a clear break above the upper bound of this zone with sustained volume, this remains a high-probability area for short-term rejection or distribution.
If price starts printing long upper wicks, slowing momentum, or bearish engulfing patterns on lower timeframes, that could offer early signals of weakness and a shift in momentum.
Just sharing my thoughts on support and resistance, this isn’t financial advice . Always confirm your setups and manage your risk properly.
Disclosure: I am part of Trade Nation's Influencer program and receive a monthly fee for using their TradingView charts in my analysis.

USDJPY Price Accumulated|Time For Bullish Distribution|Setupsfx|The price has accumulated nicely and is now distributing. We have three targets in mind, but set your own based on your analysis. Our approach is purely technical, but also includes a basic fundamental approach. This analysis concludes over 1500 pips and is a swing move. Please use this analysis as educational purposes only, as it does not guarantee that price will move exactly as predicted.
If you like our idea, please consider liking and commenting on it.
Good luck and trade safely!
Team Setupsfx_

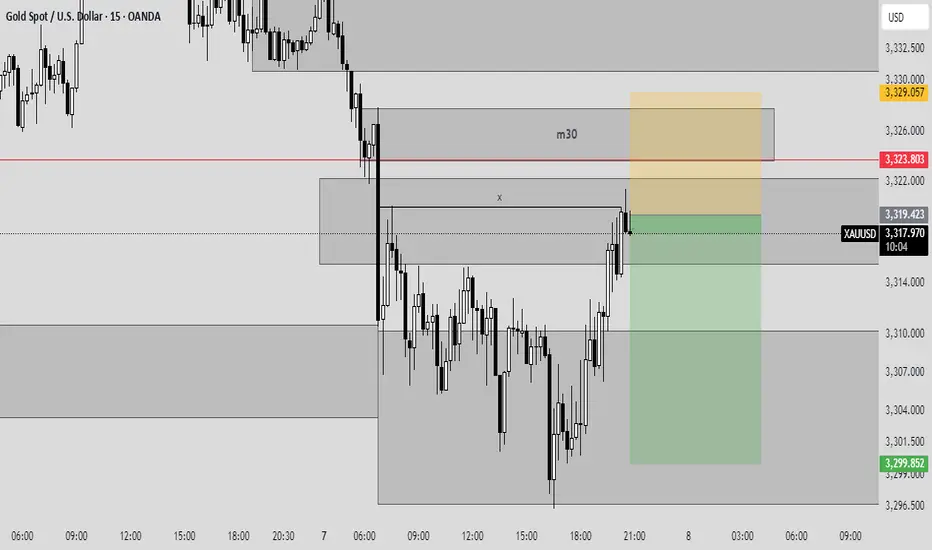
XAUUSD SEllhere the price retested our zone at 3319-3321 so we enter sell .
Please do risk and money management and your own analysis before entry.
Please follow to support me .
GBPAUD 15/3 Pullback LongThere could be a double tops forming in progress. It could drop down to the two demand zones and get liquidity and fly up.
Also could be triple tops and pullback and fly.
Ultimate goal is long and reaching supply 2.09620 area

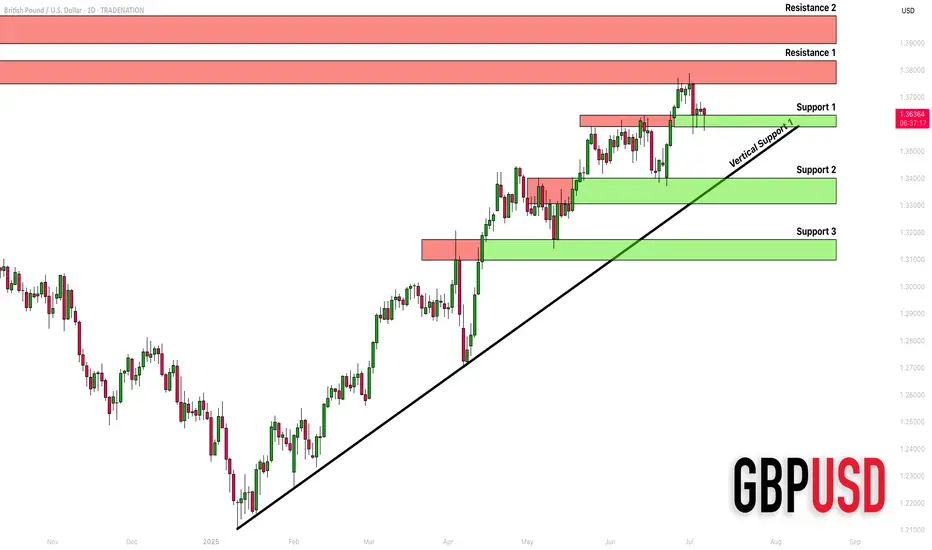
GBPUSD: Detailed Support & Resistance Analysis 🇬🇧🇺🇸
Here is my structure analysis for GBPUSD.
Horizontal Structures
Support 1: 1.3588 - 1.3633 area
Support 2: 1.3305 - 1.3400 area
Support 3: 1.3097 - 1.3175 area
Resistance 1: 1.3748 - 1.3835 area
Resistance 2: 1.3900 - 1.3400 area
Vertical Structures
Vertical Support 1: rising trend line
Consider these structures for pullback/breakout trading.
❤️Please, support my work with like, thank you!❤️
I am part of Trade Nation's Influencer program and receive a monthly fee for using their TradingView charts in my analysis.