Apple Stock in 10 years perspective: Stability or New Heights?The future of Apple stock remains a hot topic among investors and analysts. For today’s July, the company’s market capitalization has climbed to $3 trillion, up from $2.9 trillion (a year ago, on May 2024). But can this tech giant continue to deliver significant returns for shareholders over the next decade? Let’s take a quick look on it.
AI’s Take on the Future
Recently, ChatGPT highlighted Apple NASDAQ:AAPL as a top contender among stocks poised to generate substantial wealth by 2035, outranking peers like Microsoft NASDAQ:MSFT , Amazon NASDAQ:AMZN , and Nvidia NASDAQ:NVDA . The prediction has sparked curiosity, but what do real-world experts think?
Analyst Perspectives: Strengths and Challenges
Opinions on Apple’s outlook vary. On one hand, the company boasts a robust financial foundation, steady revenue from subscriptions, and substantial cash reserves. On the other hand, some analysts argue that its current share price is overstretched. Apple’s forward P/E ratio—based on projected earnings for the next 12 months—stands at 27, compared to the S&P 500’s near 22, suggesting investors are paying a premium for future growth.
Additionally, Apple faces mounting competition and regulatory pressures. The key question is whether it can maintain its edge in a fast-evolving tech industry.
Services and Devices
In recent years, Apple has leaned heavily into services like subscriptions and digital platforms, delivering high-margin and recurring revenue. Yet, its core business still hinges on device sales, particularly the well-known iPhone. Without groundbreaking new products, the company risks getting stuck in a cycle of incremental updates, potentially slowing its growth trajectory.
Financial Resilience
Despite these challenges, Apple’s financial metrics remain impressive. Its market cap has risen to $3 trillion, and it continues to generate significant free cash flow. The company also offers modest dividends, making it attractive for those people, who prefer and seek stable returns.
What to Expect from Apple by 2035?
Apple stands as one of the most dependable long-term investments, but we shouldn’t expect the explosive growth, just like it was at their early years. Of course iconic brand, loyal customer base, and adaptability— is a strong side and support its stability. But the high share price, competitive pressures, and reliance on certain hardware components may limit and slow down its upside.
Can Apple make you wealthy by 2035? It depends on your goals, risk tolerance and the size of your investment. For those seeking stability and modest gains, Apple is a solid pick. But if you’re chasing rapid wealth, you might need to look elsewhere for higher-risk opportunities.
Supply and Demand

gold for long *The content on this analysis is subject to change at any time without notice, and is provided for the sole purpose of assisting traders to make independent investment decisions.

A fall is on the horizon — watch out!OANDA:NZDUSD
Channel breakout confirmed, with sellers showing interest.
The price is now ideal for shorts — I’m jumping in.

It wants to fall on its own!OANDA:AUDUSD
The price’s failure to break out of the channel with strong candles, along with a double top, signals that sellers are stepping in.
It’s time to enter — let’s go! 💥

LONG ON GBP/CHFGBP/CHF has tapped into a major demand zone and has lots of buy side liquidity to the upside near the supply zone to collect.
I will be buying GBP/CHF to the supply zone looking to catch 400-600 pips.

BankNifty levels - Jul 08, 2025Utilizing the support and resistance levels of BankNifty, along with the 5-minute timeframe candlesticks and VWAP, can enhance the precision of trade entries and exits on or near these levels. It is crucial to recognize that these levels are not static, and they undergo alterations as market dynamics evolve.
The dashed lines on the chart indicate the reaction levels, serving as additional points of significance. Furthermore, take note of the response at the levels of the High, Low, and Close values from the day prior.
We trust that this information proves valuable to you.
* If you found the idea appealing, kindly tap the Boost icon located below the chart. We encourage you to share your thoughts and comments regarding it.
Wishing you successful trading endeavors!

Nifty levels - Jul 08. 2025Nifty support and resistance levels are valuable tools for making informed trading decisions, specifically when combined with the analysis of 5-minute timeframe candlesticks and VWAP. By closely monitoring these levels and observing the price movements within this timeframe, traders can enhance the accuracy of their entry and exit points. It is important to bear in mind that support and resistance levels are not fixed, and they can change over time as market conditions evolve.
The dashed lines on the chart indicate the reaction levels, serving as additional points of significance to consider. Furthermore, take note of the response at the levels of the High, Low, and Close values from the day prior.
We hope you find this information beneficial in your trading endeavors.
* If you found the idea appealing, kindly tap the Boost icon located below the chart. We encourage you to share your thoughts and comments regarding it.
Wishing you success in your trading activities!

BNB Stuck in Barrier Triangle?CRYPTOCAP:BNB appears to be in a macro wave 4 barrier triangle, and for some time.
It has held up particularly well during the alt coin massacre, not even reaching the .382 Fibonacci retracement.
Price is testing the upper boundary for the 4th time, that starts to give us the higher probability breakout which increases with each test. The daily 200EMA and pivot were tested as support successfully.
Safe trading.

$FET Ready for the next move up?NYSE:FET looks ready for the next move up with a similar analysis to many other alts I have shared.
It is breaking out of descending resistance after testing the .618 Fibonacci retracement and High Volume Node (HVN) as support. Price broke above the daily pivot and is now swinging below, a recovery above the local swing high will be a bullish signal to go long with a wave 3 target of the R3 daily pivot and major resistance HVN at $1.13.
Analysis is invalidated below $0.54
Safe trading

GOOGLE Count changed, Bullish outlook.I have adjusted NASDAQ:GOOG NASDAQ:GOOGL Elliot wave count with a wave 1 completing a leading diagonal backed up by a deep wave 2 correction into High Volume Node support (HVN). We potentially have another 1-2 with fast drop and recovery to the S1 daily pivot which would make long term outlook extra bullish by extending target.
Wave 3 is underway with a target of the all time hime high HVN for wave 5. The next resistance HVN is $191.
Price above the daily pivot and is continuing upwards after testing as support.
Analysis is invalidated below $162 swing low.
Safe trading

$HBAR Ready for a move up?CRYPTOCAP:HBAR appears to have completed its wave 2 WXYXZ complex correction
It has broken its descending resistance & daily pivot, retested both as support and is approaching the local swing high which would be a bullish long signal.
Cautious traders may want to take partial take profit at the first resistance High Volume Node and R1 pivot $.18 and a secondary target with good RR is the swing high resistance node at $0.22.
Analysis is invalidated below $.14 swing low.
Safe trading

XAUUSD 1H OUTLOOKBias For Today Remains Bullish. I will be expecting a bullish move to take out the liq. at 3342

$ETH Breakout this week?CRYPTOCAP:ETH local chart looks ready
I think were looking at a decent ETH breakout this week to the next resistance High Volume Node at $3600 minimum target.
👉 BTC is consolidating under all time high resistance after multiple tests which is usual a sign of bullish continuation. Usualy giving alts room to room.
👉 Ethereum is above the daily 200EMA, daily pivot and also consolidating under resistance once more after testing the 0.382 Fibonacci retracement and S1 daily pivot adding confluence to that being the local bottom. This appears to be Elliot wave 2, a shallow wave 2 retracement (less than 0.5) is a show of strength and investor impatience.
Analysis invalidated below the daily pivot and daily 200EMA as this will lock in 3 waves up and look corrective.
Safe trading

$NEAR Disappointing so far...CBOE:NEAR is disappointing me as it continues towards the lows
Testing the .786 alt-coin golden pocket High Volume Node so should see a decent reaction from here as it appears a an ABC correction is complete after an Elliot wave motif wave.
Safe trading

NAS100 - Stock market is waiting for tariffs!The index is above the EMA200 and EMA50 on the four-hour timeframe and is trading in its ascending channel. Maintaining the ascending channel will lead to the continuation of the Nasdaq's upward path to higher targets, but if it does not rise and corrects towards the demand limits, you can buy the Nasdaq index with appropriate reward and risk.
Three months ago, Donald Trump postponed the imposition of severe retaliatory tariffs, granting America’s major trading partners more time to reach new agreements that Washington views as “fairer.” Now, as the White House’s July 9 deadline approaches, only two official trade deals have been finalized—one with the United Kingdom and another with Vietnam. As for China, merely a fragile temporary truce has been reached, which has so far prevented any additional tariffs from being enforced.
Although reports suggest promising progress in negotiations with India, Japan, and South Korea, no final agreements have been secured with these countries yet. Interestingly, talks with the European Union—which had previously stalled—have suddenly taken a positive turn, and prospects for a deal with Canada in the coming days have also improved.
However, given the limited time left, it seems unlikely that trade agreements with all of America’s 18 key partners will be reached before the deadline. This situation has raised a critical question for the markets: Will Trump set a new deadline for the remaining countries, or will the suspended tariffs be reinstated?
The prevailing view is that the U.S. president will once again resort to threats before granting any extensions—this time not merely by reviving the “Liberation Day” tariffs, but also by promising even heavier tariffs to extract the last concessions from the remaining trade partners.
U.S. Treasury Secretary Scott Bassett stated that if no agreements are reached by August 1, tariffs will revert to the levels announced in April. He also emphasized that Washington’s core strategy in these trade talks is to apply maximum pressure. According to Bassett, letters will be sent to various countries, outlining the August 1 deadline for reaching deals. This news, which broke during the market’s closing hours, sparked a wave of risk appetite in the financial markets.
In a week when the U.S. economic calendar is notably devoid of major data releases, investors are focusing their attention on the minutes from the Federal Reserve’s June FOMC meeting—a document that could offer fresh insights into the trajectory of interest rates for the second half of the year.
June’s strong employment report, which exceeded market expectations, has effectively dashed hopes for an interest rate cut this month. Now, if the positive economic momentum persists, the likelihood of a rate cut in the September meeting may also gradually be priced out by the markets.
According to data from Challenger, Gray & Christmas, U.S. employers announced 47,999 job cuts in June, marking a sharp decline from 93,816 in the previous month. Compared to June of last year, layoffs have dropped by 2%. However, total job cuts in the second quarter of 2025 reached 247,256—a 39% increase from the same period last year (177,391) and the highest second-quarter layoff figure since 2020.
With no significant economic reports scheduled for the coming days, investors will be closely analyzing Wednesday night’s Fed minutes and the limited remarks from central bank officials—statements where every word has the potential to significantly move the markets.

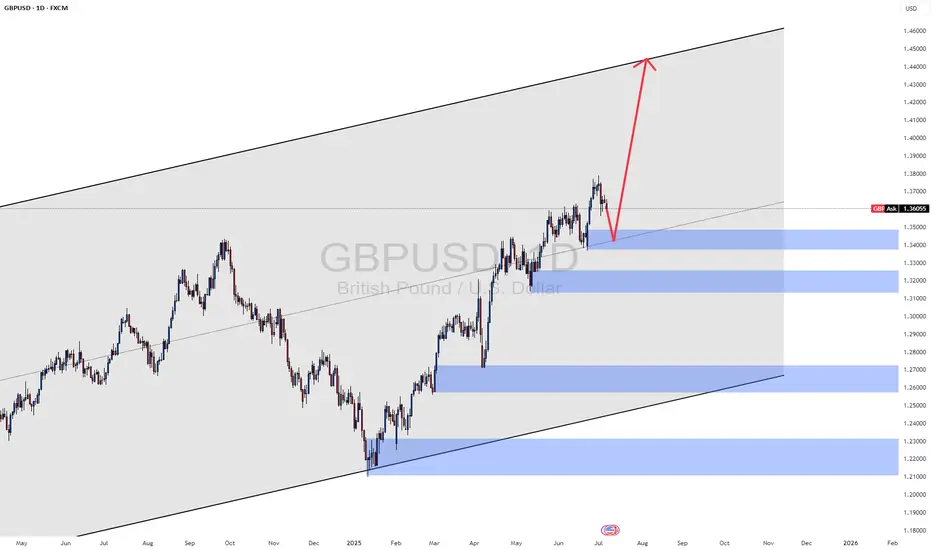
GBP/USD Pair Analysis📈 GBP/USD Pair Analysis – Monday, July 7, 2025
1️⃣ The pair is moving within an ascending price channel, indicating a continued positive trend in the medium term.
2️⃣ Strong demand areas have been identified on the larger time frames, which are expected to support the price in the event of a decline to these areas.
3️⃣ The MACD indicator is oversold, increasing the possibility of a rebound and upward movement from the current or nearby areas.
📌 Summary and Recommendations:
🔹 General Trend: Upward
🔸 The price is currently making a temporary downward correction.
✅ We expect the pair to rise again towards the upper limit of the price channel, provided it holds above the specified demand areas.
Bitcoin - Will Bitcoin record a new ATH?!Bitcoin is above the EMA50 and EMA200 on the four-hour timeframe and is in its medium-term ascending channel. Maintaining the specified support area will lead to the continuation of Bitcoin’s upward path and recording a new ATH. If it is corrected, we can look for Bitcoin buying positions from the specified demand zones.
It should be noted that there is a possibility of heavy fluctuations and shadows due to the movement of whales in the market and compliance with capital management in the cryptocurrency market will be more important. If the downward trend continues, we can buy within the demand area.
In recent days, Bitcoin has been stabilizing in a price range of around $107,000, with the market simultaneously witnessing a combination of short-term volatility and massive accumulation by institutional investors. A close examination of Bitcoin’s fundamental parameters shows that the market has entered a different phase than in the past; one that is no longer driven solely by momentary excitement, and that structured capital flows and on-chain data have formed its main axis. At the forefront of this trend are Bitcoin spot investment funds (Bitcoin ETFs), which reached their highest level of capital inflows in June. Total net inflows of these funds reached more than $4.5 billion last month, and on some days even approached more than $1 billion. Funds such as BlackRock’s IBIT and Fidelity’s FBTC now have billions of dollars in assets under management, a clear sign of increasing institutional participation in the Bitcoin market. These institutional investors are accumulating Bitcoin not with a short-term view, but with a long-term view and through legal means, which has reduced selling pressure and increased market stability.
On the other hand, the data from Anchin clearly shows that the market is in a steady accumulation trend. The amount of old Bitcoins held for more than 8 years experienced a significant growth of 5% in the second quarter of 2025. This statistic shows that long-term investors are not only reluctant to sell, but are still accumulating their assets. Also, the MVRV ratio, which indicates the relative profit or loss of the market, has decreased from 2.29 to 2.20, indicating mild and controlled profit taking by some investors, rather than widespread selling pressure or general panic. This rational behavior is a sign of market maturity and investors’ intelligence in managing short-term profits.
On-chain activity data also shows a similar trend. The average daily active addresses have reached around 1.02 million, indicating a decrease in market inflammation while maintaining overall dynamism. Other indicators such as Liveliness and Whale Accumulation also confirm that the amount of old transaction traffic has decreased and whales are mainly accumulating, not supplying. This trend is very valuable, especially in a market that has been far from explosive growth. From a macro perspective, the Bitcoin market is clearly in a consolidation and accumulation phase, but this consolidation is based on much stronger foundations than in previous periods. Institutional capital inflows via ETFs have reached over $50 billion, providing a strong foundation for continued growth. Also, some very old wallets that have been inactive for nearly 14 years have recently woken up and moved around $2 billion worth of Bitcoin. Although this could be a sign of potential supply, the market has not yet seen a significant negative reaction to it in the current market conditions and the market remains cautious.
Analysts believe that Bitcoin is in the third phase of its bullish cycle after the halving, which could bring gains of more than 120%. Some forecasts suggest a price range of $200,000-250,000 by the end of this year; however, the realization of such levels is subject to stable macroeconomic data, ETF performance and the absence of severe geopolitical shocks.
Finally, it can be said that the Bitcoin market has now reached a maturity where even periods of consolidation tend to strengthen its fundamentals rather than weaken the market. High-powered institutional investors are entering, whales continue to accumulate instead of selling, and long-term investors also see a bright outlook for the coming months. In this phase, price levels of $125,000 to $140,000 are likely by the end of the summer if the current trend continues, while in the event of severe economic or political pressures, key support for Bitcoin will be in the $95,000 to $100,000 range. Overall, Bitcoin is moving slowly but steadily towards higher targets, with stronger support than at any time in its history.

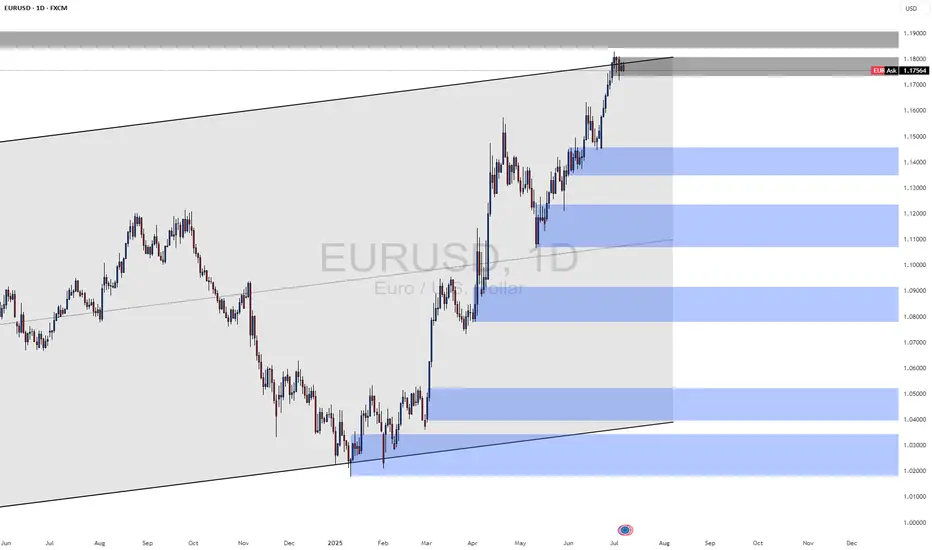
EUR/USD Pair Analysis📉 EUR/USD Pair Analysis – Monday, July 7, 2025
1️⃣ A clear ascending price channel on the daily chart defines the overall trend of the pair.
2️⃣ The price is currently touching the upper boundary of the channel, indicating a potential downward correction from the designated areas (in gray).
3️⃣ Strong demand areas have emerged at lower levels, which may support a subsequent upside move.
📌 Summary and Recommendation:
🔻 In the short term:
An opportunity to quickly sell the pair using scalping from the current areas, targeting nearby points.
🔺 In the medium to long term:
We prefer to wait for a decline to the lower boundary of the price channel, as we plan to buy from there, in line with the general uptrend.
#BTC Update #4 – July 7, 2025🟠 #BTC Update #4 – July 7, 2025
Bitcoin has been trading inside a supply zone , and its last impulsive move happened right into that area. While it tried to push higher again, I now see signs of rejection.
If this rejection holds, the first level I’m watching is $107,850 . Below that, there's a key support around $106,350 . Should this level break, we could see a deeper drop toward $102,650 , where an imbalance zone remains untested.
At the moment, short setups look more reasonable than longs but from a risk/reward perspective, I don’t see enough edge to take action yet. So for now, I’m not entering any position and will simply watch BTC’s next move .

XAUUSD – Monday, July 7th AnalysisGold is sitting on a knife’s edge as we enter the NY session.
Current price action:
Rejected twice at 3307 on the 4hr
Broke Friday’s low
Now approaching today’s low
Scenario 1 – Bearish:
Clean break below current 4hr low → target: 3274 (323 pips)
This is a key higher timeframe swing level, last tested in May
Scenario 2 – Bullish:
If we reject current lows and support forms →
First target: 3307 (170 pips)
Second target: 3344 (390 pips)
📌 Risk is balanced — both directions offer 300+ pips. Monitor structure + volume closely.

NQ Power Range Report with FIB Ext - 7/7/2025 SessionCME_MINI:NQU2025
- PR High: 23028.50
- PR Low: 22943.00
- NZ Spread: 191.25
No key scheduled economic events
First full trading day following long holiday weekend
Session Open Stats (As of 12:45 AM 7/7)
- Session Open ATR: 323.71
- Volume: 33K
- Open Int: 271K
- Trend Grade: Neutral
- From BA ATH: -0.6% (Rounded)
Key Levels (Rounded - Think of these as ranges)
- Long: 23239
- Mid: 21525
- Short: 20383
Keep in mind this is not speculation or a prediction. Only a report of the Power Range with Fib extensions for target hunting. Do your DD! You determine your risk tolerance. You are fully capable of making your own decisions.
BA: Back Adjusted
BuZ/BeZ: Bull Zone / Bear Zone
NZ: Neutral Zone

XAUUSD BUY 3260On the 4-hour chart, XAUUSD is currently fluctuating and falling, and the short-term market is expected to continue to fall. The current support below can be focused on around 3260, which is a potential buying position for the bullish bat pattern, and this position is also in the previous demand area.

TIA Coin: Unlock 118% Profit Potential (1D)From the point where we placed the red arrow on the chart, it appears the TIA correction has begun.
Despite the current bullish market trend, TIA has not yet experienced a pump, and it seems the price hasn't reached its bottom yet. This correction seems to follow a large, time-consuming diamond-shaped diametric pattern, and we are currently in the early or middle stages of wave G.
Recently, the price lost a minor trendline, marked with a red dotted line, indicating that wave G might continue its path.
We have identified a low-risk buy zone on the chart for catching the next bullish wave in TIA. We are targeting buy/long positions in this zone.
Price targets are clearly indicated on the chart.
A daily candle close below the invalidation level will invalidate this analysis and suggest a potential reversal.
invalidation level: 1.089$
For risk management, please don't forget stop loss and capital management
When we reach the first target, save some profit and then change the stop to entry
Comment if you have any questions
Thank You
