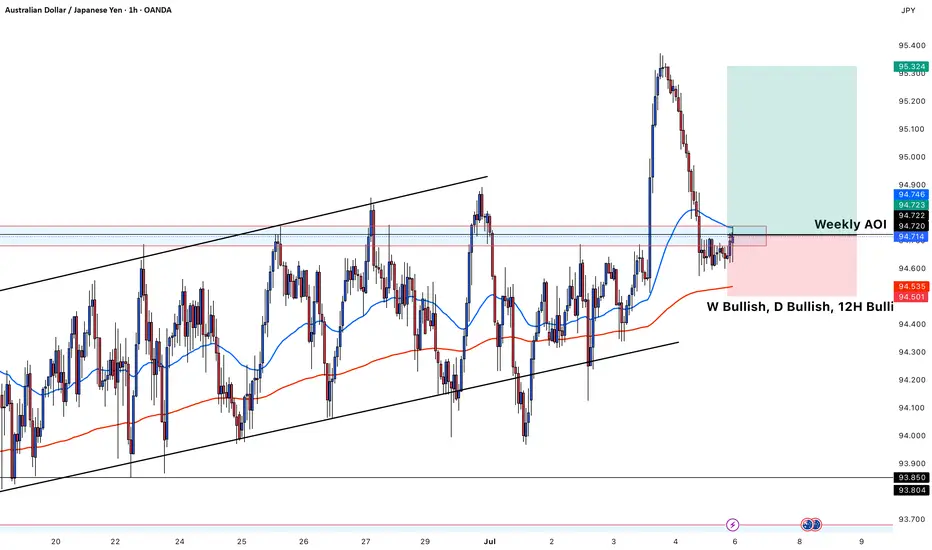
chart shows a Long setup on AUD/JPY based on multi-timeframeThis chart shows a **buy setup on AUD/JPY** based on multi-timeframe bullish confluence and a key structure level. Here's a breakdown of the idea:
---
### 🟢 **Trade Type:** Buy
### 📈 Pair: AUD/JPY (1H Chart)
---
### ✅ **Technical Confluences:**
* **Trend Bias:**
* **Weekly (W): Bullish**
* **Daily (D): Bullish**
* **12H: Bullish**
* **Structure:**
* Price retraced into a **Weekly Area of Interest (AOI)** marked in blue and red zone.
* It bounced off the lower trendline of the ascending channel.
* Price is currently forming higher lows near the support of the AOI.
* **Indicators:**
* The **50 EMA (blue)** and **200 EMA (red)** are holding as dynamic support, especially the 200 EMA just below current price.
* EMAs show bullish alignment (short-term EMA above long-term EMA).
* **Candle Action:**
* Price rejected the AOI and is trying to push higher.
* The bullish engulfing near the EMA zone confirms buy interest.
---
### 🟦 **Entry Zone:**
* Around **94.70–94.72**, aligned with the Weekly AOI and just above 200 EMA.
### 📍 Stop Loss:
* Below the red support zone, around **94.50–94.53**, under 200 EMA and key rejection wick.
### 🎯 Take Profit:
* Around **95.30–95.32**, targeting the previous swing high for a favorable risk-reward ratio.
---
### 📊 Summary:
This is a bullish continuation trade, buying from a retracement into a strong support zone with higher timeframe bullish structure and clear confirmation through price action and EMA alignment.
Supply and Demand
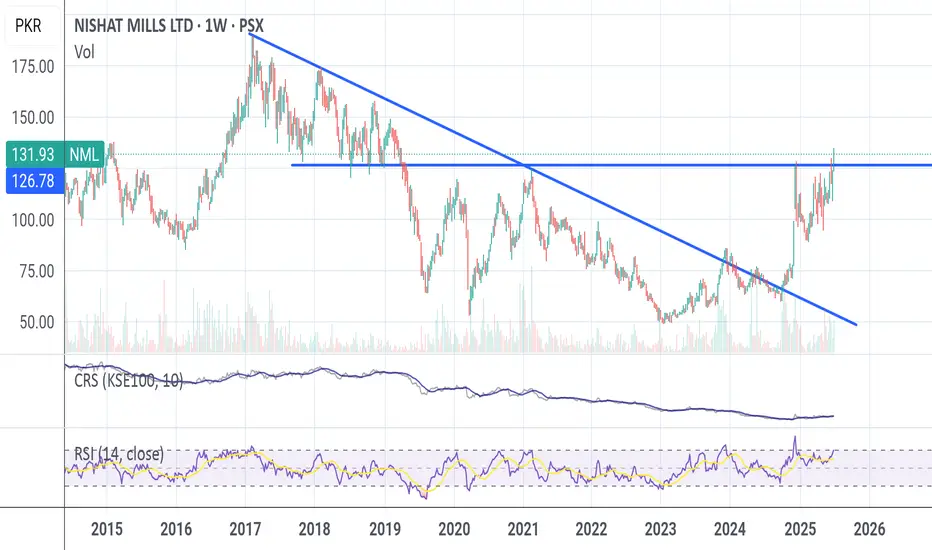
NMLStarting to move high from key polarity zone. Just like other textile companies, this one also looks good.
THE KOG REPORTTHE KOG REPORT:
In last week’s KOG Report we said we would ideally be looking for price to attempt lower and reject at the red box giving us the opportunity to long back up into the key levels following the red box and Excalibur targets. We did open with a huge spike down, into the 2nd region we wanted and managed to the move we giving us a great start to the week. As you can see on last week’s chart we broke above the red box which meant shorting was not on the cards, and a continuation into the next level would be a preferable trade, also working well. The NFP bias was bearish below the red box, again, tap and bounce from Excalibur giving the move downside, but not completing at the level we initially wanted.
Not a bad week at all in Camelot.
So, what can we expect in the week ahead?
For this week we would expect cleaner price action but there isn’t a lot of news so we may see some ranging and sudden burst of volume which will be needed to drive price out of the range.
We have support at the 3330 level and the extension level which is around 3210, which if spiked and held, should give us a move into the higher red box level and resistance 3345-50. There is another extension level above, 3360-65, which, if there was a bias this week would be the bearish below level. This level, if approached needs to be watched carefully for a potential RIP and needs to be broken for us to see higher pricing in gold.
Volume indicators are suggesting a potential pull back on the open, so let’s see if we can find that support and as long as we don’t break below 3310-6 we may just see a more range play between 3365 resistance and 3310 support.
It’s a bit conflicting on the charts this week which is why we’ll say let’s play it day by day and we’ll update every one as we go through the week.
RED BOX TARGETS:
Break above 3350 for 3355, 3360, 3362, 3365, 3374, 3388 and 3396 in extension of the move
Break below 3335 for 3331, 3324, 3321, 3310, 3306 and 3293 in extension of the move
Please do support us by hitting the like button, leaving a comment, and giving us a follow. We’ve been doing this for a long time now providing traders with in-depth free analysis on Gold, so your likes and comments are very much appreciated.
As always, trade safe.
KOG

POWL energy expansion playPowl I just discovered and after reviewing the chart it looks very bullish. I have also reviewed the company website and fundamentals both look great. They have expanding margins and earnings this is likely to tariff related backlogs of electrical switchboards and other products. Given that Powell Energy is American made, this is a tailwind for them. Energy expansion is currently my number one thesis, followed closely by a secular Ai like wave in robotics. I am looking at this play for a near-term 300$ target.
My plan:
I need to research more, but might get my foot wet with a few shares and some CSP

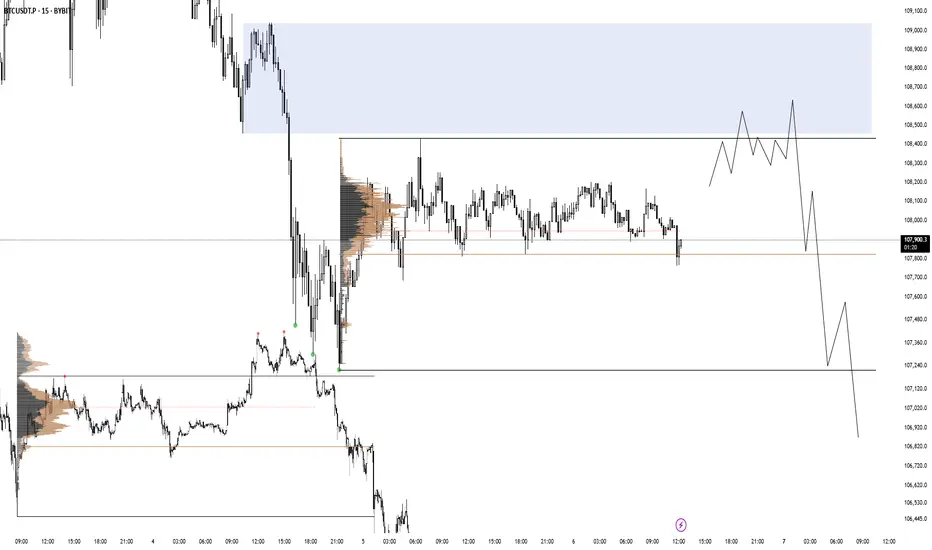
BTC: 650 Point Long Trade To 108,650$ (Date: Sat 05 Jul 25)High potential signal as my all signals. Don't miss this opportunity. At least open a trade in demo just to test.
Details:
Entry: Now - 108,100 $
Target Price: 108,650 $
Stop loss: 107,700 $
Trade Ideas:
There is a flag pattern here after a good down trend. So here is possibility for a small pull back till my target price.
Trade Signal:
I provide trade signals here so follow my account and you can check my previous analysis regarding BITCOIN. So don't miss trade opportunity so follow must.
BINANCE:BTCUSDT BINANCE:BTCUSDT.P BYBIT:BTCUSDT.P

Natural Gas is in the Buying DirectionHello Traders
In This Chart NATGAS HOURLY Forex Forecast By FOREX PLANET
today NATGAS analysis 👆
🟢This Chart includes_ (NATGAS market update)
🟢What is The Next Opportunity on NATGAS Market
🟢how to Enter to the Valid Entry With Assurance Profit
This CHART is For Trader's that Want to Improve Their Technical Analysis Skills and Their Trading By Understanding How To Analyze The Market Using Multiple Timeframes and Understanding The Bigger Picture on the Charts

GBPAUD Selling Trading IdeaHello Traders
In This Chart GBP/AUD 4 HOURLY Forex Forecast By FOREX PLANET
today GBP/AUD analysis 👆
🟢This Chart includes_ (GBP/AUD market update)
🟢What is The Next Opportunity on GBP/AUD Market
🟢how to Enter to the Valid Entry With Assurance Profit
This CHART is For Trader's that Want to Improve Their Technical Analysis Skills and Their Trading By Understanding How To Analyze The Market Using Multiple Timeframes and Understanding The Bigger Picture on the Charts

GBCHF Will Fly from a Old support LevelHello Traders
In This Chart GBPCHF HOURLY Forex Forecast By FOREX PLANET
today GBPCHF analysis 👆
🟢This Chart includes_ (GBPCHF market update)
🟢What is The Next Opportunity on GBPCHF Market
🟢how to Enter to the Valid Entry With Assurance Profit
This CHART is For Trader's that Want to Improve Their Technical Analysis Skills and Their Trading By Understanding How To Analyze The Market Using Multiple Timeframes and Understanding The Bigger Picture on the Charts

Interesting swing buy opportunity in EURGBP! Don’t miss out!A potential swing low is spotted around the price level of 0.85275 Technically, I am looking forward to seeing price fallback to a swing low so as to buy low. Potential take profit level is at recent swing high. Overall trend of the market remains bullish both on monthly & weekly.

GBPNZD chart suggests a potential long (buy) setupThis GBPNZD chart suggests a **potential long (buy) setup**, but only **after confirmation** via a **break of structure**, as indicated. Here's a full breakdown of the bullish scenario:
---
### 🧠 **Multi-Timeframe Analysis Bias**
* **Weekly: Bearish**
* **Daily: Bearish**
* **12H: Bullish**
* **6H: Mixed (Bearish & Bullish)**
* **4H: Bearish**
* ✅ Overall: **60% Bearish Bias** — but short-term strength is visible.
This means the trade is **counter-trend** on higher timeframes, but has potential due to **short-term structure shift**.
---
### 🧱 **Technical Structure – Inverse Head & Shoulders**
* A **bullish reversal pattern** is forming:
* **Left Shoulder**, **Head**, and **Right Shoulder** identified.
* Entry is planned **only after a clear break of the neckline** (resistance zone), confirming bullish momentum.
---
### 📍 **Key Zones**
* **Neckline / Resistance Zone**: \~2.2525–2.2565 — key level to break for confirmation.
* **Entry** is anticipated after a **successful breakout** and **bullish retest**.
* **Target**: Daily AOI around **2.2727–2.2739**.
* **Stop Loss**: Below the right shoulder, \~2.2507 or lower.
---
### 🧰 **Indicators and Confluences**
* Price is approaching both the **50 EMA** (blue) and **200 EMA** (red).
* A **break above these EMAs and structure** would likely trigger momentum buying.
* Right shoulder formed cleanly inside a **support zone**, providing a valid base for continuation.
---
### 💡 **Buy Trade Idea Summary**
* **Wait for confirmation**: break above 2.2565 structure.
* **Enter on retest** of broken neckline zone (blue arrows path).
* **Target**: 2.2727–2.2739 (Daily AOI).
* **Stop**: Below right shoulder (2.2500–2.2510).
* **Risk/Reward**: Favorable based on projected move and structure.

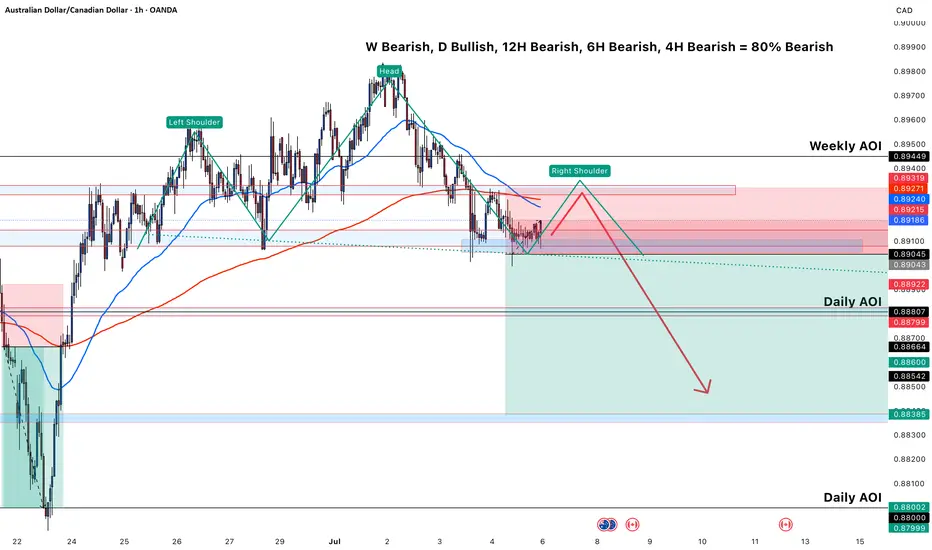
AUD/CAD chart shows a **clear bearish bias**This AUD/CAD chart shows a **clear bearish bias** supported by multiple timeframes and a head and shoulders pattern forming, which justifies a potential **sell setup**. Here's a breakdown of the reasoning:
---
### 🧠 **Multi-Timeframe Analysis Bias**
* **Weekly: Bearish**
* **Daily: Bullish**
* **12H, 6H, 4H: Bearish**
* ✅ Overall: **80% Bearish Bias**
This gives confidence that **lower timeframes** are aligning to favor a **short trade**.
---
### 🧱 **Technical Structure – Head & Shoulders**
* **Left Shoulder**, **Head**, and **Right Shoulder** are identified.
* The **Right Shoulder is projected to complete** near the **Weekly Area of Interest (AOI)**.
* This structure is a **classic bearish reversal pattern**, suggesting a potential breakdown after the right shoulder forms.
---
### 📍 **Key Zones**
* **Weekly AOI (0.89271–0.89449)**: Strong supply zone; potential area for **price rejection**.
* **Daily AOI (0.88002–0.88709)**: Key downside target, aligning with prior demand zones.
---
### 🧰 **Indicators and Confluences**
* **Price is below the 50 EMA and testing the 200 EMA**, indicating weakening bullish momentum.
* Bearish price action is forming near resistance.
* Entry is planned after the right shoulder forms, respecting structure.
---
### 🧨 **Sell Trade Idea Summary**
* **Sell after the right shoulder completes around 0.892–0.894**
* **Target**: Daily AOI (especially near 0.8800–0.8838)
* **Stop Loss**: Above the head (likely above 0.8950)
* **Risk/Reward**: Appears favorable (>2:1 based on projection)
H4 STRUCTURAL LOOK OF GBPCADFrom the H4 market outlook. We’re seeing price reacting around a key level 1.85196. If we’d see price break above 1.85854 and lower trend of the emerging downward channel, we’d be going long

BTC 06.07.25There is a range imbalance with no price action in discount after BTC accumulated on friday afternoon. I am looking for a valid distribution like in the picture on the left.
BITCOIN ANALYSIS - What's Next for for BTC?🎯 KEY LEVELS DECODED
🛡️ FORTRESS SUPPORT: $102,800 - $103,200
_____________________________
NEUTRAL STRATEGY:
Buy Zone: $102,800 - $102,600
Sell Zone: $110,000 - $112,000
Stop Loss: $100,500 (range breakdown)
Target: Opposite end of range
Position Size: 3-5% of portfolio
_____________________________
🎢 SCENARIO : (Probability: 35%)
If BTC consolidates between $102K-$108K :
Range-bound trading for 2-3 weeks
Accumulation phase before next major move
Key levels: Buy $102K, Sell $110K
_________________________
🛡️ RISK MANAGEMENT 🚨 DISCLAIMER 🛡️ DYOR

EURUSD: Support & Resistance Analysis For Next Week 🇪🇺🇺🇸
Here is my recent structure analysis and important
supports and resistances for EURUSD for next week.
Consider these structures for pullback/breakout trading.
❤️Please, support my work with like, thank you!❤️
I am part of Trade Nation's Influencer program and receive a monthly fee for using their TradingView charts in my analysis.

GOLD (XAUUSD): Support & Resistance Analysis For Next Week
Here is my latest structure analysis
and important supports and resistances for Gold for next week.
Resistance 1: 3356 - 3368 area
Resistance 2: 3391 - 3403 area
Resistance 3: 3443 - 3452 area
Resistance 4: 3493 - 3501 area
Support 1: 3230 - 3274 area
Support 2: 3120 - 3177 area
Consider these structures for pullback/breakout trading.
❤️Please, support my work with like, thank you!❤️
I am part of Trade Nation's Influencer program and receive a monthly fee for using their TradingView charts in my analysis.

VISHNUSURYA INFRA techno-funda analysisVishnusurya Projects & Infra Ltd. is a Chennai-based construction and infrastructure company involved in civil contracting, roadwork, bridges, and earthmoving services. It also undertakes bitumen supply and mining contracts for state and national authorities. The stock is currently trading at ₹178.65 after a strong recovery from its recent base and is beginning to show structural trend formation.
Vishnusurya Projects & Infra Ltd. – FY22–FY25
Snapshot Sales – ₹232 Cr → ₹276 Cr → ₹321 Cr → ₹367 Cr – Consistent growth, healthy execution pipeline
Net Profit – ₹4.8 Cr → ₹7.1 Cr → ₹10.6 Cr → ₹14.8 Cr – Accelerating profitability, scale benefits emerging
Company Order Book – Moderate → Moderate → Strong → Strong – Increasing traction from infra contracts Dividend Yield (%) – 0.00% → 0.00% → 0.00% → 0.00% – No distributions, reinvestment-focused
Operating Performance – Weak → Moderate → Moderate → Moderate – Improving EBITDA visibility
Equity Capital – ₹27.55 Cr (constant) – Stable ownership base
Total Debt – ₹92 Cr → ₹88 Cr → ₹81 Cr → ₹75 Cr – Deleveraging progressing cautiously
Total Liabilities – ₹184 Cr → ₹196 Cr → ₹210 Cr → ₹225 Cr – Proportionate to execution scale
Fixed Assets – ₹88 Cr → ₹94 Cr → ₹101 Cr → ₹108 Cr – Ongoing capex to support order execution
Latest Highlights
FY25 net profit rose 39.6% YoY to ₹14.8 Cr; revenue up 14.3% to ₹367 Cr
EPS: ₹5.37 | EBITDA Margin: 13.6% | Net Margin: 4.03%
Return on Equity: 9.74% | Return on Assets: 6.58%
Promoter holding: 72.08% | Dividend Yield: 0.00%
Major road and civil contracts under execution in Tamil Nadu and Andhra Pradesh
Continued capex toward machinery, bitumen handling, and project mobility infrastructure
Technical Snapshot Vishnusurya is trading at ₹178.65 with an RSI of 50.76, showing early-stage trend strength near a long-term base. Volume activity is increasing steadily, pointing to institutional accumulation. Support levels are visible near ₹222.92, ₹156.98, and ₹273.60, while upside breakout zones exist at ₹397.60, ₹463.50, and ₹547.50 if the upward trend sustains.
Business Growth Verdict Yes, Vishnusurya is expanding its business on solid foundations
Profitability and margins are strengthening with better project mix
Debt is being managed conservatively amid revenue growth
Fixed asset expansion is paced well with project pipeline visibility
Final Investment Verdict Vishnusurya Projects & Infra Ltd. offers a compelling infrastructure turnaround story from the South Indian EPC space. The company’s rising revenue, expanding margins, and stable debt profile suggest disciplined execution and improving scale efficiency. Although dividend returns are absent, the reinvestment approach underlines long-term growth intent. For investors seeking a high-ROA infra bet with rising order flow and technical momentum, this stock merits active tracking for staggered accumulation.

Anticipating MNMD bull break, but large overhead supply remainsMNMD is looking good on the daily chart for a bull break from it's currently daily equilibrium, but it still remains far from it's weekly and monthly resistance levels that ATAI has already cleared. I do anticipate MNMD to benefit from the GO signal from ATAI but the additional overhead supply may remain an obstacle until we get through it, either through grinding price action or a news catalyst specific to MNMD.
Entry: 6.77
Stop loss: 6.27

CMPS big 55% bounce after big crash on partial read outCMPS crashed two weeks ago down 50% on market reaction to initial readout for an ongoing trial, and has since bounced 55%. I bought the dip at 2.61 inside an hourly equilibrium with a close by stop and now just letting this position play out, hopefully for months as I anticipate hype to return to the sector now that ATAI gave the GO signal we've been waiting years for.
Entry: 2.61
50% stop loss: 2.55
50% stop loss 2.05

ATAI breaks out of three year channel on massive volumeATAI had a big breakout last week on positive market reaction to news, and is trading at the highest levels in 3 years. This is the first monthly trend change in the history of this stock (and maybe even the psych sector!) and I'm anticipating this to continue playing out as hype slowly returns to the sector. this is a small cap and a little volume on this can go a long way. Entry: 2.15, stop loss 1.95

GOLD - POTENTIALLooking at gold. Its still in a bit of limbo after the NFP reaction on Friday. However it is looking like the draw on liquidity is higher. Therefore my bias on gold for the start of the week is bullish so will be looking to get the most optimal entry to take some buys to the upside.
If we can manage to find a decent enough move price really could rally upwards.

July 7 - 11: Buy Stock Indices DIPs! Watch For Gold, Oil FVGs!In this Weekly Market Forecast, we will analyze the S&P 500, NASDAQ, DOW JONES, Gold and Silver futures, for the week of July 7 - 11th.
Stock Indices are strong, so dip opportunities should present themselves next week.
Gold is bullish-neutral. Could see strength enter this market as July 9th approaches.
Silver is bullish. No reason to short it.
Oil is in a Monthly +FVG. If the FVG fails, it will confirm bearishness. Couple that with the fundamentals, I am watching for that confirmations to sell US Oil.
Enjoy!
May profits be upon you.
Leave any questions or comments in the comment section.
I appreciate any feedback from my viewers!
Like and/or subscribe if you want more accurate analysis.
Thank you so much!
Disclaimer:
I do not provide personal investment advice and I am not a qualified licensed investment advisor.
All information found here, including any ideas, opinions, views, predictions, forecasts, commentaries, suggestions, expressed or implied herein, are for informational, entertainment or educational purposes only and should not be construed as personal investment advice. While the information provided is believed to be accurate, it may include errors or inaccuracies.
I will not and cannot be held liable for any actions you take as a result of anything you read here.
Conduct your own due diligence, or consult a licensed financial advisor or broker before making any and all investment decisions. Any investments, trades, speculations, or decisions made on the basis of any information found on this channel, expressed or implied herein, are committed at your own risk, financial or otherwise.

July 7 - 1th: Sell The RIPs, Buy The DIPs! (PART 1)This is Part 1 of the FOREX futures outlook for the week of July 7 - 11th.
In this video, we will analyze the following FX markets:
USD Index, EUR, GBP, AUD, NZD, & CAD.
Last Friday was a bank holiday, so the price action is discounted. This Monday has no red folders on the calendar, so the environment is set for a day of misdirection. Be careful to take only trades that confirm your directional bias!
USD is still weak, and analyst have determined the FED will put off cutting rates until September. Tariffs wars may start up again July 9th. And Trumps Bill can add 3+ trillion to the debt.
None of this supports the USD!
Look to buy the dips xxx USD, and look to sell the rips vs USD xxx.
Enjoy!
May profits be upon you.
Leave any questions or comments in the comment section.
I appreciate any feedback from my viewers!
Like and/or subscribe if you want more accurate analysis.
Thank you so much!
Disclaimer:
I do not provide personal investment advice and I am not a qualified licensed investment advisor.
All information found here, including any ideas, opinions, views, predictions, forecasts, commentaries, suggestions, expressed or implied herein, are for informational, entertainment or educational purposes only and should not be construed as personal investment advice. While the information provided is believed to be accurate, it may include errors or inaccuracies.
I will not and cannot be held liable for any actions you take as a result of anything you read here.
Conduct your own due diligence, or consult a licensed financial advisor or broker before making any and all investment decisions. Any investments, trades, speculations, or decisions made on the basis of any information found on this channel, expressed or implied herein, are committed at your own risk, financial or otherwise.
