#USDCHF: Will USD Breakthrough The Strong Bearish Downtrend? The USDCHF currency pair has experienced significant volatility due to the ongoing trade dispute between the United States and China, which has led to a substantial decline in the DXY index. Consequently, CHF and JPY have emerged as the most stable currencies in the market.
Despite the USDCHF currency pair reversing its bullish trend, we anticipate a potential reversal back to a bearish position. We believe this reversal may be a temporary trap, and the currency pair is likely to regain its bullish position in the future.
There are two potential areas where the USDCHF currency pair could reverse from its current trend. The first area is relatively early, and if the USDCHF currency pair crosses a specific region, we may have a second safe option that could provide greater stability.
We extend our best wishes and best of luck in your trading endeavours. Your unwavering support is greatly appreciated.
If you wish to contribute, here are several ways you can assist us:
- Like our ideas
- Comment on our ideas
- Share our ideas
Team Setupsfx_🚀❤️
Supply and Demand

What’s likely to happen next on Gold after the NFP crashed pricePrice was trading bullish above the 200EMA until the NFP report that unfortunately crashed price by -1.4% and price hasn’t been able to fill in the FVG caused by the news report. Going to the new week, traders are concerned about what’s next to happen. Are we likely to see bullish price action continuing or we are going to see a complete reversal in price. We’re still having bullish sentiment on gold but we’re only going to execute buys only when price starts to close above the key level of $3360.00 which is intraday high. Until then , price can easily crash lower.

#BTC Update #3 – July 5, 2025🟠 #BTC Update #3 – July 5, 2025
Bitcoin is currently in a corrective phase following its latest impulsive move. To confirm that the correction is complete, I’d need to see a fresh impulsive leg. Until then, price may continue to pull back .
Looking at the liquidation heatmap, I’m seeing stacked liquidity between $107,100 and $106,500 . Based on that, I wouldn’t be surprised to see BTC wick down toward $106,000, sweep that zone, and potentially initiate a long-biased impulsive bounce.
If that bounce materializes, my first target is the $110,000 region . It’s also worth noting that Bitcoin is currently sitting inside a supply zone, which could add short-term resistance before any breakout.

Buy above 817 fast target 873Everything mention about in my chart
buy price range cmp -811.85
stop loss - 797 day closing
fast target - 873
I am not sebi reg
is my own idea only

DXY (Dollar Index) longs to shortsThe dollar has been bearish for several weeks, but we’re now starting to see signs of a potential retracement due to price being in oversold territory. Last week, DXY reacted from a key weekly demand level, suggesting that we could see some short-term bullish movement before any continuation to the downside.
I’ll be watching closely for price to either push higher into liquidity or retrace slightly deeper into more discounted demand zones for a cleaner long setup. This would also align with my short setups across other major pairs, making DXY strength a key narrative this week.
Confluences for DXY Longs:
DXY has been bearish for an extended period — now showing signs of accumulation on higher timeframes
Price may retrace upwards to collect liquidity before continuing its macro downtrend
Recently reacted from a major weekly demand zone
Imbalances and liquidity above, including Asia highs, remain untapped
P.S. If price fails to react from any of my current POIs, I’ll patiently wait for new zones to develop and adjust accordingly — always staying aligned with what price tells us.
Let’s stay sharp and crush the week ahead!

GRT/USDT: The Graph's Phoenix Rising - A Technical Deep Dive🎯 The Trading Strategy : ⚠️ The Reality Check
Let's be honest - this trade isn't without risks...
Entry Strategy:
The Golden Support Zone : 0.05-0.055 (ALL TIME LOW levels)
⚡Target 1: $0.11
⚡Target 2: $0.13
⚡Target 3: midlle of 1W FVG
🔥 Risk/Reward: 4:1 🔥
_________________
Risk Management:
Stop Loss: 0.048 (Below major support)
Trade smart, trade safe, and may the charts be ever in your favor! 🚀
🚨 RISK WARNING 🛡️ DYOR 🚨 DISCLAIMER - JUST FOR EDUCATION PROPOSAL ⚠️

EUR/USD breakout awaiting EUR/USD has not provided a clear structure over the past week or two. The pair appears to be in consolidation, building liquidity on both sides of the current range. At the moment, I’m waiting for a decisive breakout, ideally followed by distribution within the monthly supply zone, although that zone is still some distance away.
This week, my focus will be on whether a new supply zone forms, closer to current price. If price sweeps the nearby equal highs and then shows signs of reversal, this could give us a fresh supply area to work from. Alternatively, if price moves lower, I’ll be looking at the 8-hour demand zone around 1.16000 for a possible long setup.
Confluences for EUR/USD:
- Although price has been slightly bullish, the current consolidation phase suggests a potential reversal could be on the horizon.
- Liquidity is building on both sides of the range, making a reaction from the monthly supply zone increasingly probable.
- There’s significant downside liquidity still untapped, such as Asia session lows, which could serve as short-term targets.
- For clearer confirmation, we still need a decisive break in market structure to the downside.
P.S. If price sweeps the lower liquidity and moves into the 8-hour demand zone near 1.16000, I will be watching for accumulation to form and signs of bullish intent from there.

#SOL Update #2 – July 5, 2025🔴 #SOL Update #2 – July 5, 2025
Yesterday, I mentioned that Solana was at a critical level and not suitable for long or short entries. I also noted that I’d stay in watch mode and that hasn’t changed.
Right now, SOL is trying to hold above the support box, but volume remains quite low. Even worse, footprint data is showing negative pressure. If SOL loses the $144.5 level, I expect a move toward the $137–136 zone, as mentioned in my previous update.
Let’s also not forget that the $150 area is a strong resistance. At this stage, I don’t see any high-probability setup on either side. I’m still watching. No trade for now.

#BTC Update #2 – July 5, 2025🟠 #BTC Update #2 – July 5, 2025
I still see $112,000 as Bitcoin’s next major target. That said, the $110,000 zone continues to offer strong resistance, and price hasn’t managed to break through it with conviction yet.
If BTC can’t clear $110K with momentum, I expect a potential pullback. For now, I consider price action to be stuck in a decision zone. Without a clean breakout above $110K, I wouldn’t be surprised to see a deeper correction before any meaningful upside continues.

GOLD LIQUIDITY MASTERCLASS: The Smart Money Playbook Revealed🧠 INSTITUTIONAL MINDSET
At $3,365: "Perfect! Time to sell into retail buying"
At $3,337: "Let's see how this plays out"
At $3,318: "Preparing for the hunt"
At $3,270: "Starting to accumulate"
At $3,245: "Loading the truck! This is what we've been waiting for"
🔍 LIQUIDITY ZONES DECODED: The Hidden Treasure Map
🎯 BELLOW SELL IF CLOSE CONFIRMED: $3,318
Significance: Close below = bears take control
Time Frame: 4H close confirmation needed
________________
🛡️ BUY ZONE & 1H OB: $3,270
The Fortress: Major institutional buy zone
Order Block Significance: 1H order block provides additional support
Risk/Reward Sweet Spot: Excellent entry for swing positions
_______________
⚡ BUY ZONE + ADD CONFIRMATION LIQUIDITY SWEEP: $3,245
The Ultimate Accumulation Zone: Where smart money loads up
_________ 🎯 STRATEGY _________
Entry: $3,238-$3,2440 (after liquidity sweep confirmation)
Stop Loss: $3,230 (below the sweep low)
Target 1: $3,290 (Risk:Reward 1:3)
Target 2: $3,320 (Risk:Reward 1:5)
Target 3: $3,365 (Risk:Reward 1:8)
🚨 RISK WARNING 🛡️ DYOR 🚨 DISCLAIMER - JUST FOR EDUCATION PROPOSAL ⚠️

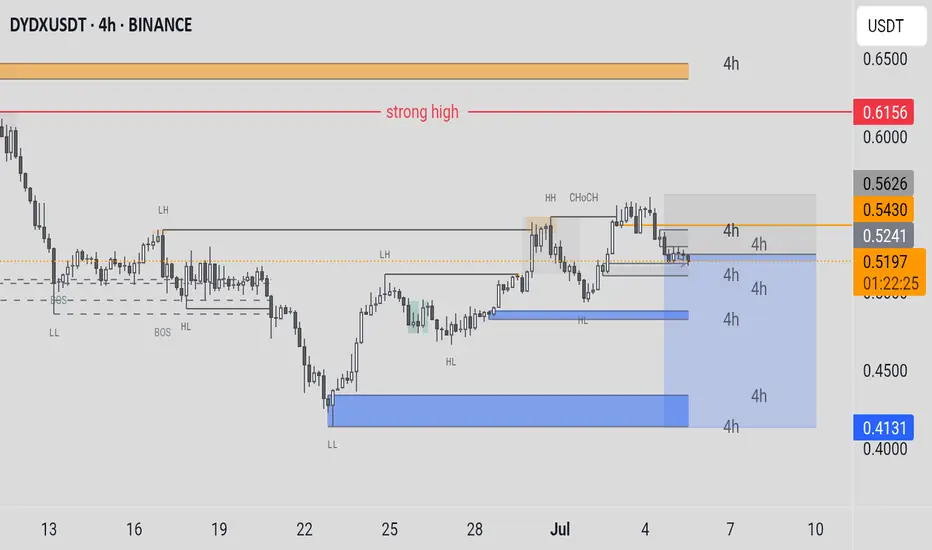
DYDXUSDT Price Levels: The current price is around 0.6030 USDT. The chart highlights a "strong high" resistance level near 0.5626, with higher highs (HH) and change of character (CHOCH) noted recently.Support and Resistance:Support zones are marked around 0.5199, 0.5253, and a lower support (HL) around 0.4500.Resistance is indicated near the "strong high" and higher levels up to 0.5626.Trends: The price recently broke above a previous high (LH) and formed a higher high, suggesting bullish momentum. However, it’s approaching a resistance zone.Volume and Patterns: The chart includes annotations like "BOS HL" (Break of Structure Higher Low), indicating a potential shift in trend.
Cryptocurrency Futures Market Disclaimer 🚨🚨🚨
Trading cryptocurrency futures involves high risks and is not suitable for all investors.
Cryptocurrency prices are highly volatile, which can lead to significant gains or losses in a short period.
Before engaging in crypto futures trading, consider your risk tolerance, experience, and financial situation.
Risk of Loss: You may lose more than your initial capital due to the leveraged nature of futures. You are fully responsible for any losses incurred.
Market Volatility: Crypto prices can fluctuate significantly due to factors such as market sentiment, regulations, or unforeseen events.
Leverage Risk: The use of leverage can amplify profits but also increases the risk of total loss.
Regulatory Uncertainty: Regulations related to cryptocurrencies vary by jurisdiction and may change, affecting the value or legality of trading.
Technical Risks: Platform disruptions, hacking, or technical issues may result in losses.
This information is not financial, investment, or trading advice. Consult a professional financial advisor before making decisions. We are not liable for any losses or damages arising from cryptocurrency futures trading.
Note: Ensure compliance with local regulations regarding cryptocurrency trading in your region.
thanks for like and follow @ydnldn to have more information outlook and free signal.
About me :
"I am a passionate swing trader focused on analyzing financial markets to capture profit opportunities from medium-term price movements. With a disciplined approach and in-depth technical analysis, I concentrate on identifying trends, support-resistance levels, and price patterns to make informed trading decisions. I prioritize strict risk management to protect capital while maximizing profit potential. Always learning and adapting to market dynamics, I enjoy the process of refining strategies to achieve consistency in trading."
GBP/USD Potential Shorts from 1.37000This week, my analysis for GBP/USD focuses on the continuation of the bearish order flow. I currently have a clean 16-hour supply zone that remains unmitigated, where we may see a potential bearish reaction in alignment with the prevailing downtrend. If price breaks through this zone, I will shift focus to an extreme 2-hour supply zone higher up.
There are several imbalances and pools of liquidity resting below that serve as potential downside targets. Additionally, I’m noticing the formation of engineered liquidity beneath current price, which further supports the bearish outlook.
Confluences for GBP/USD Sells:
The U.S. Dollar has reacted from a strong demand zone, suggesting we could see continued bullish pressure on the dollar, which may weigh on GBP/USD.
GBP/USD has shown a clear change of character to the downside, confirming bearish market structure—this is a pro-trend trade setup.
We have both a clean 16-hour and an extreme 2-hour supply zone, offering high-probability entry points for potential shorts.
Multiple liquidity targets below, including Asia session lows and unfilled imbalances, align well with the bearish narrative.
P.S. My next potential long opportunity lies at the 6-hour demand zone near 1.34400. From there, I’ll be watching for price to slow down, accumulate orders, and potentially shift structure to the upside.
Wishing everyone a successful and profitable trading week!

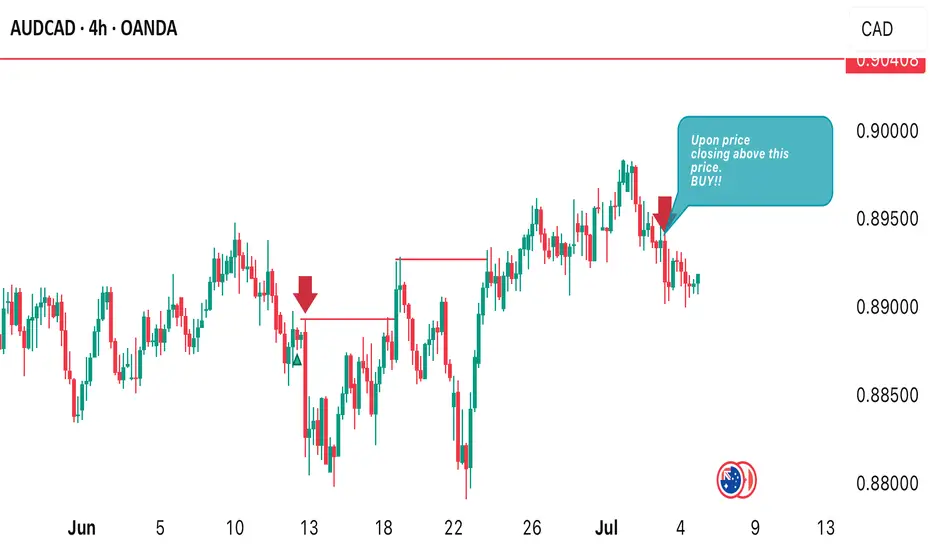
AUDCAD INTRADAY TIMEFRAME IS QUITE BULLISHPrice has completely shifted from intraday bearish to bullish. I anticipate more. Bullish price action to develop in later days of coming week. I am positioning myself for a buy opportunity. Once I see price close above 0.89413 I’m going long!
XAU/USD possible shorts from 3,350 towards 3,290 longsThis week, my focus is on a potential sell setup that could form within the 4-hour supply zone, which is currently near price. I’ll be patiently watching for signs of Wyckoff distribution within this point of interest (POI), which could confirm a short opportunity.
Given that price action has been bearish, this would be a pro-trend setup, especially with the visible liquidity resting below that we can look to target. Additionally, there is an 8-hour demand zone further below, which may provide a potential long opportunity once price reaches that level.
Confluences for GOLD Sells:
- Bearish market structure: Gold has been trending downward and has recently left behind a clean, unmitigated 4-hour supply zone, which could prompt a bearish reaction.
- Liquidity targets below: There's significant liquidity under recent lows, including Asia session lows and the 8-hour demand zone, which can be targeted.
- DXY correlation: The dollar has reacted strongly from a notable demand zone, suggesting potential upside for DXY, which may add bearish pressure on gold.
- Higher timeframe Wyckoff: A Wyckoff distribution pattern has also formed on the higher timeframe, which may indicate temporary bearish order flow.
P.S. If price disrespects the current 4-hour supply zone, I will shift focus to an extreme 3-hour supply zone above. Until price reaches that level, I may look for short-term buy setups to trade the move up.
Wishing everyone a great and profitable trading week! Stay disciplined and manage risk accordingly.

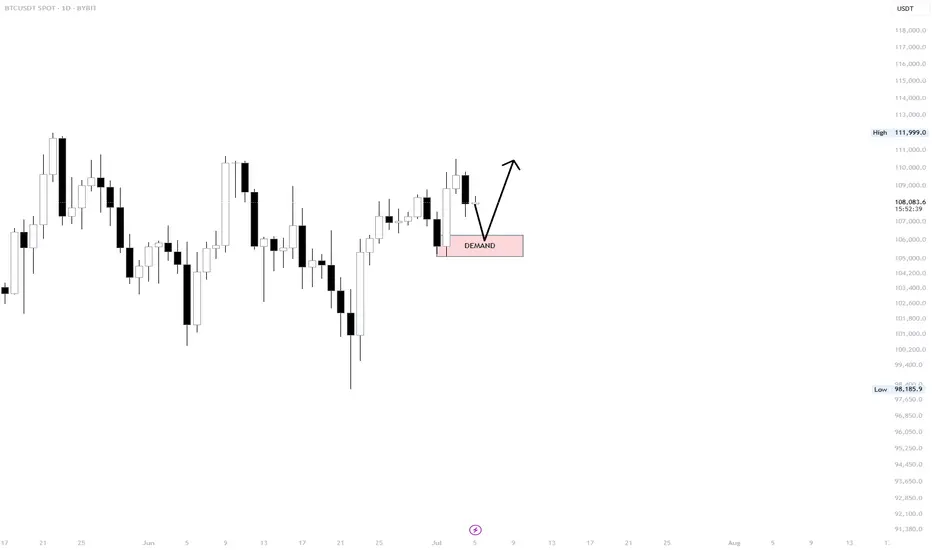
BTC/USDT BYBIT IDEA #1 – Daily Demand Zone Setup
We have an bullish OB with imbalance on Daily, 6 HOUR REFIMNET with some stoplosses underneath 107 200. If we do not hold local LTF -15M- 1H range I would be favoring this setup.
Otherwise I am already in position and already took two TPs.
Setup Thesis:
If price tags the demand zone (highlighted in pink) and holds, we could see a continuation toward recent highs. The setup favors a reactive long entry from this zone, as long as buyers defend the area with conviction.
Key Factors:
Demand zone: High probability support area
Clean structure: HL-HH continuation in play
Market strength remains intact above this zone
Plan:
Wait for reaction at demand
Long on confirmation (rejection candle, reclaim, or strong 4H close)
Invalidation below the zone lows
VTI 1D: breakout on the daily within a long-term weekly uptrend On the daily chart, VTI (Vanguard Total Stock Market ETF) has broken through the key $303.5 resistance level with strong volume. This breakout occurs within a larger weekly uptrend channel, highlighting a continuation of the long-term bullish structure.
Volume profile shows a clear path ahead: $321.7 (1.272 Fibo) and $345 (1.618 Fibo). The golden cross (MA50 crossing MA200 from below) further supports the bullish case.
Fundamentally, VTI represents the entire U.S. equity market - large to small caps - and benefits from economic resilience, declining inflation, and passive inflows. It’s a logical macro play for trend continuation.
Tactical plan:
— Entry by market or after retest $303.5
— TP1: $321.7
— TP2: $345
— Invalidation below $300
The whole market breaking out? That’s not noise — it’s the signal.

EURUSD - Where next?Looking at EURUSD
I still feel like we are due some sort of deeper retracement to the downside considering how bullish the 4H and Daily time frame have been in recent times.
Although the market does not care how I feel in all honesty haha. I will play the short term short until the 15min orderflow switches bullish once again.
The expansion that is currently happing right now is very interesting and makes a good watch to see what we will do come market open as we are engineering liquidity for both a buy and sell with both POI's looking primed for entries.
Will be keeping a close and keen eye on EURUSD when the market opens
Any questions feel free to give me a message

SOL SCALP SetupSOl can retrace to 175$ on ltf, must use sl before taking any trade. Market is too volatile now


Link short setup tradeAS previous short setup hits the tp but actually first manipulation to hit the sl, now closely monitor the trade and manually close if 4hr candle closes above the mentioned point, overall I'm bearish on whole market, needs to take a correction before another leg up, until unless usdt.d breaks and closes below 4.59% on 4hrs tf market is bearish, you need to take short position intsead of long positions, when usdt.d reaches 4.63% open short on link, inj, eth and btc and hold till 4.80%-4.89%. I will open long if we break 4.59% and retest this, other scenario if we reaches 4.80-4.90% first no long positions for me from here.

ETH Short setupETH showing some weakness, manual SL if 4hrs candle closes above the mentioned point then must close the trade don't hold and wait for the new setup.

Aptos Long Term ViewAptos taken out almost all liquidation from below side, it can fall more towards 3.5$ to take out all new buyers and then push towards 15$, remember 15-16$ is an unmitigated zone, sooner or later this imbalance zone will be filled. So if your an investor and want easy 3x gain then buy apt from 5$ 2nd entry 4$ and last buying from 3.5$, ignore lower timeframe volatility and BTC movement, these entries are easily achievable if market crashes by any chance so you can close your position at breakeven. While 7.19-7.50$ area is crucial to break, once this zone is broken there is nothing upside that can stop Aptos from hitting 15$. Any daily candle closing above the marked zone will confirm trend shift, before this trade setup is like high risk n reward. While I'm very confident on Aptos that it will hit 15% mark.

BTC SCALP Tradeas long as BTC doesn't closes below the mentioned area on 1hr tf, it will bounce and hit the fresh sellers SL. Once we have a closing below the area it can take correction upto 98-97K area.
