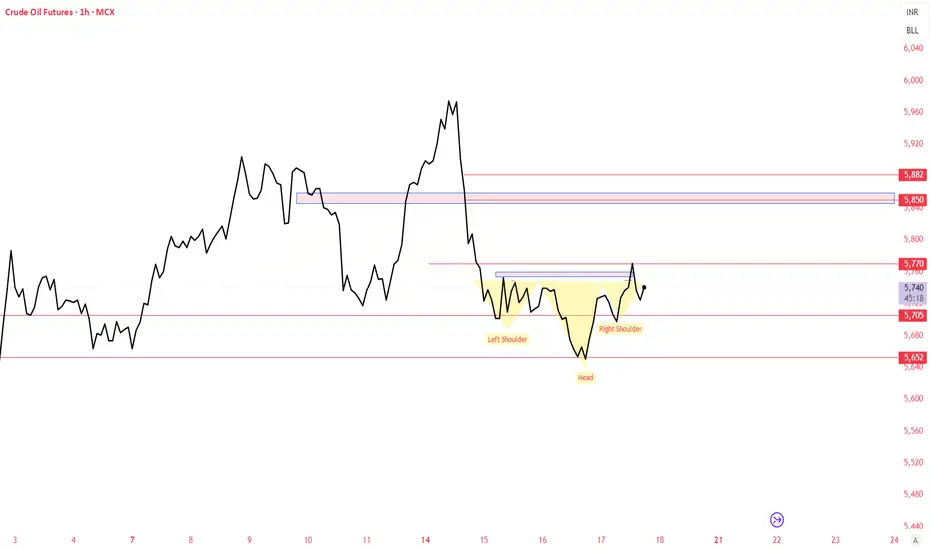
CRUDEOIL - MCX INVERTED HEAD AND SHOULDERCrudeoil on 1 hour time frame forming Inverted head shoulder which is consider as bullish Pattern. Strong Support of 5680 , crudeoil may do 5826-5820-5850
Please do your own research before taking any trading decisions
Supply and Demand
SHORT ON USD/JPYNice CHOC (Change of Character) on USD/JPY
Followed by a retest to the supply area/zone with massive wick rejection.
I will be selling USD/JPY looking to catch over 200 pips to the next level of support/demand.

XRP’s Descending Trendline Showdown: Is a Breakout Toward $4From a purely technical‐analysis standpoint (not financial advice), here are a few observations and ideas you can take into xrp/usdt
1. Descending Trendline Resistance
- Price has been making lower highs, forming that yellow descending trendline. A sustained break and close above it (on higher‐than‐average volume) would be a strong bullish signal.
- If price rejects at the trendline again, that often implies more consolidation or another leg downward, so watch how price reacts if/when it retests that line.
2. Moving Average Context
- It looks like the market is hovering near or just below a key moving average (blue line). If the price can reclaim that moving average and stay above it, it typically signals renewed bullish momentum. Conversely, continued closes below it can cap upside.
3. Key Support Zones
- The pink/gray box in the chart (roughly the 2.0–2.1 area) seems to be an important support region; buyers have stepped in there before.
- Below that, the 1.77–1.80 area looks like a major support “floor” (dotted line). If price were to break below that, it could trigger a deeper pullback.
4. Potential Upside Targets
- The horizontal level around 3.40 is the next big resistance if price can break out above the descending trendline.
- If bulls really take over and push through that 3.40 zone, a run toward 3.90–4.00 (as shown by the arrow) becomes more plausible.
5. Watch Volume and Momentum**
- Pay attention to volume on any breakout. A low‐volume push above the trendline can be a fakeout, whereas a strong volume surge confirms conviction.
- Oscillators (RSI, MACD, etc.) can help you gauge whether momentum is building or fading as price approaches resistance.
Overall, a breakout above the descending trendline plus a reclaim of the moving average would favor upside toward the mid‐3s or higher. Failure to break out, however, might lead to another test of that 2.0–2.1 support or even the 1.77 floor. Keep risk management in mind either way.

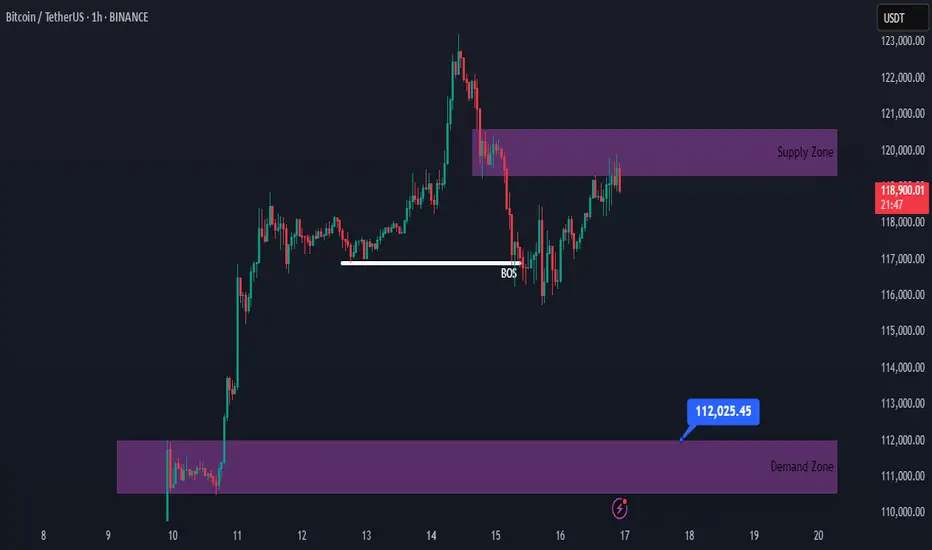
Bitcoin Bullish, but a Correction Might Be AheadHello traders!
Obviously, Bitcoin has a strong bullish momentum.
However, after noticing a minor shift in market structure, we may see a correction toward the 112,000 area.
If the supply area doesn’t break, we can look for a sell position here.
#BTC #Bitcoin
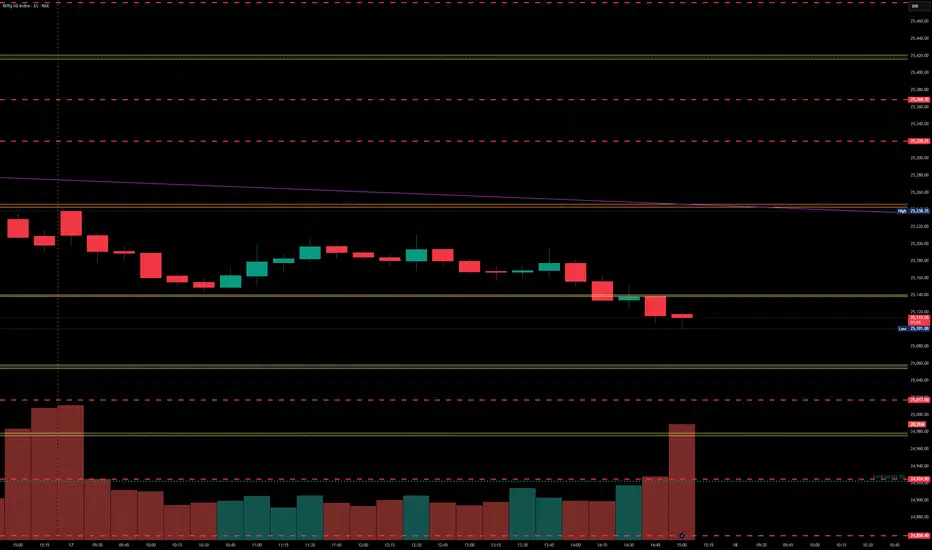
Nifty levels - Jul 18, 2025Nifty support and resistance levels are valuable tools for making informed trading decisions, specifically when combined with the analysis of 5-minute timeframe candlesticks and VWAP. By closely monitoring these levels and observing the price movements within this timeframe, traders can enhance the accuracy of their entry and exit points. It is important to bear in mind that support and resistance levels are not fixed, and they can change over time as market conditions evolve.
The dashed lines on the chart indicate the reaction levels, serving as additional points of significance to consider. Furthermore, take note of the response at the levels of the High, Low, and Close values from the day prior.
We hope you find this information beneficial in your trading endeavors.
* If you found the idea appealing, kindly tap the Boost icon located below the chart. We encourage you to share your thoughts and comments regarding it.
Wishing you success in your trading activities!
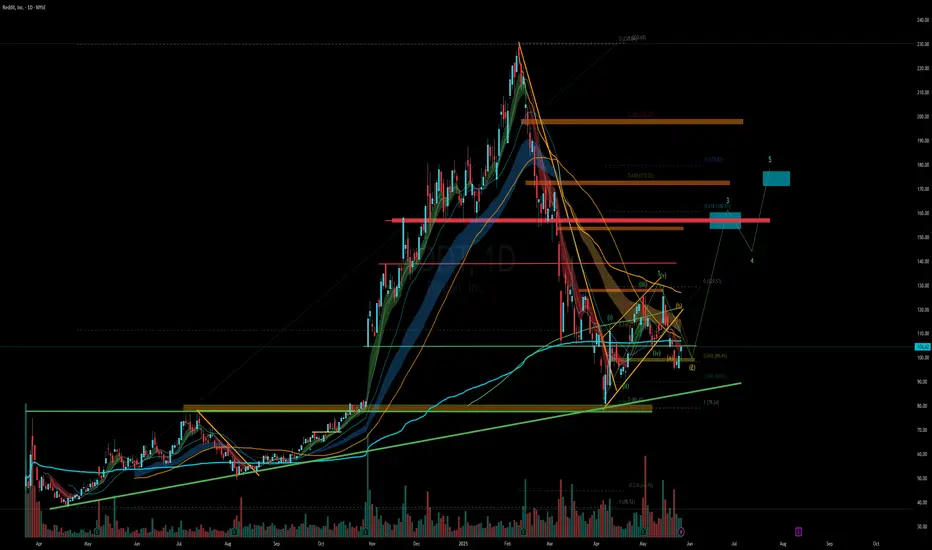
RDDT - Ready for Round 2?RDDT is setting up a base here, let's see if it holds this previous support level around 80.
Target 1 - 160
Target 2 - 180
Stop loss - 75
ETHUSDT BUY / Long SetupThis 4hrs candle closes above the mentioned level, then took long from 50% fib level of the fvg, and put sl below the recent swing low, I will update the trade whether it's active or not? tp towards 3.3-3.4k , while btc.d getting recked so becareful shorting any altcoin.

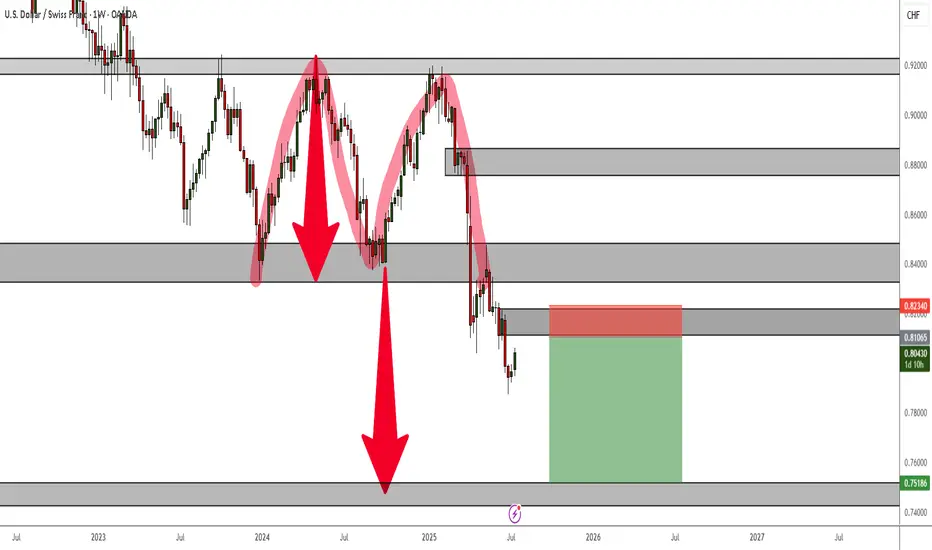
USDCHF Double Top Rejection - Bearish Setup for Long Term TradeA Double Top Rejection on the weekly TF is currently at play and despite the current bullish correction, the trend is still very much bearish.
For long-term or position traders, this is an ideal setup to take and hold.
XAUUSD Short📈 Scenario Forecast:
Bias: Bearish
Expected Path:
Price to move into the 3340–3352 supply zone.
Rejection expected from this area.
Downside targets are 3315, followed by 3290s, depending on how price interacts with intermediate demand.
This aligns with a classic pullback-to-supply-and-drop setup based on smart money concepts and supply/demand dynamics.
Your Key Zones ("Borders"):
🔴 Supply Zones (Short Bias Areas):
Primary Supply: 3340–3352
This zone is well-placed, capturing imbalance and previous distribution. It’s situated right at the 50% equilibrium level of the last bearish leg (as shown by your 0.5 line at 3340.72), and likely to act as the rejection point for the next bearish leg.
If price prints a lower high or bearish confirmation candle within this zone, it supports the bearish continuation thesis.
🟢 Demand Zones (Target Areas):
First Demand Zone: 3315–3309
This zone represents the prior BOS and recent swing low. It's the first level where we may see a temporary pause or reaction before continuation. It's an ideal short-term target for traders entering from the supply zone above.
Secondary Demand Zone: 3292–3286
A deeper institutional demand block. If bearish pressure remains strong, price could be drawn here for a liquidity sweep before a higher-timeframe reversal or bounce.

BCOUSD Long Swing Setup – Holding Support with Upside PotentialNYSE:BCO is currently sitting on a key support level, offering a potential long spot entry as buyers defend the $69.50 zone. A bounce from here could open the way for a move toward higher resistance levels.
📌 Trade Setup:
• Entry Zone: Around $69.50
• Take Profit Targets:
o 🥇 $73.50 – $76.00
o 🥈 $79.00 – $83.00
• Stop Loss: Daily close below $67.00

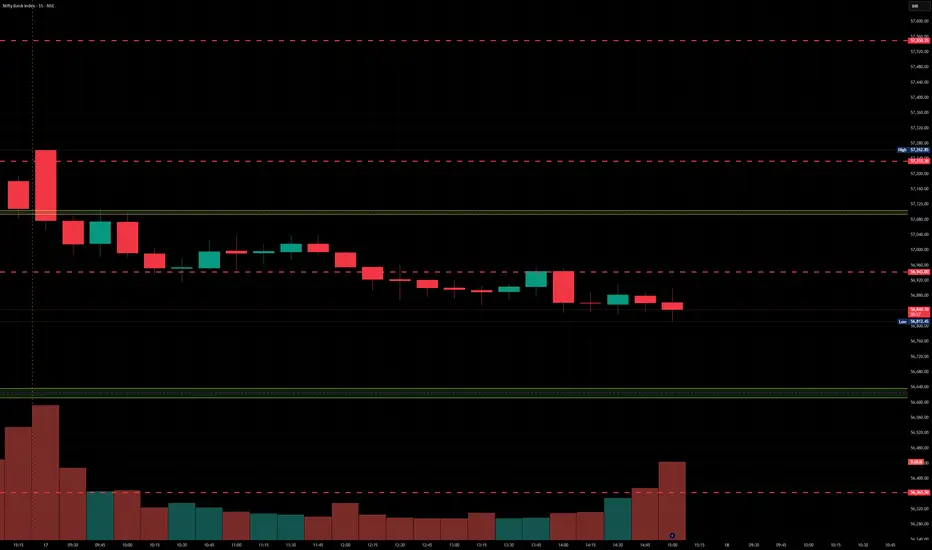
BankNifty levels - Jul 18, 2025Utilizing the support and resistance levels of BankNifty, along with the 5-minute timeframe candlesticks and VWAP, can enhance the precision of trade entries and exits on or near these levels. It is crucial to recognize that these levels are not static, and they undergo alterations as market dynamics evolve.
The dashed lines on the chart indicate the reaction levels, serving as additional points of significance. Furthermore, take note of the response at the levels of the High, Low, and Close values from the day prior.
We trust that this information proves valuable to you.
* If you found the idea appealing, kindly tap the Boost icon located below the chart. We encourage you to share your thoughts and comments regarding it.
Wishing you successful trading endeavors!
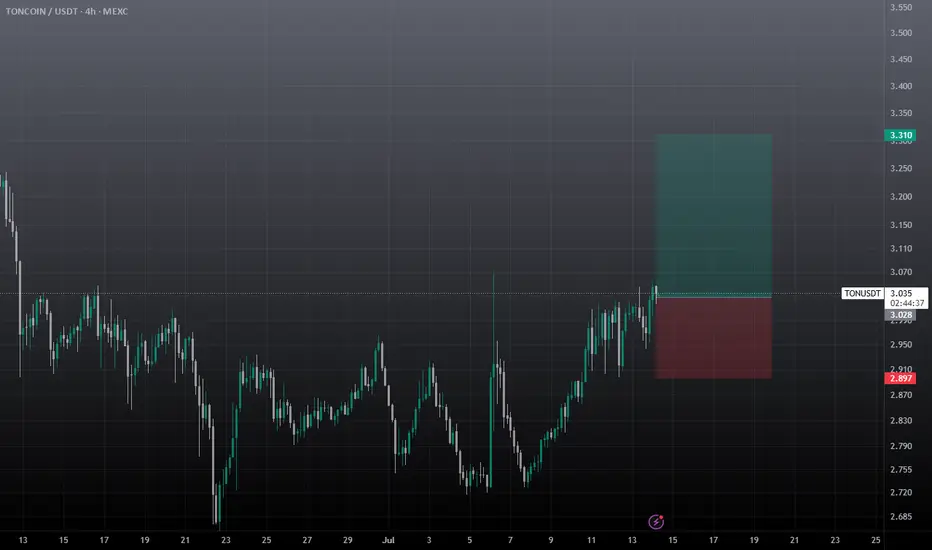
Ton USDT Intraday Setup / Long SetupTake with tight SL, an easy 2RR, take it at cmp (Current Market Price), While if you holding spot bag, it can easily hit 4.5-5$ mark in this week. Best Of Luck
GBPUSD Long IdeaGBPUSD has formed Higher Low which indicates bullish movement and the price rejected previous major support zone. TP1 is the zone that is most probable for me.
Good Luck!

GBP GBPUSD Supply-Demand Long SignalHigher Timeframe Analysis:
- Price inside daily/Weekly level of demand + pivot
- Long term trend = uptrend
- Fundamentals Bullish
- COT Mixed
- Technicals Bullish
Lowertimeframe:
- Price broke downard ML
- Price removed the opposing pivotal level of demand
- DBR Demand created from CPI event
- Split risk on GC + GBP
This is a mix of using Sentiment, technical analysis, and fundamental analysis with supply-demand.

DXY Trade Bias | Bullish Continuation Structure🔍 Chart Breakdown:
Trendline support respected
Order flow blocks (OBs) unbroken — confirming demand
Minor liquidity grabs without breaking bullish structure
Double mitigation of intraday OB, implying potential bullish continuation

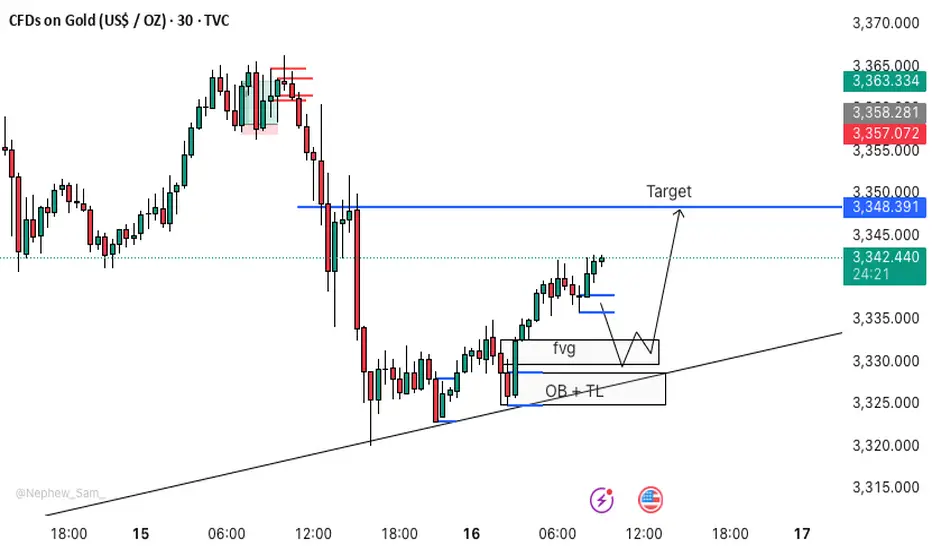
XAUUSD M30 BEST BUYING SETUP FOR TODAY📈 GOLD TRADING SCENARIO 🪙
Gold is currently in bullish momentum, making this the perfect buying zone. ✅
🟨 Buy Zone: 3332 – 3327
We have three strong confirmations in this zone:
🔹 FVG (Fair Value Gap)
🔹 OB (Order Block)
🔹 TL (Trendline)
This is a valid entry point for gold. 📌
🔔 Action: If price reaches the 3332–3327 zone, buy gold and wait patiently for the move to play out. 🧘♂️
EURGBP Bear To Bullish Outlook.Hi there,
EURGBP looks bearish at the M30, aiming toward the weekly trendline support targeting the 0.86322 zone area, and we might see a reversal back to the weekly resistance trendline, passing two price targets on the way for a bias of 0.87211 sustained by the overall bullish momentum in the weekly.
Happy Trading,
K.

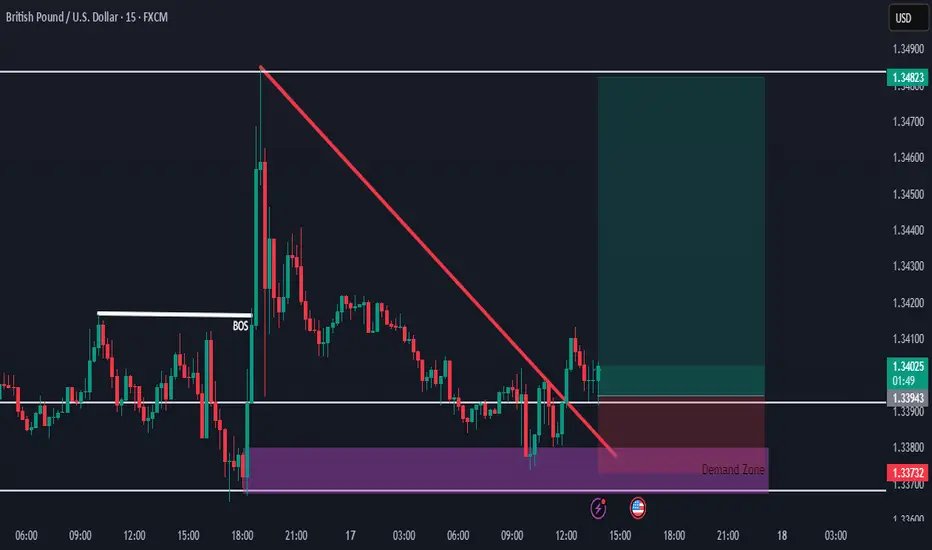
GBPUSD Buy Setup from Strong Demand ZoneHello everybody!
Price is in a higher timeframe demand zone, which is very strong and a good place to buy.
We were waiting patiently for confirmation, and now we have two key signals:
1- After a break of structure in the market, a small demand zone has formed.
2- The break of the downward trendline is where we entered the buy position.
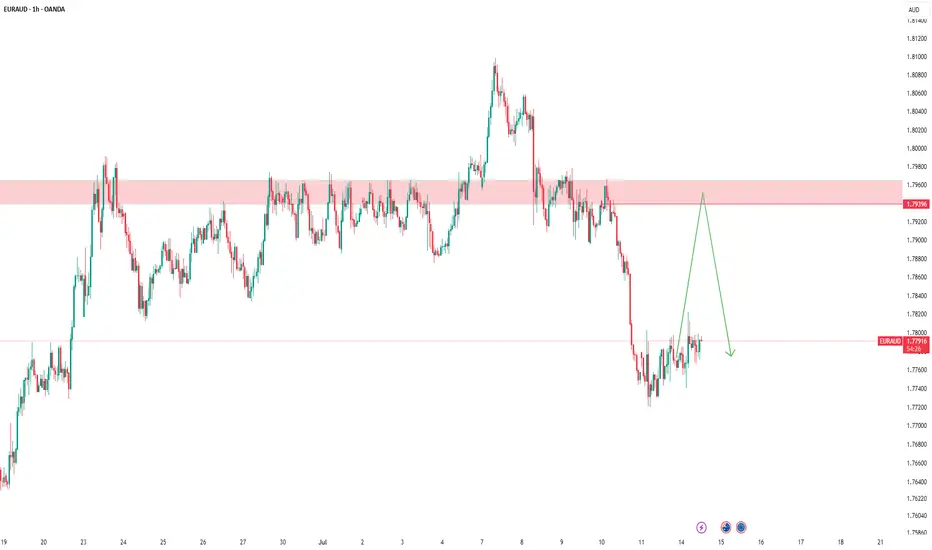
EURAUD – Planning Ahead, Not PredictingAs usual, I have marked my level.
🎯 I’m waiting for the price to reach it and if a valid sell signal appears, I will enter a short position.
If the level is broken cleanly,
I’ll wait for a pullback and enter a buy trade.
We are just traders, not predictors.
We have no impact on the market —
we are just a tiny part of a huge system.
🧠 So I never say: “Price will come here, then must fall.”
That’s not my mindset.
My belief is simple:
Manage risk, be prepared for everything.
One trade won’t make me rich,
and I won’t let one trade destroy me.
📌 Stop-loss is the first and last rule.
Trading without a stop-loss is just gambling.
USD/JPY – 4H Technical and Fundamental AnalysisUSD/JPY – 4H Technical and Fundamental Analysis
USD/JPY continues to gain bullish momentum, driven by stronger U.S. inflation data and rising Treasury yields. These macroeconomic factors have tempered expectations of aggressive Fed rate cuts, strengthening the dollar across the board—including against the yen. The Federal Reserve’s cautious tone, amid inflation tied to tariff pressures, further supports dollar strength.
Meanwhile, Japan faces ongoing political uncertainty with an upcoming election, and US-Japan trade negotiations remain sluggish. This creates hesitation around any near-term monetary tightening from the Bank of Japan (BOJ), keeping the yen under pressure and enhancing the bullish outlook for USD/JPY.
From a technical perspective, USD/JPY has broken above the key resistance level at 148.300, signaling renewed buying interest. After a brief consolidation—interpreted as an accumulation phase—price executed a liquidity hunt, triggering stop-losses placed above the resistance. This manipulation move set the stage for a potential continuation higher. Price is currently hovering near a minor key level.
We are now watching for a clear candle close above the 148.300 zone to validate further upside momentum. Once confirmed, we aim to enter long on a breakout play.
📍 Buy Setup
Entry: Buy Stop at 148.660
Stop Loss: 147.570
Take Profit: 150.870
📌 Disclaimer:
This is not financial advice. Always wait for proper confirmation before executing trades. Manage risk wisely and trade what you see—not what you feel.

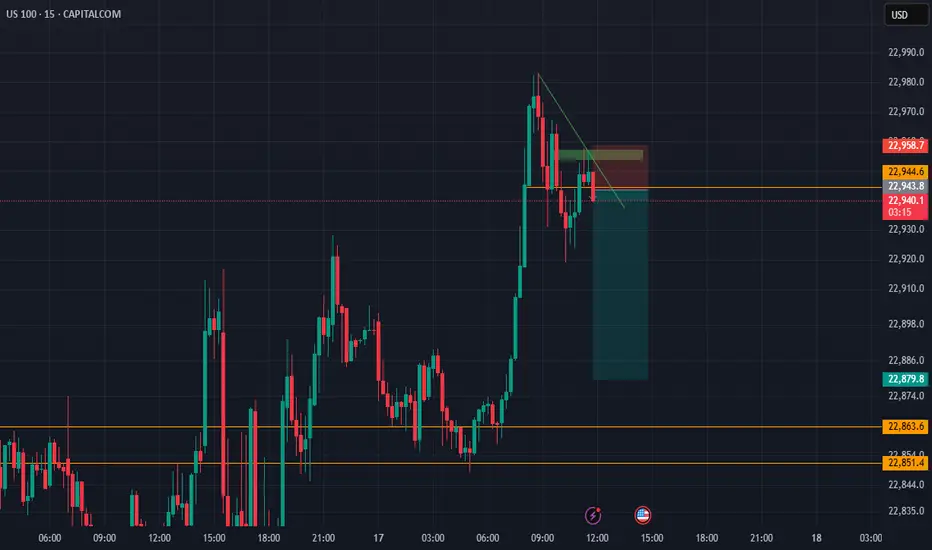
NASDAQ ShortLooking forward to this Setup dropping back down to attent to low of the day as the New york session approaches, Looking to take profit before 15:00 Central African Time
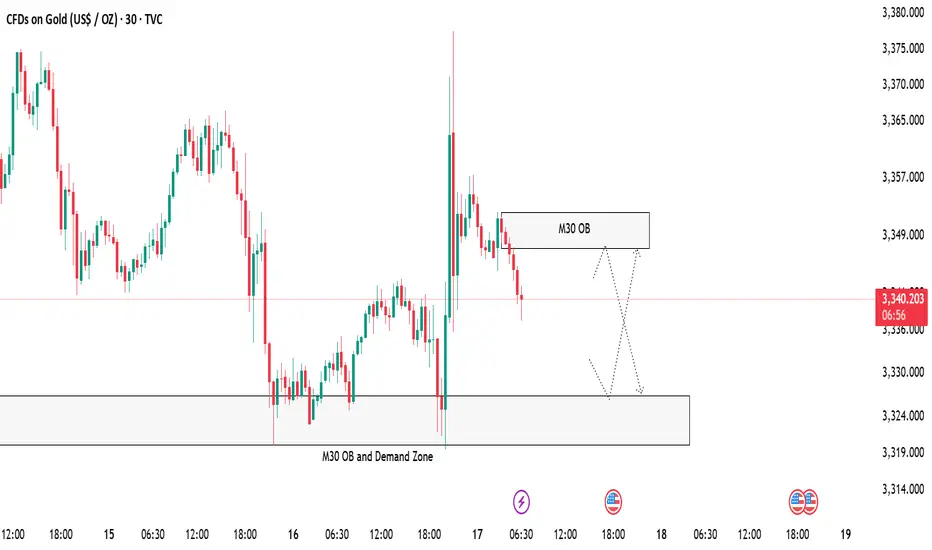
Gold 30-Minute OB and Demand Zone SetupGold is now approaching a 30-Minute Order Block along with a strong demand zone 🟢. We are expecting some clean reactions from these areas.
📌 Plan:
Scenario 1:
👉 If price respects the M30 OB and Demand zone area at 3327 -3320, we can look for bullish signs like rejection wicks or bullish candles to enter buy positions 📈, targeting the upper zone M30 OB zone near 3347 🎯.
Scenario 2:
👉 If price tap the above 30 min OB near 3347 we take our sell or short side entries for a reaction from there entering short ✅.
Both scenarios are possible, so we will watch the price action closely 🧐 and only trade with confirmation!
EURUSD Bullish Continuation Patterns and Consistent Demand The bullish continuation patterns and the consistent daily demand zones indicate that the trend is still bullish despite last week's bearish correction.
Price is currently reacting to a daily support zone. To confirm going long, especially long term, I recommend waiting for the current falling wedge to breakout and retest and then ride the bullish momentum to daily and weekly supply zones.
