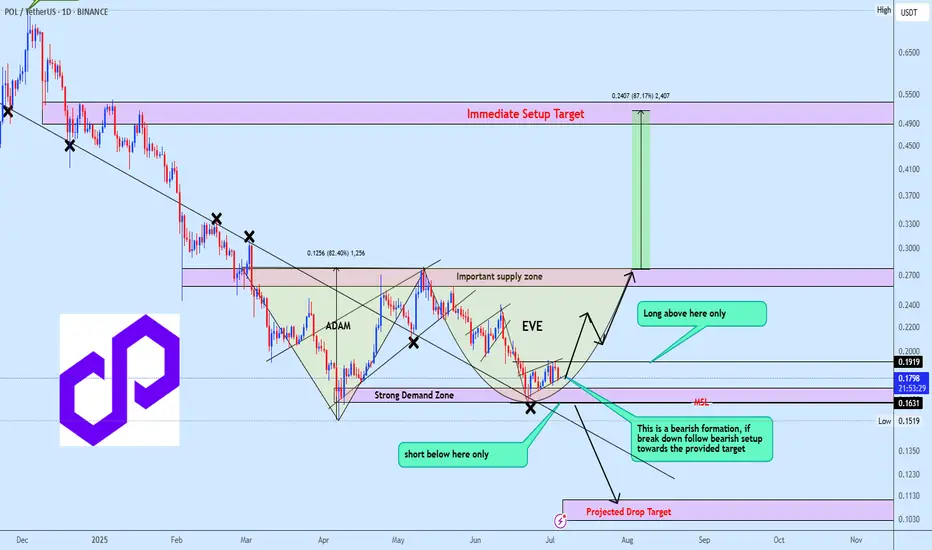
POLUSDT reversal time or bearish ContinuationPOLUSDT is currently shaping a potential Adam and Eve formation, with price consolidating inside a mini bearish flag. A breakdown from the flag would invalidate the bullish setup and likely trigger a continuation toward the projected downside target.
However, if the strong demand zone holds, we could see a bullish reversal unfold, confirming the Adam and Eve structure and opening the path toward the upside projection highlighted on the chart.
At this stage, the focus is on confirmation, not speculation. Waiting for price to validate direction will be key to positioning correctly in this setup.
Supply and Demand
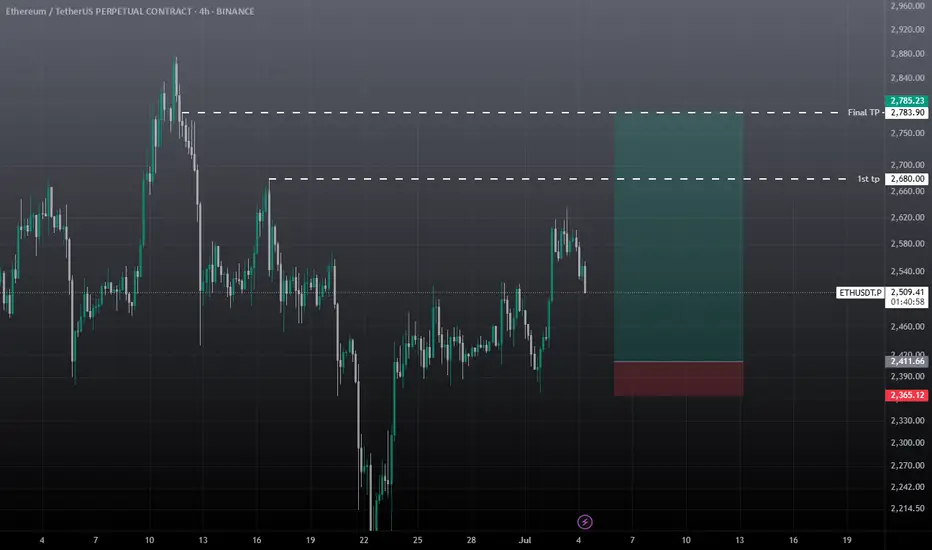
ETH BEARISH AT RESISTANCE ETH rejecting daily resistance, likely price will look to find supports at zones marked below
DYOR

strong RSI, strong VOLUME, strong PRICE ACTIONthe banknifty is nbear life high. this stock is eyeing a multimonth, breAKOUT .
RSI: ABOVE 70 strong
volume: huge spike
price action: strong uptrend
the above could lead to strong follow up

US100 MARKET OUTLOOK - H1Price is strongly bullish in monthly, weekly and daily but we’re currently seeing a retrace in H1 timeframe. we’re going to see price tap into our H1 point of interest .

SASOL: Potential Recovery After Breaking 2002 Low ZoneSASOL has broken below its 2002 low zone and returned back into it. The unconventional price action and recent bullish momentum suggest possible recovery movements. Keep watch on price behavior around this historical support level.

GBPUSD MARKET OUTLOOK!GBPUSD Price just dropped lower following the recent release in US NFP report. Therefore I anticipate a bullish price action to develop away from 1.3500 and 1.3400 level
We’re still looking forward to seeking more bullish price action developments

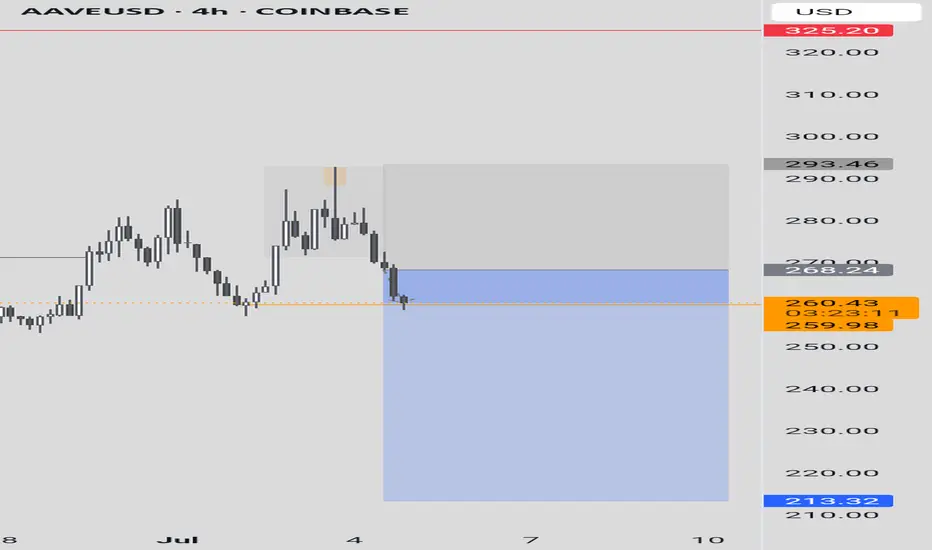
AAVEUSDT Cryptocurrency Futures Market Disclaimer 🚨🚨🚨
Trading cryptocurrency futures involves high risks and is not suitable for all investors.
Cryptocurrency prices are highly volatile, which can lead to significant gains or losses in a short period.
Before engaging in crypto futures trading, consider your risk tolerance, experience, and financial situation.
Risk of Loss: You may lose more than your initial capital due to the leveraged nature of futures. You are fully responsible for any losses incurred.
Market Volatility: Crypto prices can fluctuate significantly due to factors such as market sentiment, regulations, or unforeseen events.
Leverage Risk: The use of leverage can amplify profits but also increases the risk of total loss.
Regulatory Uncertainty: Regulations related to cryptocurrencies vary by jurisdiction and may change, affecting the value or legality of trading.
Technical Risks: Platform disruptions, hacking, or technical issues may result in losses.
This information is not financial, investment, or trading advice. Consult a professional financial advisor before making decisions. We are not liable for any losses or damages arising from cryptocurrency futures trading.
Note: Ensure compliance with local regulations regarding cryptocurrency trading in your region.
thanks for like and follow @ydnldn to have more information outlook and free signal.
About me :
"I am a passionate swing trader focused on analyzing financial markets to capture profit opportunities from medium-term price movements. With a disciplined approach and in-depth technical analysis, I concentrate on identifying trends, support-resistance levels, and price patterns to make informed trading decisions. I prioritize strict risk management to protect capital while maximizing profit potential. Always learning and adapting to market dynamics, I enjoy the process of refining strategies to achieve consistency in trading."
USDCAD 15/3 Pullback LongOverall up trend. When the pull back reach congestion, will take off. Still need to monitor the CAD news later.

BTC Trade SetupBTC will not take any major correction until it sweeps upside liquidation and close with big red candle, So take the long only on BTC. Wick possible below the SL. I will hold the trade without sl if it comes to entry, if tp achieved first then ignore the trade. Also July breakout possible for BTC, July always positive for BTC, let's see.

ETH SWING TRADEETH Showing strong momentum against BTC, July is also good for eth and some alts, maybe we see correction in Aug, September but before expected pullback towards 2.9k-3k. Must use SL as market is very Volatile these days.
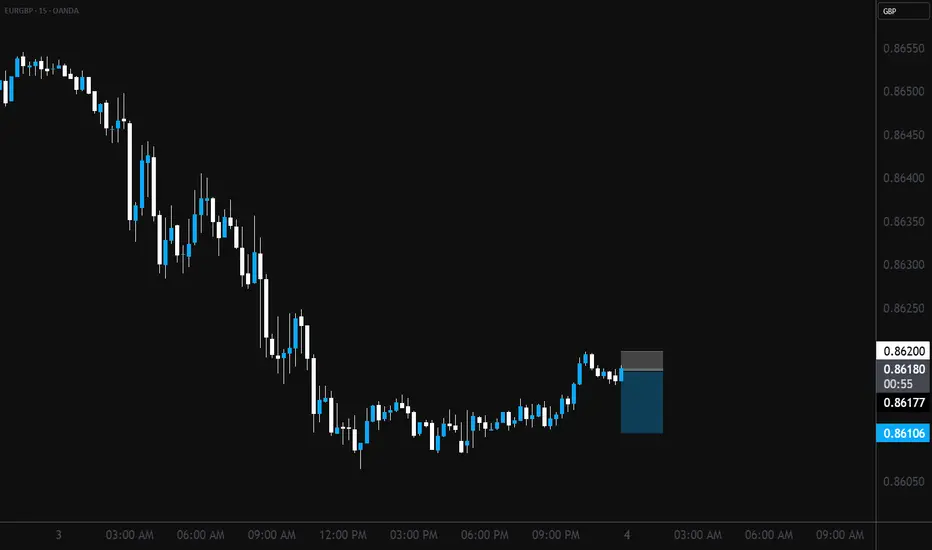
SHORT ON EUR/USDEU has given a nice bearish setup with a rising channel.
I will be selling EU to the next demand level looking to catch 200-300 pips.

EURCHF 04/07/2025Weekly:
-Inverse H&S pattern.
-Previous week low liquidity sweep.
-Expecting a bullish reaction.
Daily:
-Bullish M pattern.
-Liquidity sweep.
-Daily lows.
4H:
-Inverse H&S pattern.
-Double bottom.

Nifty levels - Jul 07, 2025Nifty support and resistance levels are valuable tools for making informed trading decisions, specifically when combined with the analysis of 5-minute timeframe candlesticks and VWAP. By closely monitoring these levels and observing the price movements within this timeframe, traders can enhance the accuracy of their entry and exit points. It is important to bear in mind that support and resistance levels are not fixed, and they can change over time as market conditions evolve.
The dashed lines on the chart indicate the reaction levels, serving as additional points of significance to consider. Furthermore, take note of the response at the levels of the High, Low, and Close values from the day prior.
We hope you find this information beneficial in your trading endeavors.
* If you found the idea appealing, kindly tap the Boost icon located below the chart. We encourage you to share your thoughts and comments regarding it.
Wishing you success in your trading activities!

BankNifty levels - Jul 07, 2025Utilizing the support and resistance levels of BankNifty, along with the 5-minute timeframe candlesticks and VWAP, can enhance the precision of trade entries and exits on or near these levels. It is crucial to recognize that these levels are not static, and they undergo alterations as market dynamics evolve.
The dashed lines on the chart indicate the reaction levels, serving as additional points of significance. Furthermore, take note of the response at the levels of the High, Low, and Close values from the day prior.
We trust that this information proves valuable to you.
* If you found the idea appealing, kindly tap the Boost icon located below the chart. We encourage you to share your thoughts and comments regarding it.
Wishing you successful trading endeavors!

Big Bounce or Breakdown? Tesla at the edgeTesla is at crossroads right now, where the next move will define its near-term trajectory.
After an extended correction phase, TSLA is reaching a key zone around the $300 level, one that held price well during recent pullbacks.
Although recent tax news caused a decline in the price, belief in Tesla’s longer-term trajectory remains strong among many investors.
At the same time, many investors are carefully monitoring the support near $215 to $230, another important zone. This level has acted as a reliable level during past pullbacks, as it suggests the stock has a solid base, despite short-term ups and downs. For these investors, maintaining their positions through consolidation is a test of patience and belief in Tesla’s longer-term trajectory. If Tesla breaks below the $230 support zone, some investors may view this as an opportunity to take advantage once again.
Given the current setup, it’s best to be cautious and wait for confirmation before looking to get involved.

Duolingo’s Language Learning Boom: A Profitable EdTech PlayDuolingo, the language-learning app that took the world by storm, has evolved from a free tool into a powerhouse since its 2021 IPO. With a market cap nearing $11 billion and its stock quadrupling in value, the company stands out as a rare profitable player in the edtech space. But what fuels its success, and what challenges could temper its rise? Here’s an in-depth look at Duolingo’s journey and prospects.
From Free App to IPO Success: Duolingo’s Rise
Founded in 2011 in Pittsburgh, Pennsylvania, by Guatemalan programmer Luis von Ahn and his Carnegie Mellon student Severin Hacker, Duolingo started as a free language-learning platform. Von Ahn, known for creating CAPTCHA and reCAPTCHA (later sold to Google), used those proceeds to launch the app. Its beta version debuted in 2012, offering languages like Spanish, French, German, and English. By 2013, it became the top educational app on the App Store, and its growth accelerated with the 2021 IPO on NASDAQ, raising its valuation past $3 billion. Since then, its stock has soared from $102 to $410, a fourfold increase in four years.
The Business: Learning Reimagined
Today, Duolingo is the world’s largest language-learning platform, boasting over 90 million monthly users and supporting more than 40 languages—including even such quirky options like Klingon from Star Trek movie. Its mobile app blends gamification with AI-driven lessons, making learning addictive and accessible. Beyond languages, Duolingo has expanded into math (Duolingo Math) and music (Duolingo Music), while its Duolingo English Test serves as a cost-effective alternative to TOEFL or IELTS, accepted by universities worldwide. The premium Duolingo Max subscription leverages GPT for personalized feedback, and Tiny Cards offers flashcard-based learning.
Financial Snapshot: Profitability Meets Growth
Duolingo’s financials are pretty impressive. In 2024, revenue hit $640 million (according to a different source , its $748 mln), up 40% from the previous year, with net profit reaching $30 million—a stark contrast to many growth-stage peers. Of its 90 million users, 7 million pay for premium features, driving a gross margin above 70% that reflects a lean, scalable model. The company reinvests 25% of its revenue into R&D, fostering innovation, while maintaining a debt-to-asset ratio of just 4%, signaling financial health. With a P/E ratio of 95 and a market cap of $18.6 billion, Duolingo NASDAQ:DUOL trades as a high-growth stock with solid earnings.
Market Opportunity: Scalable and Viral
Duolingo’s edge lies in its scalability and viral appeal. Its gamified approach and AI enhancements, like virtual tutors, keep users engaged, while its reputation draws new learners organically. The global language-learning market is valued in the billions, and Duolingo’s expansion into math and music broadens its TAM further. With a low monetization rate (its just 7% of users that pay), there’s ample room to convert free users to subscribers, especially as it taps into emerging markets.
Risks to Notice
Despite its wingspan, Duolingo faces headwinds. Competitors like Babbel and Rosetta Stone, alongside free YouTube content and ChatGPT, challenge its dominance. Its 7% paid-user rate highlights monetization struggles, and reliance on App Store and Google Play commissions could squeeze margins. Regulatory risks around data privacy or educational standards also loom as the app grows globally.
A Language-Learning Leader with Upside
Trading at $410, Duolingo’s stock has some space to fly, with analysts bullish on its potential. Morgan Stanley targets $515, Davidson predicts $600, and UBS and JP Morgan see $500 and $580, respectively, with a consensus around $500—offering a 22% upside. For investors, Duolingo combines profitability, a sticky user base, and innovative tech in a growing sector. While competition and monetization pose risks, its track record and expansion make it a compelling pick for growth-focused portfolios.

USDT DOMINANCE New Update (4H)This analysis is an update of the analysis you see in the "Related publications" section
The green box from the previous analysis was engulfed, and a new demand zone has been added to the chart.
Before the main drop, we still expect a pullback from this index
For risk management, please don't forget stop loss and capital management
Comment if you have any questions
Thank You

THE KOG REPORT - Update & NFP analysis End of day update from us here at KOG:
We managed to get the move into the red box we wanted which should have been a enough for the day. However, the levels were so clean during NY that we managed to get another decent trade into the Excalibur target to complete the day.
With NFP tomorrow and a US holiday on Friday, we're going to share our levels and view but due to unforeseen circumstances, I won't be around for the rest of the week to see it through.
We've added the updated red boxes, the key levels and the potential move if they break. So far, we've had a good week, so these levels are simply for reference and unless there is a clean set up, our traders will stay away until Monday.
Red boxes:
Break above 3350 for 3355, 3362, 3373, 3375 and 3390 in extension of the move
Break below 3335 for 3320, 3316, 3310. 3306, 3298 and 3285 in extension of the move
The week so far:
KOG’s bias for the week:
Bullish above 3250 with targets above 3278✅, 3285✅, 3297✅ and above that 3306✅
Bearish below 3250 with targets below 3240, 3232, 3220 and below that 3212
RED BOX TARGETS:
Break above 3275 for 3279✅, 3285✅, 3289✅ and 3306✅ in extension of the move
Break below 3260 for 3255, 3251, 3240 and 3235 in extension of the move
As always, trade safe.
KOG

GOLD (XAUUSD): Potential Scenarios Explained
Here is my updated technical outlook for Gold with potential scenarios.
Bullish Scenario
The price is currently testing a significant daily resistance cluster.
Its bullish breakout and a daily candle close above 3368 will
provide a strong confirmation.
More growth will be expected then.
Bearish Scenario
For now, the market is consolidating on the underlined resistance.
The price is stuck within a horizontal range on a 4H time frame now.
Your bearish signal will be a breakout of its support and a 4H candle
close below 3310.
It will provide a strong bearish confirmation.
The market might be weak and remain within a 4H range today.
But, everything can happen, so watch carefully.
❤️Please, support my work with like, thank you!❤️
I am part of Trade Nation's Influencer program and receive a monthly fee for using their TradingView charts in my analysis.

OIL fell sharply, opportunity for upside target of 70$OIL fell sharply and has now been in a contraction for a while, I am taking it into account for a potential breakout, as it shows tightening price action, which reflects market indecision.
Price action has now coiled into a symmetrical triangle, this is often a classic continuation or reversal pattern, and it’s building pressure for a potential breakout. So, if we do get a clean breakout above this pattern, with strong bullish candles, volume, or bullish divergence, that’s your confirmation cue.
This is totally achievable. It aligns beautifully with the 0.25 to 0.5 Fibonacci retracement zone from the recent swing high to low. It’s not just a psychological round number, it’s technically supported.
If the lower boundary of the triangle is broken with momentum, you’ve got to step back. No trade is better than a bad one. Watch how price interacts with the zone. If it loses it, you could be looking at a deeper leg down, potentially revisiting deeper support levels from prior bullish structure.

US DOLLAR: Sell opportunity following channel breakPrice on DXY recently broke above a sharp descending channel, but the move lacked presence. There was no real follow-through and certainly no conviction behind the candles. It felt hesitant, as this is a great indication for us to use.
Instead of accelerating upward, price now hovers just above the breakout, this kind of behavior suggests rather a random push than a shift in sentiment. Without the strength to sustain above structure, I think we will see the price come back to the channel's lower border.
And when breakouts fail, they often trap early longs, preparing for a more committed move in the opposite direction.
A rejection from this level could send price into the 0.85800 level.

MUKANDLTDMUKAND Daily Chart | CMP ₹152.78
Massive breakout with volume. Price holding above previous resistance ₹150.5.
Structure bullish
TP1 near ₹176.
SL below ₹137.
Trend: Strong Bullish
