GBPUSD - Trade Idea for Today ! Hurry Up !Details on chart. There some important levels here and we might see a downward move here.
CMCMARKETS:GBPUSD FX:GBPUSD OANDA:GBPUSD FX_IDC:GBPUSD
Supply and Demand

BankNifty levels - Jul 03, 2025Utilizing the support and resistance levels of BankNifty, along with the 5-minute timeframe candlesticks and VWAP, can enhance the precision of trade entries and exits on or near these levels. It is crucial to recognize that these levels are not static, and they undergo alterations as market dynamics evolve.
The dashed lines on the chart indicate the reaction levels, serving as additional points of significance. Furthermore, take note of the response at the levels of the High, Low, and Close values from the day prior.
We trust that this information proves valuable to you.
* If you found the idea appealing, kindly tap the Boost icon located below the chart. We encourage you to share your thoughts and comments regarding it.
Wishing you successful trading endeavors!

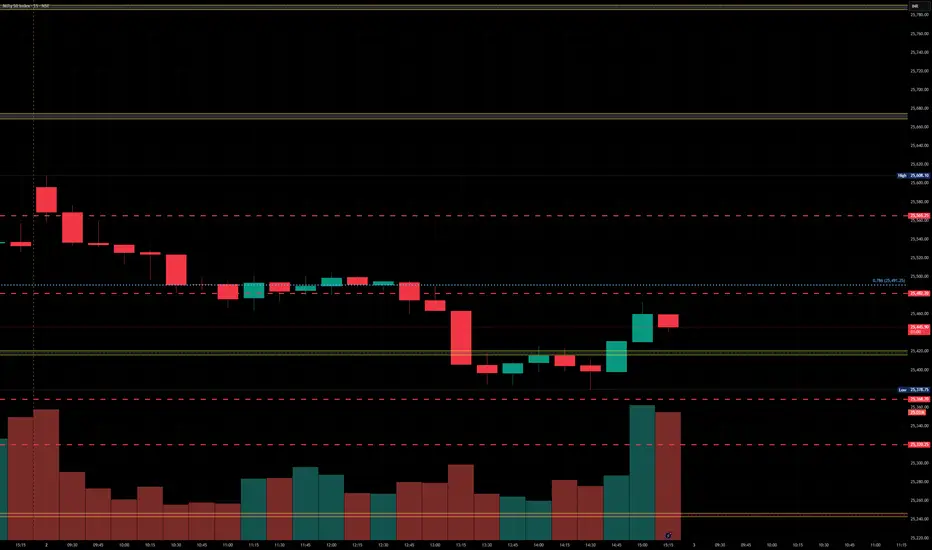
Nifty levels - Jul 03, 2025Nifty support and resistance levels are valuable tools for making informed trading decisions, specifically when combined with the analysis of 5-minute timeframe candlesticks and VWAP. By closely monitoring these levels and observing the price movements within this timeframe, traders can enhance the accuracy of their entry and exit points. It is important to bear in mind that support and resistance levels are not fixed, and they can change over time as market conditions evolve.
The dashed lines on the chart indicate the reaction levels, serving as additional points of significance to consider. Furthermore, take note of the response at the levels of the High, Low, and Close values from the day prior.
We hope you find this information beneficial in your trading endeavors.
* If you found the idea appealing, kindly tap the Boost icon located below the chart. We encourage you to share your thoughts and comments regarding it.
Wishing you success in your trading activities!
inj swing trade setupInj has broken downside, expecting more downfall before any leg up, wait for the entries to be filled, these are swing trades based on 1 day TF, so here wick doesn't matter wait for the closing, you can hold them without SL if entry achieved, take 1st entry on mentioned points 2nd entry below SL, and then wait for the closing, IF any entry achieved and candle closed above the short then wait for the pullback and close on entry points if long entry achieved then hold the trade 2nd entry take from previous wick low and wait for the tp this leg down will be the final shakeout before any major move. That's why giving you some short entries. BTC will take a final leg down sooner or later, then Boom your alt season starts.

THE KOG REPORT - UpdateEnd of day update from us here at KOG:
We said we would stick with the plan and look for the higher levels on Gold, which we did and worked well. Once we approached the red box however, you'll notice we broke straight through it. The indicators then gave us numerous long signals which meant we either got in with the madness of the move, or, simple waited for the red box target to hit and then attempt the short on the RIP, which is moving nicely at the moment.
Now resistance is on the flip 3350 with support below 3333-5 which is we're we are looking for a potential bounce. We have made a big move today so not expecting much towards the end of the session.
KOG’s bias for the week:
Bullish above 3250 with targets above 3278✅, 3285✅, 3297✅ and above that 3306✅
Bearish below 3250 with targets below 3240, 3232, 3220 and below that 3212
RED BOX TARGETS:
Break above 3275 for 3279✅, 3285✅, 3289✅ and 3306✅ in extension of the move
Break below 3260 for 3255, 3251, 3240 and 3235 in extension of the move
As always, trade safe.
KOG

BTCUSDTCryptocurrency Futures Market Disclaimer 🚨🚨🚨
Trading cryptocurrency futures involves high risks and is not suitable for all investors.
Cryptocurrency prices are highly volatile, which can lead to significant gains or losses in a short period.
Before engaging in crypto futures trading, consider your risk tolerance, experience, and financial situation.
Risk of Loss: You may lose more than your initial capital due to the leveraged nature of futures. You are fully responsible for any losses incurred.
Market Volatility: Crypto prices can fluctuate significantly due to factors such as market sentiment, regulations, or unforeseen events.
Leverage Risk: The use of leverage can amplify profits but also increases the risk of total loss.
Regulatory Uncertainty: Regulations related to cryptocurrencies vary by jurisdiction and may change, affecting the value or legality of trading.
Technical Risks: Platform disruptions, hacking, or technical issues may result in losses.
This information is not financial, investment, or trading advice. Consult a professional financial advisor before making decisions. We are not liable for any losses or damages arising from cryptocurrency futures trading.
Note: Ensure compliance with local regulations regarding cryptocurrency trading in your region.
thanks for like and follow @ydnldn to have more information outlook and free signal.
About me :
"I am a passionate swing trader focused on analyzing financial markets to capture profit opportunities from medium-term price movements. With a disciplined approach and in-depth technical analysis, I concentrate on identifying trends, support-resistance levels, and price patterns to make informed trading decisions. I prioritize strict risk management to protect capital while maximizing profit potential. Always learning and adapting to market dynamics, I enjoy the process of refining strategies to achieve consistency in trading."

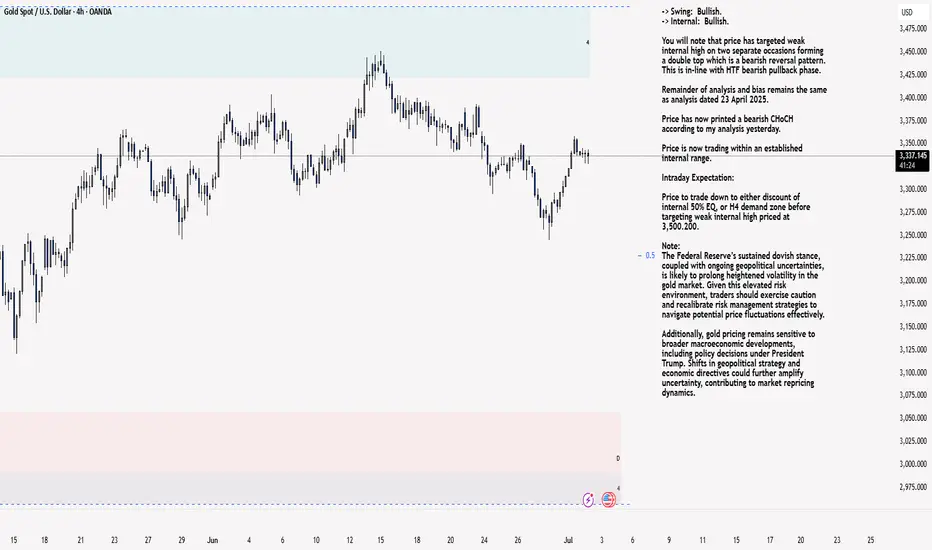
XAU/USD 02 July 2025 Intraday AnalysisH4 Analysis:
-> Swing: Bullish.
-> Internal: Bullish.
You will note that price has targeted weak internal high on two separate occasions forming a double top which is a bearish reversal pattern. This is in-line with HTF bearish pullback phase.
Remainder of analysis and bias remains the same as analysis dated 23 April 2025.
Price has now printed a bearish CHoCH according to my analysis yesterday.
Price is now trading within an established internal range.
Intraday Expectation:
Price to trade down to either discount of internal 50% EQ, or H4 demand zone before targeting weak internal high priced at 3,500.200.
Note:
The Federal Reserve’s sustained dovish stance, coupled with ongoing geopolitical uncertainties, is likely to prolong heightened volatility in the gold market. Given this elevated risk environment, traders should exercise caution and recalibrate risk management strategies to navigate potential price fluctuations effectively.
Additionally, gold pricing remains sensitive to broader macroeconomic developments, including policy decisions under President Trump. Shifts in geopolitical strategy and economic directives could further amplify uncertainty, contributing to market repricing dynamics.
H4 Chart:
M15 Analysis:
-> Swing: Bullish.
-> Internal: Bullish.
H4 Timeframe - Price has failed to target weak internal high, therefore, it would not be unrealistic if price printed a bearish iBOS.
The remainder of my analysis shall remain the same as analysis dated 13 June 2025, apart from target price.
As per my analysis dated 22 May 2025 whereby I mentioned price can be seen to be reacting at discount of 50% EQ on H4 timeframe, therefore, it is a viable alternative that price could potentially print a bullish iBOS on M15 timeframe despite internal structure being bearish.
Price has printed a bullish iBOS followed by a bearish CHoCH, which indicates, but does not confirm, bearish pullback phase initiation. I will however continue to monitor, with respect to depth of pullback.
Intraday Expectation:
Price to continue bearish, react at either M15 supply zone, or discount of 50% internal EQ before targeting weak internal high priced at 3,451.375.
Note:
Gold remains highly volatile amid the Federal Reserve's continued dovish stance, persistent and escalating geopolitical uncertainties. Traders should implement robust risk management strategies and remain vigilant, as price swings may become more pronounced in this elevated volatility environment.
Additionally, President Trump’s recent tariff announcements are expected to further amplify market turbulence, potentially triggering sharp price fluctuations and whipsaws.
M15 Chart:
GBP/JPY Shifts to Bearish Trend – Key Levels to MonitorGBP/JPY Shifts to Bearish Trend – Key Levels to Monitor
The GBP/JPY pair has entered a confirmed bearish trend structure, with the formation of a lower low signaling increasing selling pressure. This technical development suggests the currency pair may continue its downward trajectory in upcoming trading sessions, presenting potential shorting opportunities for traders.
Bearish Confirmation
The recent lower low formation serves as a classic technical confirmation of bearish momentum. This pattern indicates sellers are successfully pushing prices below previous support levels, establishing a new downward trajectory. The breakdown follows what appears to be exhaustion of the prior bullish trend, with bears now taking control of market direction.
Downside Targets
The pair now eyes potential support levels at:
- 196.300 (immediate target)
- 194.300 (secondary objective)
These levels may provide temporary support, but a decisive break below could accelerate the decline. Traders should watch for potential bearish continuation patterns or reversal signals around these zones.
Key Resistance
The 198.900 level now stands as critical resistance. Any corrective rallies toward this zone:
- May attract fresh selling pressure
- Could offer potential short entry opportunities
- Would need to be decisively broken to invalidate the bearish outlook
Market Considerations
Several factors could influence GBP/JPY's movement:
- Bank of England vs. Bank of Japan policy divergence
- Risk sentiment in global markets
- UK economic data releases
Trading Strategy
With the bearish structure confirmed, traders might consider:
- Short positions on rallies toward resistance
- Tight stop-losses above 198.900
- Profit-taking near support levels
The bearish outlook remains valid unless price reclaims and sustains above the 198.900 resistance level. As always, proper risk management is essential when trading this volatile currency pair.

How to Trade Liquidity Sweep in Forex Market (SMC Trading)
I will show you a real example of trading liquidity sweep with Smart Money Concepts.
You will learn the essential SMC liquidity basics, a simple and profitable strategy to identify and trade liquidity sweep.
I will share with you an accurate entry confirmation signal that works perfectly on any Forex pair.
Liquidity Basics
In order to trade liquidity sweeps profitably, you should learn to identify significant liquidity zones.
To spot them, analyze a historic price action and find clusters of important historic key levels.
Examine a price action on EURUSD on an hourly time frame.
I underlined multiple horizontal key levels.
The price respected each level, found support on them, and rebounded.
What is so specific about these levels is that they are lying close to each other, composing a liquidity cluster.
That fact that EURUSD strongly bounced from these levels suggests that buying interest and high buying volumes were concentrated around them.
We can unite these levels and treat them as a single demand zone that has just been broken and turned into a supply zone.
After we found a valid liquidity zone, we can look for a liquidity sweep.
First, we should let the price approach that area and look for a specific price behavior then.
That is a perfect example of a liquidity sweep.
You can see that the price formed a wide range candle with a long tail.
Its high went way beyond the underlined area, but its body closed within.
In order to understand, why a liquidity sweep occurred, let's zoom in our chart and try to understand a behavior of the market participants.
Our supply zone concentrated selling orders , we assume that sellers were placing their orders across its entire length.
Their stop losses were presumably lying above that area.
Smart Money know that and with a liquidity sweep they manipulate the market, making sellers close their positions in a loss (buying back their positions from the market) and providing a liquidity for big players.
After a formation of a such a candlestick, a reliable confirmation of a saturation of the Smart Money is a formation of a strong bearish candle - a clear sign of strength of the sellers.
A bearish engulfing candle above confirmed a completion of a liquidity sweep and indicates a highly probable bearish continuation.
Your perfect sell entry is immediately after a close of such a candlestick.
Stop loss should strictly lie above the high of a liquidity sweep.
Take profit is based on a local low.
Look, how quickly the price reached the goal.
Your strategy of trading liquidity sweeps of demand zones is absolutely the same.
Let the price test a demand zone, wait for a formation of wide range bearish candle with a tail going below its lows.
Wait for a bullish imbalance candle and buy immediately then.
Stop loss will be below the low of a liquidity sweep, take profit - a local high.
This SMC strategy works on any time frame and can be applied for trading any Forex pair, Gold, Silver, Crypto and commodities.
Try it by your own and let me know your results.
❤️Please, support my work with like, thank you!❤️
I am part of Trade Nation's Influencer program and receive a monthly fee for using their TradingView charts in my analysis.

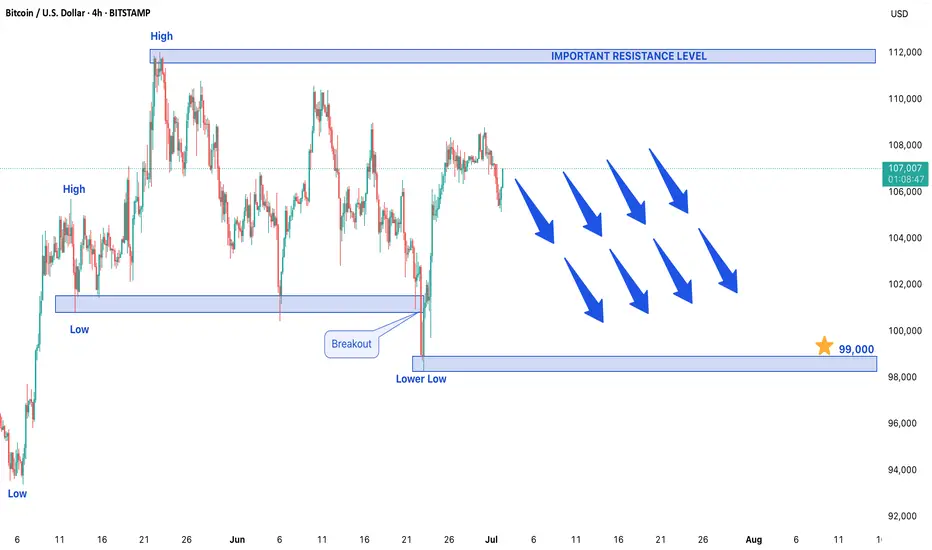
BITCOIN STRATED FORMING BEARISH TREND STRUCTUREBITCOIN SHOWS SIGNS OF BEARISH REVERSAL – KEY LEVELS TO WATCH
After an extended bullish run, Bitcoin is now showing early signs of a potential trend reversal as the market begins forming a bearish structure. The formation of a lower low on the price chart indicates weakening bullish momentum and suggests that sellers may be gaining control. This development comes after a sustained upward trend, signaling that a corrective phase could be underway in the cryptocurrency market.
Bearish Confirmation: Lower Low Formation
The appearance of a lower low is one of the most reliable technical indicators of a trend reversal. This pattern demonstrates that bears are successfully pushing prices below previous support levels, establishing a new downward trajectory. While this doesn't necessarily confirm a long-term bear market, it does suggest that Bitcoin could face further downside pressure in the near term. Traders should watch for confirmation through follow-through selling or additional bearish candlestick patterns.
Downside Target: $99,000 in Focus
If the bearish momentum continues, Bitcoin could test the $99,000 support level in upcoming trading sessions. This level represents a psychologically important zone where buyers may attempt to step in. However, a decisive break below this support could accelerate declines, potentially leading to deeper corrections. Traders should monitor volume and price action around this level for signs of either consolidation or continuation of the downtrend.
Resistance Level: $12,000 as Key Barrier
On the upside, $12,000 now acts as a critical resistance level. Any short-term rallies toward this zone could attract renewed selling pressure, reinforcing the bearish outlook. For the current downtrend to be invalidated, Bitcoin would need to reclaim and sustain above this resistance with strong buying volume. Until then, traders may consider selling into strength near this level while maintaining tight risk management.
Market Outlook: Correction Expected After Prolonged Rally
Given Bitcoin's history of volatile price swings, this potential reversal should not come as a complete surprise after its extended bullish run. Market participants should watch for:
- Increasing trading volume on downward moves (confirming bearish conviction)
- Potential bearish continuation patterns (like descending triangles or flag formations)
- Macro factors that could influence crypto markets (regulatory news, ETF flows, or macroeconomic shifts)
Conclusion
Bitcoin appears to be entering a corrective phase, with $99,000 as the next key downside target and $12,000 serving as major resistance. While the broader uptrend may still be intact long-term, short-term traders should prepare for potential bearish continuation. As always, proper position sizing and stop-loss strategies remain crucial in navigating Bitcoin's inherent volatility. A break above $12,000 would require reassessment of the bearish outlook.
VETUSDT Cryptocurrency Futures Market Disclaimer 🚨🚨🚨
Trading cryptocurrency futures involves high risks and is not suitable for all investors.
Cryptocurrency prices are highly volatile, which can lead to significant gains or losses in a short period.
Before engaging in crypto futures trading, consider your risk tolerance, experience, and financial situation.
Risk of Loss: You may lose more than your initial capital due to the leveraged nature of futures. You are fully responsible for any losses incurred.
Market Volatility: Crypto prices can fluctuate significantly due to factors such as market sentiment, regulations, or unforeseen events.
Leverage Risk: The use of leverage can amplify profits but also increases the risk of total loss.
Regulatory Uncertainty: Regulations related to cryptocurrencies vary by jurisdiction and may change, affecting the value or legality of trading.
Technical Risks: Platform disruptions, hacking, or technical issues may result in losses.
This information is not financial, investment, or trading advice. Consult a professional financial advisor before making decisions. We are not liable for any losses or damages arising from cryptocurrency futures trading.
Note: Ensure compliance with local regulations regarding cryptocurrency trading in your region.
thanks for like and follow @ydnldn to have more information outlook and free signal.
About me :
"I am a passionate swing trader focused on analyzing financial markets to capture profit opportunities from medium-term price movements. With a disciplined approach and in-depth technical analysis, I concentrate on identifying trends, support-resistance levels, and price patterns to make informed trading decisions. I prioritize strict risk management to protect capital while maximizing profit potential. Always learning and adapting to market dynamics, I enjoy the process of refining strategies to achieve consistency in trading."

NAS100 Potential ReversalHi there,
The NAS100 is slightly bullish and fairly stagnant. It is consolidating between two key levels (orange lines). A break below the price might fall into deeper demand zones.
Short Notes
- **Elliott Wave**: 5-wave structure appears complete at resistance (22,137.8), signalling a possible reversal.
- **Liquidity Zones**: Price is at/near a major liquidity zone, increasing reversal risk.
- **Break High**: There's a potential for a false breakout above wave 5 before dropping.
- **Support Levels**: The 21,800.6 (previous day high) and 21,146.2 (previous day low) for first support.
- **Demand Zones**: Strong demand below 21,146.2, with deeper support near 20,000 and 18,800.
- **Overview: A possible bearish move ahead from current highs, targeting lower demand zones.
Happy Trading,
K.
Not trading advice

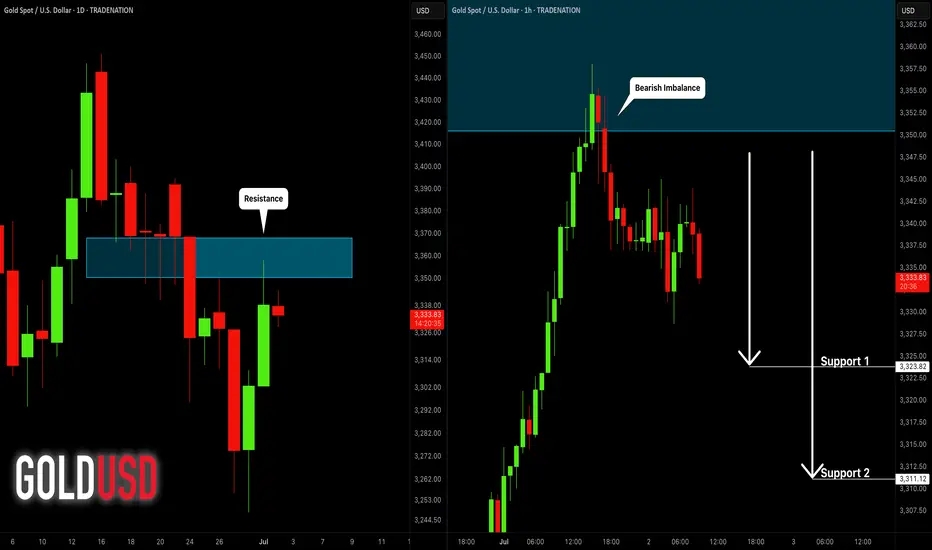
GOLD (XAUUSD): Bearish Move From Resistance
Gold went overbought after a test of a key daily resistance cluster.
A formation of multiple bearish imbalance candles on an hourly time frame
signifies a local dominance of the sellers.
The price will continue retracing at least to 3323 support.
❤️Please, support my work with like, thank you!❤️
I am part of Trade Nation's Influencer program and receive a monthly fee for using their TradingView charts in my analysis.
GJ Potentially BearishHi there,
We take another look at GJ. I see an ascending channel pattern with GBP/JPY trading within parallel trendlines. The pair respected both the upper and lower boundaries of this bullish channel, with the current price action showing consolidation near the upper resistance around 198.20 levels.
🎙️ **Key Support and Resistance Levels**
We have critical levels at the time of this writing as following:
- **Immediate Support**: 197.30 (61.8% Fibonacci retracement level) and 196.434 (38.2% Fibonacci retracement)
- **Major Support**: 194.0 37 representing the main channel support
- **Resistance**: 198.80 acting as the primary obstacle.
- **Extended Target**: 199.55 as the next potential bullish objective
**Wave Structure Analysis**
We have ABC wave pattern, with the pair seeming to have completed a Wave (C) bullish rally and now forming a temporary retracement. The current consolidation suggests the pair is "catching its breath" before a breakout.
## 🎲 Some Fundamental Highlights Appealing to Bullish Bias:
**1. Bank of England's Cautious Easing Stance**
BoE Governor Bailey has signaled a "gradual and careful" approach to monetary policy, pointing to sticky inflation concerns while acknowledging a softening labor market with over 100,000 fewer payrolled workers in May. This measured approach is keeping the British Pound supported near year-to-date highs.
**2. Bank of Japan's Divided Policy Response**
The BoJ remains cautious despite rising inflationary pressures, with Governor Ueda maintaining a data-dependent approach. While hawkish board member Naoki Tamura suggests "decisive" rate hikes may be needed, the central bank's measured pace at just 0.5% rates keeps the Yen defensive against stronger currencies.
**3. Inflation Dynamics Favoring GBP**
Japan's Consumer Price Index has surged due to higher food and energy costs, yet the BoJ's hesitant response contrasts with the BoE's more proactive stance on inflation management. This divergence in central bank responses to inflation is supporting GBP strength against the Yen.
**4. Upcoming Japanese Economic Data Releases**
Key Japanese economic indicators are scheduled for release, including June Tokyo CPI, May Unemployment Rate, and Retail Trade data. These releases could provide clarity on the BoJ's future policy direction and potentially impact the Yen's performance against the Pound.
Happy Trading,
K.
Not trading advice.

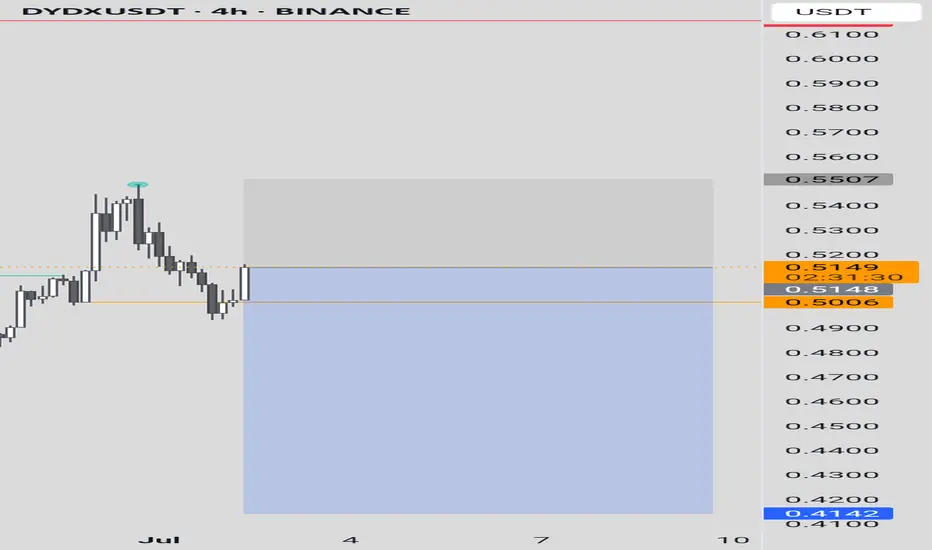
PIVXUSDT Holding Key Support Within Falling WedgePIVXUSDT continues its descent within a falling wedge structure, currently stabilizing above a key support zone. Price is now poised to retest the Immediate Internal Resistance Level.
A breakout above this level could trigger a reversal, while rejection may lead to a new low toward the strong accumulation zone a potential high-probability buy area. Targets toward the projected final upside are highlighted on the chart.
Monitor closely for confirmation at the resistance level to define the next move recommended.

DYDXUSDT Cryptocurrency Futures Market Disclaimer 🚨🚨🚨
Trading cryptocurrency futures involves high risks and is not suitable for all investors.
Cryptocurrency prices are highly volatile, which can lead to significant gains or losses in a short period.
Before engaging in crypto futures trading, consider your risk tolerance, experience, and financial situation.
Risk of Loss: You may lose more than your initial capital due to the leveraged nature of futures. You are fully responsible for any losses incurred.
Market Volatility: Crypto prices can fluctuate significantly due to factors such as market sentiment, regulations, or unforeseen events.
Leverage Risk: The use of leverage can amplify profits but also increases the risk of total loss.
Regulatory Uncertainty: Regulations related to cryptocurrencies vary by jurisdiction and may change, affecting the value or legality of trading.
Technical Risks: Platform disruptions, hacking, or technical issues may result in losses.
This information is not financial, investment, or trading advice. Consult a professional financial advisor before making decisions. We are not liable for any losses or damages arising from cryptocurrency futures trading.
Note: Ensure compliance with local regulations regarding cryptocurrency trading in your region.
thanks for like and follow @ydnldn
About me :
"I am a passionate swing trader focused on analyzing financial markets to capture profit opportunities from medium-term price movements. With a disciplined approach and in-depth technical analysis, I concentrate on identifying trends, support-resistance levels, and price patterns to make informed trading decisions. I prioritize strict risk management to protect capital while maximizing profit potential. Always learning and adapting to market dynamics, I enjoy the process of refining strategies to achieve consistency in trading."
NQ Power Range Report with FIB Ext - 7/2/2025 SessionCME_MINI:NQU2025
- PR High: 22723.00
- PR Low: 22683.00
- NZ Spread: 89.5
Key scheduled economic events:
08:15 | ADP Nonfarm Employment Change
10:30 | Crude Oil Inventories
Session Open Stats (As of 12:25 AM 7/2)
- Session Open ATR: 328.85
- Volume: 20K
- Open Int: 265K
- Trend Grade: Neutral
- From BA ATH: -0.8% (Rounded)
Key Levels (Rounded - Think of these as ranges)
- Long: 23239
- Mid: 21525
- Short: 20383
Keep in mind this is not speculation or a prediction. Only a report of the Power Range with Fib extensions for target hunting. Do your DD! You determine your risk tolerance. You are fully capable of making your own decisions.
BA: Back Adjusted
BuZ/BeZ: Bull Zone / Bear Zone
NZ: Neutral Zone

U.S. dollar index DXY analysis- daily time frame ✅ U.S. Dollar Index (DXY) Analysis — Daily Timeframe
👤 A TVC:DXY trader’s perspective:
When I look at this chart, several key points immediately stand out:
1️⃣ Long-Term Trend
On the weekly and daily timeframe, the major trend has turned bearish after peaking around 114. We see a clear series of lower highs and lower lows confirming the downtrend.
The sharp rally from 89 to 114 in the past was a strong impulsive move, which is now undergoing a deep correction. Currently, price is hovering around a major historical support near 96.
2️⃣ Key Support Zone
The current price near 96.7 is sitting right at a significant support area that has triggered considerable buying interest in the past.
If this support decisively breaks, the green zone marked as DD (around 93–95) represents a strong long-term demand zone and will likely be the next liquidity target for buyers.
3️⃣ Resistance (Supply Zones)
The four red-marked 4HR zones between 97 and 101.9 clearly show significant supply zones where sellers have stepped in on lower timeframes.
Should the price attempt a bounce from current levels, these resistance areas may act as a strong barrier to further upside.
4️⃣ Price Structure and Liquidity
Looking more closely, the market seems to be moving from a consolidation phase toward lower support liquidity. That means there is a high probability of a liquidity grab toward the 93–95 area before a potential fresh bullish leg.
At higher levels, unless the price can break and hold above 98 and then 100, we cannot confirm a trend reversal.
🔹 Summary
✅ Overall downtrend remains dominant
✅ 96–97 is a critical support zone
✅ A break below this support targets 93–95
✅ Trend reversal only possible with a confirmed break and hold above 98, and then 100–101
✅ The 4HR resistance zones (97–101) are strong hurdles for any bullish retracement
✅ As long as price remains below 98, any rally is likely just a corrective move
⚠️ Disclaimer: This analysis is for educational and informational purposes only and does not constitute financial advice or a recommendation to buy or sell. All trading decisions are solely your own responsibility.

AUDNZD 01/07/2025Weekly:
-Inverse H&S pattern.
-Previous week low liquidity sweep.
Daily:
-Inverse H&S pattern.
-Bullish M pattern.
4H:
-Inverse H&S pattern.
-IC.
TradingView

#GBPUSD: Detailed View Of Next Possible Price Move! GBPUSD exhibited a favourable movement after rejecting a pivotal level previously identified. We anticipate a smooth upward trajectory, potentially reaching approximately 1.45. Conversely, the US Dollar is on the brink of collapse around 90, which will directly propel the price into our take-profit range.
During GBPUSD trading, it is imperative to adhere to precise risk management principles. Significant news is scheduled to be released later this week.
We kindly request your support by liking, commenting, and sharing this idea.
Team Setupsfx_

Snowflake Inc Stock Quote | Chart & Forecast SummaryKey Indicators On Trade Set Up In General
1. Push Set Up
2. Range Set Up
3. Break & Retest Set Up
Notes On Session
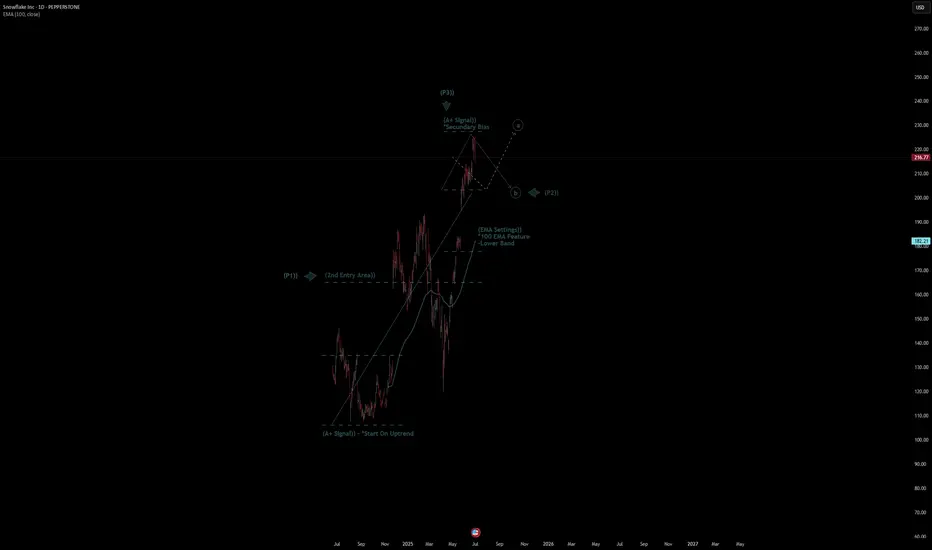
# Snowflake Inc Stock Quote
- Double Formation
* (A+ SIgnal)) - *Start On Uptrend | Completed Survey
* (2nd Entry Area)) | Subdivision 1
- Triple Formation
* (P1)) / (P2)) & (P3)) | Subdivision 2
* (TP1) = a / Long Consecutive Range
* (TP2) = b / Short Consecutive Pullback | Subdivision 3
* Daily Time Frame | Trend Settings Condition
- (Hypothesis On Entry Bias)) | Regular Settings
- Position On A 1.5RR
* Stop Loss At 201.00 USD
* Entry At 216.00 USD
* Take Profit At 240.00 USD
* (Uptrend Argument)) & No Pattern Confirmation
* Ongoing Entry & (Neutral Area))
Active Sessions On Relevant Range & Elemented Probabilities;
European-Session(Upwards) - East Coast-Session(Downwards) - Asian-Session(Ranging)
Conclusion | Trade Plan Execution & Risk Management On Demand;
Overall Consensus | Buy
XAU USD 2HR CHART ANALYSIS 🔎 XAUUSD (Gold Spot) 2H Chart Analysis:
✅ Price recently made a strong bullish rally up to the resistance zone between 3346–3368.
✅ A supply zone has been marked in this area, which is currently causing a bearish reaction.
✅ BOS (Break of Structure) and ChoCH (Change of Character) labels on the chart indicate that the overall market structure has been bearish, and price has now retraced to this supply area for a potential pullback.
✅ The trader appears to have taken a short position with a stop loss around 3368 and a target around 3259, giving a risk-reward ratio of approximately 1:3.
---
🔎 Possible Scenarios:
✅ Bearish Scenario (preferred):
If the supply zone at 3346–3368 holds and price rejects from there, the logical target could be the previous support near 3259, in line with market structure and bearish momentum.
✅ Bullish Scenario (invalidation):
If price breaks above 3368 with strength and confirms a candle close above, that would invalidate the supply zone, and the uptrend may resume toward higher levels around 3418 (previous highs).
---
🔎 Key Levels:
✔️ Resistance (Supply Zone): 3346–3368
✔️ Support (Demand Zone): 3259–3244
✔️ Market Structure: bearish, with a pullback into supply
✔️ Stop loss (for the short): above 3368
✔️ Target: around 3259
---
This analysis is not financial advice and does not constitute a trade recommendation.
OANDA:XAUUSD

CADJPY Short IdeaThis is a **CAD/JPY** (Canadian Dollar / Japanese Yen) short setup on the **2-hour chart**, structured around a **Head and Shoulders pattern** and a **break of structure**, supported by multi-timeframe bearish bias.
### **Trade Description:**
* **Direction**: SELL
* **Entry Plan**: After the recent **break of structure** to the downside, the trader is waiting for a **retest** of the broken support zone (now resistance) and a **bearish engulfing candle** on any timeframe (1H, 2H, or 4H) to enter short.
* **Stop Loss**: Just above the retest zone (\~105.95 - 106.00)
* **Take Profit**: Targeting \~103.95 area
* **Risk/Reward**: Approximately 3.5:1 RRR
---
### **Reasoning Behind the Trade:**
#### ✅ **Technical Setup:**
1. **Head and Shoulders Pattern**:
* A classic **reversal pattern** visible, with the right shoulder confirming lower highs.
* The neckline has been broken — signaling trend reversal from bullish to bearish.
2. **Structure Break**:
* Price has **broken below previous higher lows**, confirming a shift in structure.
* A retest of the broken level is anticipated before the next move down.
3. **Confluence Zones**:
* The **Daily Area of Interest (AOI)** lies around 105.00–105.20.
* EMA cluster (blue and red lines) above current price adds resistance pressure.
4. **Engulfing Candle Confirmation**:
* The entry is not immediate — we wait for **bearish confirmation** via engulfing candle (on 1H/2H/4H depending on clarity).
---
### **Multi-Timeframe Bias:**
* **Weekly (W): Bullish**
* **Daily (D): Bearish**
* **12H / 6H / 4H: Bearish**
* → Overall bias: **80% Bearish**, supporting a short position.
---
### **Summary:**
The trader is looking to short CAD/JPY after a **clear break of structure and neckline**, within a **bearish market context on most higher timeframes**, waiting for a cleaner **bearish engulfing signal on the retest** before executing. The trade targets a zone below 104.00 for a strong reward-to-risk potential.
