GBPCADThe first level I’ve marked is a short-term zone.
If we get a strong buy signal there with good R/R, I’ll enter and trail aggressively.
The second level is a stronger demand zone and a better area for potential long setups.
❗️Remember: These are just scenarios — not predictions.
We stay ready for whatever the market delivers.
Supply and Demand

AUDUSD: Bullish Continuation After Breakout 🇦🇺🇺🇸
AUDUSD is going to rise more following a bullish breakout
of a key daily/intraday horizontal resistance.
Next goal - 0.66
❤️Please, support my work with like, thank you!❤️
I am part of Trade Nation's Influencer program and receive a monthly fee for using their TradingView charts in my analysis.

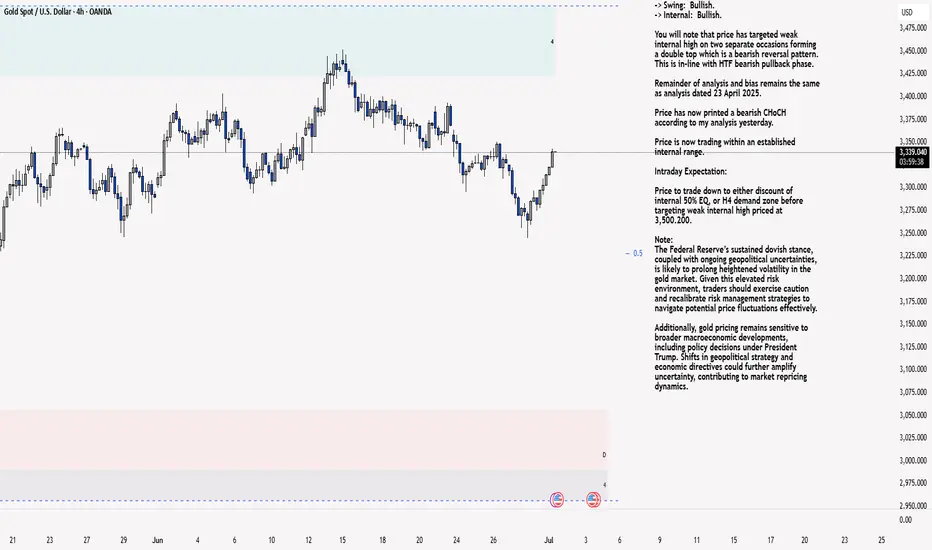
XAU/USD 01 July 2025 Intraday AnalysisH4 Analysis:
-> Swing: Bullish.
-> Internal: Bullish.
You will note that price has targeted weak internal high on two separate occasions forming a double top which is a bearish reversal pattern. This is in-line with HTF bearish pullback phase.
Remainder of analysis and bias remains the same as analysis dated 23 April 2025.
Price has now printed a bearish CHoCH according to my analysis yesterday.
Price is now trading within an established internal range.
Intraday Expectation:
Price to trade down to either discount of internal 50% EQ, or H4 demand zone before targeting weak internal high priced at 3,500.200.
Note:
The Federal Reserve’s sustained dovish stance, coupled with ongoing geopolitical uncertainties, is likely to prolong heightened volatility in the gold market. Given this elevated risk environment, traders should exercise caution and recalibrate risk management strategies to navigate potential price fluctuations effectively.
Additionally, gold pricing remains sensitive to broader macroeconomic developments, including policy decisions under President Trump. Shifts in geopolitical strategy and economic directives could further amplify uncertainty, contributing to market repricing dynamics.
H4 Chart:
M15 Analysis:
-> Swing: Bullish.
-> Internal: Bullish.
H4 Timeframe - Price has failed to target weak internal high, therefore, it would not be unrealistic if price printed a bearish iBOS.
The remainder of my analysis shall remain the same as analysis dated 13 June 2025, apart from target price.
As per my analysis dated 22 May 2025 whereby I mentioned price can be seen to be reacting at discount of 50% EQ on H4 timeframe, therefore, it is a viable alternative that price could potentially print a bullish iBOS on M15 timeframe despite internal structure being bearish.
Price has printed a bullish iBOS followed by a bearish CHoCH, which indicates, but does not confirm, bearish pullback phase initiation. I will however continue to monitor, with respect to depth of pullback.
Intraday Expectation:
Price to continue bearish, react at either M15 supply zone, or discount of 50% internal EQ before targeting weak internal high priced at 3,451.375.
Note:
Gold remains highly volatile amid the Federal Reserve's continued dovish stance, persistent and escalating geopolitical uncertainties. Traders should implement robust risk management strategies and remain vigilant, as price swings may become more pronounced in this elevated volatility environment.
Additionally, President Trump’s recent tariff announcements are expected to further amplify market turbulence, potentially triggering sharp price fluctuations and whipsaws.
M15 Chart:
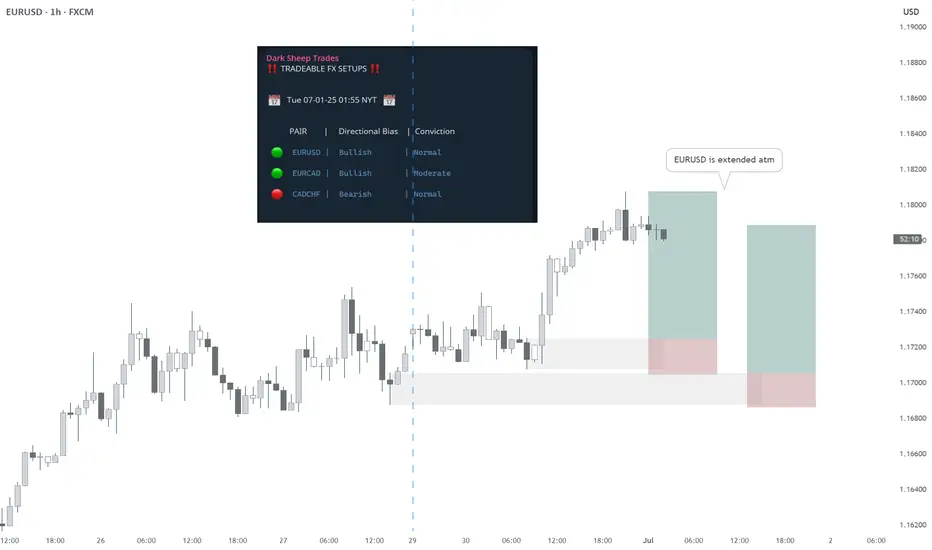
EURUSD BUY - Statistically-backed FX shortlistEURUSD BUY
Daily Outlook: Statistically-backed FX shortlist
@darksheeptrades
NZDCHF – Waiting for a Reaction at Key LevelWe’re waiting for price to reach our marked zone.
✅ Short is the primary scenario — but only with a valid bearish signal.
❗️If the zone breaks and price confirms above, we’ll look to buy after a proper pullback and signal.
We don’t predict — we prepare.
The market decides, we just follow with structure and discipline.

NQ Power Range Report with FIB Ext - 7/1/2025 SessionCME_MINI:NQU2025
- PR High: 22886.75
- PR Low: 22852.50
- NZ Spread: 76.75
Key scheduled economic events:
09:30 | Fed Chair Powell Speaks
09:45 | S&P Global Manufacturing PMI
10:00 | ISM Manufacturing PMI
- ISM Manufacturing Services
- JOLTs Job Openings
Holding in ATH range
Session Open Stats (As of 12:45 AM 7/1)
- Session Open ATR: 329.32
- Volume: 21K
- Open Int: 269K
- Trend Grade: Neutral
- From BA ATH: -0.1% (Rounded)
Key Levels (Rounded - Think of these as ranges)
- Long: 23239
- Mid: 21525
- Short: 20383
Keep in mind this is not speculation or a prediction. Only a report of the Power Range with Fib extensions for target hunting. Do your DD! You determine your risk tolerance. You are fully capable of making your own decisions.
BA: Back Adjusted
BuZ/BeZ: Bull Zone / Bear Zone
NZ: Neutral Zone

CHF/JPY 15-Minute Time Frame (15TF) Technical & Fundamental AnalCHF/JPY 15-Minute Time Frame (15TF) Technical & Fundamental Analysis
CHF/JPY continues to show strong momentum, currently trading in the 181.45 – 181.60 range just shy of recent highs around 181.80. The pair is up roughly +4.4% YTD, with a +3.8% gain in the past month, maintaining bullish strength driven by broader USD softness and ongoing haven flows.
Continued USD weakness may further sustain CHF/JPY upside, while safe-haven demand continues to support both the Swiss franc and Japanese yen especially if global risk sentiment worsens.
Technical Outlook:
On the 15-minute timeframe, CHF/JPY previously consolidated above a visible support area at 181.200, forming a base after breaking through key resistance at 181.400. This breakout was followed by accumulated buy orders and a liquidity hunt within the 181.200–181.400 zone a classic sign of smart money manipulation.
After sweeping the zone and retesting the structure, the pair is now poised for a potential continuation move. The next key step is for price to close a bullish candle above the 181.460 area, aligning with bullish order flow continuation.
📊 Trade Setup
📍 Area of Interest (AOI): 181.460 (Buy Stop Order)
🛡 Stop-Loss: 181.280 (Just below liquidity zone)
🎯 Take Profit: 181.830 (Next minor key resistance / ~1:2 RR)
📌 Disclaimer:
This is not financial advice. Always wait for proper confirmation before executing trades. Manage risk wisely and trade what you see—not what you feel.

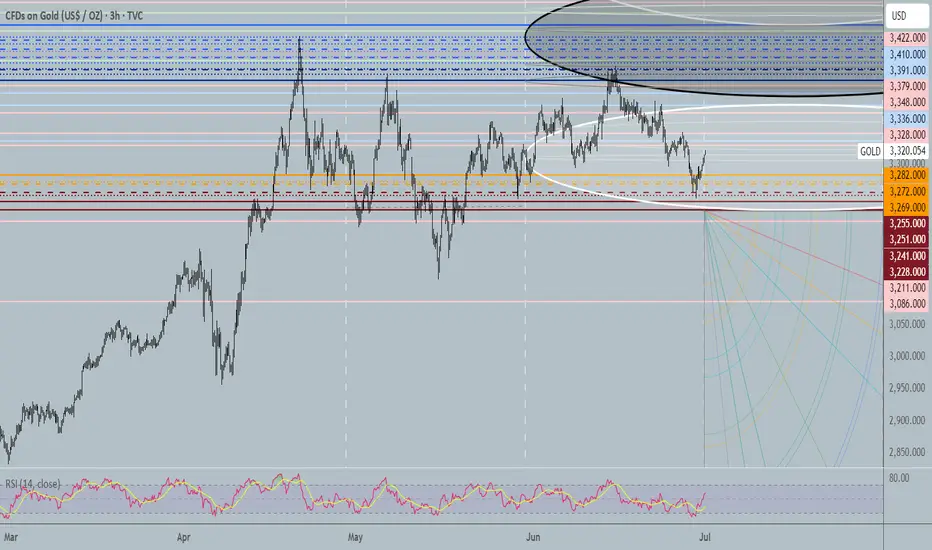
Key Levels for the Month 07/2025 ∷Gold∷🐍 Key Levels Overview for the Month 🐍
__________________________
Trend Base Lines
3227🐂🐂3392
3405🏛🏛3588
3516🐻🐻3810
__________________________
Resistances🔀
4049
3883
3822
3766
3743
3653
3587
3562
3535
3507
3461
Mids∷∷∷
3717
3585
3516
3430
3410
3391
3336
Supports🔀
3552
3422
3379
3348
3328
3282
3241
3228
3211
3086
RESPONSIVE INDUSTRIESResponsive Industries Ltd. is a specialized manufacturer of vinyl flooring, synthetic leather, and luxury vinyl tiles (LVT) used in infrastructure, automotive, and lifestyle segments. It has a growing international footprint, with exports contributing significantly to its revenue mix. The stock is currently trading at INR 237.00, showing a sharp uptick on the back of strong volume and renewed investor interest.
Key Levels
Support Levels: INR 137.05, INR 164.90, INR 199.30 Swing Level: INR 237.00 Possible Upside: INR 318.95, INR 363.30, INR 419.80
Technical Indicators
RSI (Relative Strength Index): At 51.18, the RSI signals a neutral to mildly bullish setup. While not yet overextended, it hints at improving strength following recent accumulation.
Volume: At 4.66M, volume has expanded alongside price, indicating strong institutional interest and increased market participation.
Sector and Market Outlook
Responsive Industries operates in the infrastructure-linked materials and engineered surface solutions space, benefiting from:
Rising demand for affordable and decorative flooring in commercial real estate and transit hubs
Government-backed infra investment in healthcare and education facilities
Global shift toward eco-friendly, customizable vinyl solutions
Risks include exposure to PVC price volatility, logistics and export cycle sensitivity, and fluctuating margins due to competition and input costs.
Latest Developments
Export Growth: Significant volume growth reported in key geographies including Europe and Middle East
Product Innovation: Launch of high-durability and antimicrobial vinyl flooring for institutional use
Financial Performance: Operating margins improved on the back of scale efficiencies and better realization per unit
Dividend Update
Responsive Industries declared a dividend of ₹1.50 per share, reflecting improved profitability and a consistent payout policy.
Analysis Summary
Responsive Industries is gaining upward traction after a prolonged base formation. With volume expanding and indicators turning constructive, the stock appears to be transitioning into a positive trend. Supported by sector tailwinds and operational leverage, it presents a compelling case for further attention among mid-cap industrial growth names.

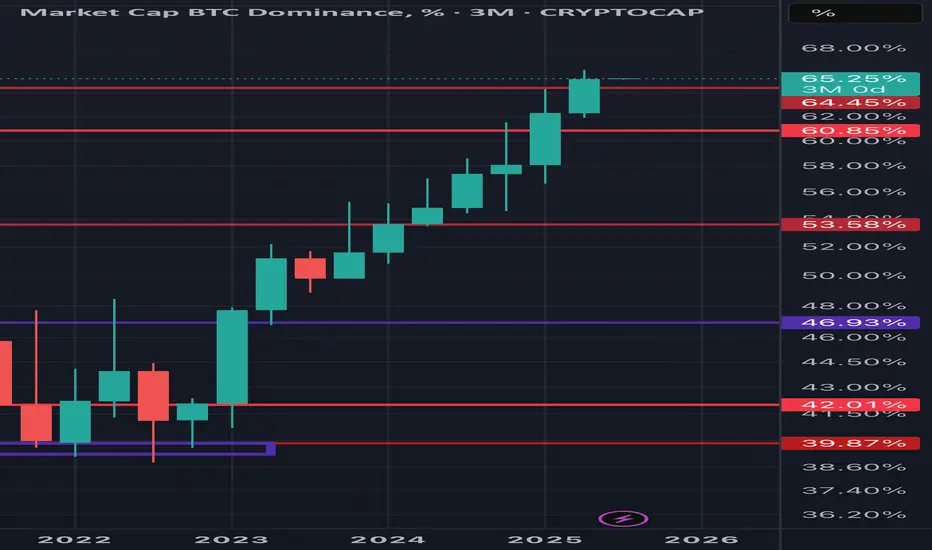
BTCDIs this chart not crazy to look at.
You didn’t even have to front run alts this cycle just still in BTC until it’s time.
This next candle you would think we will see red.
Gold (XAUUSD) – July 1 Analysis📍 H4 Key LH Zone: 3348.500 – 3350.500
This is a major decision zone.
Current market structure:
🔸 M15 is in an uptrend with confirmed ChoCh + BoS
What to watch:
We’re approaching the H4 LH supply zone — now we observe how price behaves here.
🔹 If price breaks above this H4 LH zone:
→ HTF and LTF trends align to the upside
→ Potential continuation of the bullish move
🔹 If price respects and stays below this LH zone:
→ Then this recent up-move could be a pullback
→ We may see a new low forming — so be cautious
📍 M15 Zones for Long Setup (if confirmed):
• 3309.500 – 3312.500 (Order Block Zone)
• 3302.500 – 3304.600 (Demand Zone)
We will watch these levels closely.
If price respects these zones and gives M1 confirmation (ChoCh + BoS) — we’ll plan for long entries accordingly.
📖 Let structure guide your decisions. Let price speak first.
📘 Shared by @ChartIsMirror
Author of The Chart Is The Mirror — a structure-first, mindset-grounded book for traders

XAUUSD/GOLD Geopolitical conflicts have escalated again. Next week is a week of heavy news. How will the gold price focus next week? How to trade? Look at the news preview first.
1. Geopolitics, Russia-Ukraine conflict, Palestine-Israel conflict, Iran-Israel conflict.
2. ADP data, NFP data.
3. Tariff deadline.
The above three news are enough to cause drastic fluctuations in the gold price.
On Friday, the New York market followed my expectations. After rebounding around 3282, it fell back. Finally closed around 3274.
The impact of the weekend news is huge. From the news perspective, the opening price of next Monday will be higher than the closing price on Friday. In terms of operation, you can pay attention to buying at a low price after the market opens.

AUDJPY - Bullish flagWe have a bullish flag that has developed. I will be expecting to see a breakout long here soon. Trade & fag are based of the M5 timeframe.

AUDNZD 30/06/2025Weekly:
-Inverse H&S pattern.
-Previous week low liquidity sweep.
Daily:
-Inverse H&S pattern.
-Bullish M pattern.
4H:
-Inverse H&S pattern.
-IC.

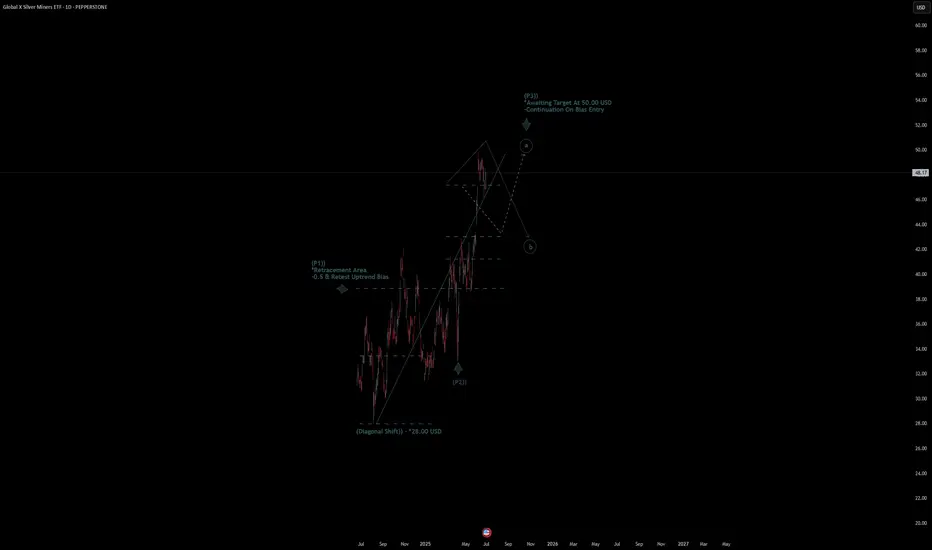
Global X SIlver ETF Quote | Chart & Forecast SummaryKey Indicators On Trade Set Up In General
1. Push Set Up
2. Range Set Up
3. Break & Retest Set Up
Notes On Session
# Global X SIlver ETF Quote
- Double Formation
* (Diagonal Shift)) - *28.00 USD | Completed Survey
* Awaiting Target At 50.00 USD
- Continuation On Bias Entry | Subdivision 1
- Triple Formation
* (P1)) / (P2)) & (P3)) | Subdivision 2
* (TP1) = a / Long Consecutive Range
* (TP2) = b / Short Consecutive Pullback | Subdivision 3
* Daily Time Frame | Trend Settings Condition
- (Hypothesis On Entry Bias)) | Regular Settings
- Position On A 1.5RR
* Stop Loss At 45.00 USD
* Entry At 48.00 USD
* Take Profit At 53.00 USD
* (Uptrend Argument)) & No Pattern Confirmation
* Ongoing Entry & (Neutral Area))
Active Sessions On Relevant Range & Elemented Probabilities;
European-Session(Upwards) - East Coast-Session(Downwards) - Asian-Session(Ranging)
Conclusion | Trade Plan Execution & Risk Management On Demand;
Overall Consensus | Buy
EURUSD OUTLOOK 1 - 4 JulyStill Bullish on EU. No Fundamental or technical reasons to be short.
We could have a short term pullback within the daily range to then continue long..
If we get that 4H pullback I will only long after getting a 4H technical confirmation.

USDCHF Wave Analysis – 30 June 2025
- USDCHF falling inside a minor impulse wave
- Likely to fall to support level 0.7900
USDCHF currency pair is falling strongly inside the minor impulse wave 3, which recently broke the daily down channel from the start of May.
The breakout of this down channel follows the earlier breakout of the key support level 0.8055 (which stopped the previous impulse waves (1) and i).
Given the strong daily downtrend and the continuous outflows from US dollar or risk-on mood, USDCHF currency pair can be expected to fall to the next support level 0.7900, the target price for the completion of the active impulse wave 3.

ZCXUSDT Breaks Key SupportZCXUSDT has broken below a strong support level, followed by a clean pullback and continuation to the downside. The projected target stands near $0.016, presenting a potential accumulation opportunity. If the structure plays out, the full downside objective aligns with the broader setup target highlighted on the chart.

USDCAD 4-hour chart
USDCAD is consistently trading within a clearly defined descending price channel, indicating a prevailing downtrend.
Price action is characterized by a series of lower highs and lower lows, respecting both the upper and lower boundaries of this channel.
The pair has recently encountered resistance near the upper channel boundary, leading to a turn lower.
Based on the established channel, the current price trajectory suggests a potential move towards the lower boundary of the descending channel.
Disclaimer:
The information provided in this chart is for educational and informational purposes only and should not be considered as investment advice. Trading and investing involve substantial risk and are not suitable for every investor. You should carefully consider your financial situation and consult with a financial advisor before making any investment decisions. The creator of this chart does not guarantee any specific outcome or profit and is not responsible for any losses incurred as a result of using this information. Past performance is not indicative of future results. Use this information at your own risk. This chart has been created for my own improvement in Trading and Investment Analysis. Please do your own analysis before any investments.

XAUUSD 4-hour chartXAUUSD
XAUUSD is broadly observed within an ascending price channel, suggesting an underlying bullish trend on this timeframe.
Key overhead resistance levels include the "Deciding Zone" and a higher "Flip Zone," which have historically acted as supply areas.
Immediate support is identified at the lower boundary of the ascending channel, with a deeper green demand zone offering further structural support.
The current price action indicates a bounce from the channel's lower boundary, with the "Deciding Zone" (marked with a red circle) presenting the next crucial test for market direction.
Disclaimer:
The information provided in this chart is for educational and informational purposes only and should not be considered as investment advice. Trading and investing involve substantial risk and are not suitable for every investor. You should carefully consider your financial situation and consult with a financial advisor before making any investment decisions. The creator of this chart does not guarantee any specific outcome or profit and is not responsible for any losses incurred as a result of using this information. Past performance is not indicative of future results. Use this information at your own risk. This chart has been created for my own improvement in Trading and Investment Analysis. Please do your own analysis before any investments.

AUDCAD Bulls update! Price is now approaching our first take profit (TP#1) at respected resistance level. I'm anticipating a small pullback from this area, followed by a potential continuation above the 0.89700 level.

Letting gas out of the fartcoin trade, back under $1Fart coin looks like shit. Looks to me like the gas has run out of this trade.
If we look at the chart, we can see that price has rejected resistance here and Heikin Ashi candles starting to show the bearish trend starting.
On top of that you have a massive head and shoulders top forming, which would be confirmed under $.88.
I think it's likely that we see the bottom supports get tagged from here.
Invalidation would be a break of $1.53.
