SUI Wave 3 of 3 Started?SUI appears to have completed a local wave (2) at the .618 Fibonacci retracement and a larger degree wave 2 at the alt-coin golden pocket between .618-.782
Triple resistance looms ahead of the daily 200EMA, major resistance High Volume Node and descending resistance trend line.
A breakthrough and close above will be a bullish sign with an initial target of the December swing high range $4.48
Analysis is invalidated below the $2.5 swing low, locking in ABC correction instead.
The bullish case is in jeopardy below $2.29 swing low.
Safe trading
Supply and Demand

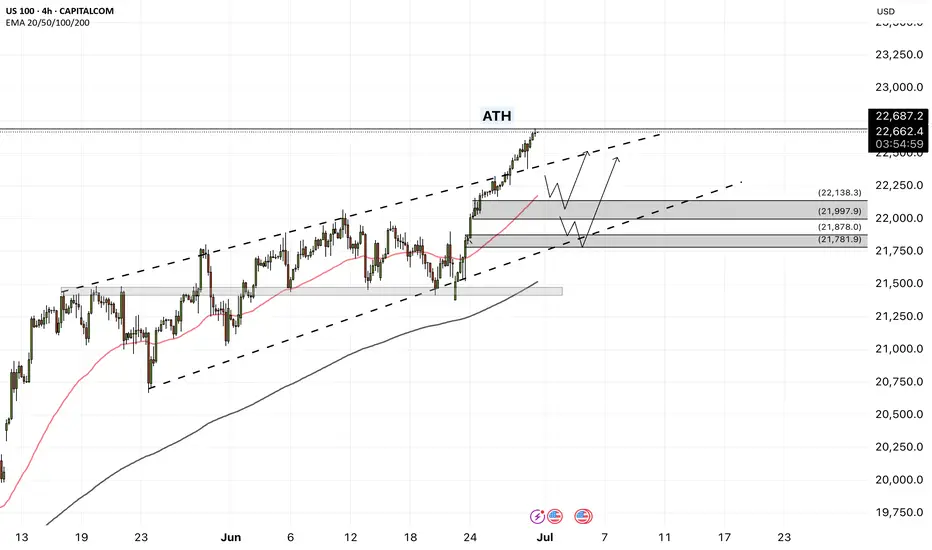
NAS100 - The stock market is breaking the ceiling!The index is above the EMA200 and EMA50 on the four-hour timeframe and is trading in its medium-term channels. If it does not increase and corrects towards different zone, it is possible to buy the index near the reward.
Following a strong rally in U.S.equities, the S&P 500 and Nasdaq indices both achieved new all-time highs on Friday. It marks the first time since February that the S&P 500 has surpassed its previous peak, while the Nasdaq entered fresh price territory for the first time since December.
Despite ongoing market focus on economic data and the Federal Reserve’s interest rate policy path, the simultaneous surge in both indices reflects a renewed appetite for risk in the stock market—an appetite that has been accelerating since mid-April, especially in tech stocks.
In contrast, the Russell 2000 index, which tracks small-cap U.S. companies, still remains significantly below its prior high. To return to its October levels, it would need to rise over 13.5%. However, Friday’s 1.7% gain suggests capital is beginning to flow more broadly into underrepresented sectors.
Analysts argue that a strong breakout in the Russell 2000 could signal a broader rotation toward increased risk-taking—possibly driven by optimism over future rate cuts, easing inflation, and improved business conditions in the second half of the year.
Now that the S&P 500 has reached new highs and the Nasdaq has joined in, attention turns to the Russell 2000. If it begins to accelerate upward, markets could enter a new phase of sustained bullish momentum.
Following a week focused on gauging U.S. consumer spending strength, the upcoming holiday-shortened week (due to Independence Day) will shift attention to key employment and economic activity data.
On Tuesday, markets await the ISM Manufacturing PMI and the JOLTS job openings report. Wednesday will spotlight the ADP private employment report, and Thursday—one day earlier than usual due to the holiday—will see the release of several crucial figures, including the Non-Farm Payrolls (NFP), weekly jobless claims, and the ISM Services Index.
Currently, investor reaction to Donald Trump’s tariff commentary has been minimal. Market participants largely believe that any new tariffs would have limited inflationary effects and that significant retaliation from trade partners is unlikely.
Friday’s PCE report painted a complex picture of the U.S. economy. On one hand, inflation remains above ideal levels; on the other, household spending is showing signs of fatigue—a combination that presents challenges for policymakers.
Inflation-adjusted personal consumption fell by 0.3%, marking the first decline since the start of the year and indicating a gradual erosion of domestic demand. While wages continue to rise, their impact has been offset by declining overall income and reduced government support. To maintain their lifestyle, households have dipped into their savings, driving the personal savings rate down to 4.5%—its lowest level this year.
On the inflation front, the core PCE price index—the Fed’s preferred inflation gauge—rose 2.7% year-over-year, slightly above expectations. Monthly inflation also increased by 0.2%. Although these figures appear somewhat restrained, they remain above the Fed’s 2% target, with persistent price pressures in services—particularly non-housing services—still evident.
Altogether, the data suggest the U.S. economy faces a troubling divergence: weakening household income and consumption could slow growth, while sticky inflation in the services sector—especially under a potential Trump tariff scenario—could limit the Federal Reserve’s ability to cut interest rates.
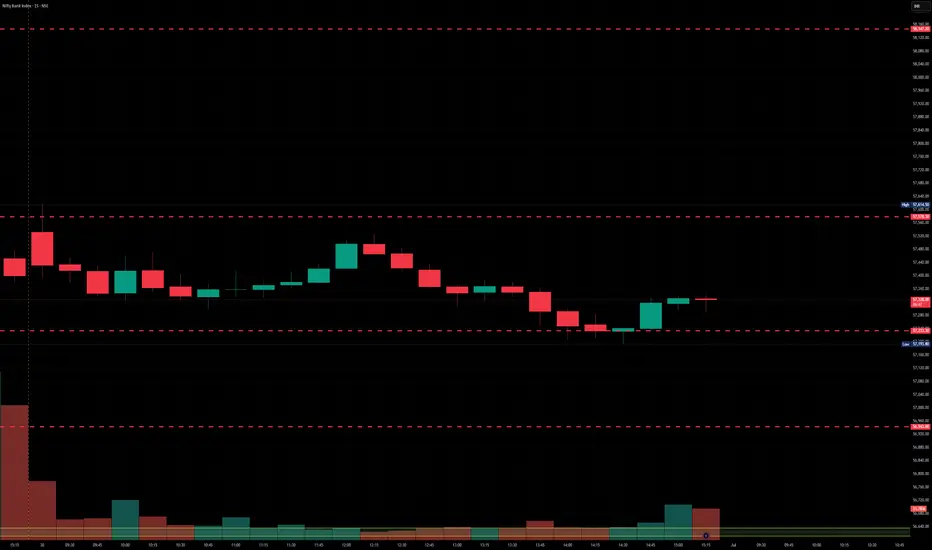
Nifty levels - Jul 01, 2025Nifty support and resistance levels are valuable tools for making informed trading decisions, specifically when combined with the analysis of 5-minute timeframe candlesticks and VWAP. By closely monitoring these levels and observing the price movements within this timeframe, traders can enhance the accuracy of their entry and exit points. It is important to bear in mind that support and resistance levels are not fixed, and they can change over time as market conditions evolve.
The dashed lines on the chart indicate the reaction levels, serving as additional points of significance to consider. Furthermore, take note of the response at the levels of the High, Low, and Close values from the day prior.
We hope you find this information beneficial in your trading endeavors.
* If you found the idea appealing, kindly tap the Boost icon located below the chart. We encourage you to share your thoughts and comments regarding it.
Wishing you success in your trading activities!

AAVE Ready For New Highs?AAVE is breaking out of its descending trendline after several tests as resistance.
Wave 2 appears complete at quadruple support: Daily 200EMA, daily pivot, .382 Fibonacci retracement and High Volume Node (HVN). If an Elliot Wave (3) of 3 is underway, price should move strongly sooner rather than later with extended price action.
The next major resistance and partial take profit is at the December swing high range $460.
Analysis is invalidated below $210.
Safe trading

BankNifty levels - Jul 01, 2025Utilizing the support and resistance levels of BankNifty, along with the 5-minute timeframe candlesticks and VWAP, can enhance the precision of trade entries and exits on or near these levels. It is crucial to recognize that these levels are not static, and they undergo alterations as market dynamics evolve.
The dashed lines on the chart indicate the reaction levels, serving as additional points of significance. Furthermore, take note of the response at the levels of the High, Low, and Close values from the day prior.
We trust that this information proves valuable to you.
* If you found the idea appealing, kindly tap the Boost icon located below the chart. We encourage you to share your thoughts and comments regarding it.
Wishing you successful trading endeavors!
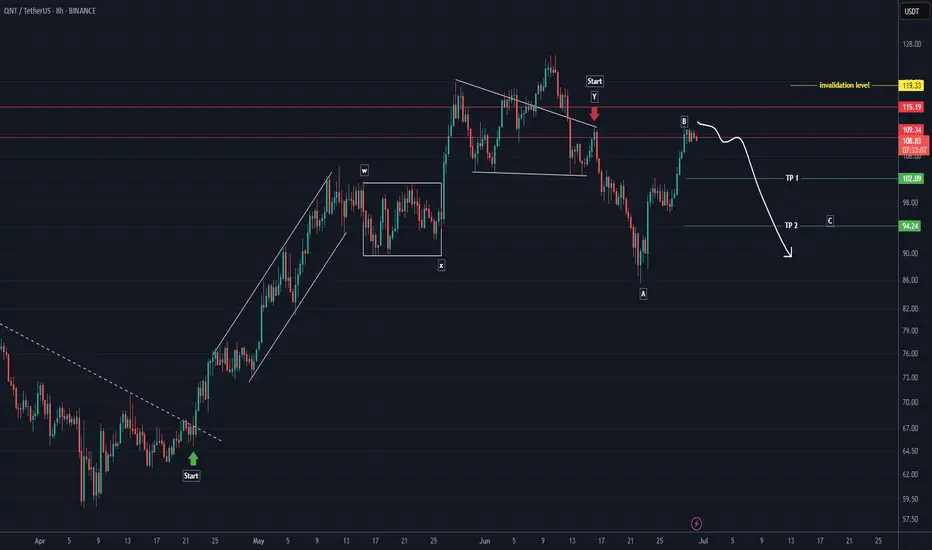
QNT Analysis (8H)From the point where we placed the red arrow on the chart, it seems that NEIRO’s correction has begun.
This correction appears to be a diagonal (diametric) pattern, and we are currently at the end of wave F.
Wave G could complete within the green zone, where we can look for a Rebuy setup.
The targets are marked on the chart.
If a daily candle closes below the invalidation level, this analysis will be invalidated.
For risk management, please don't forget stop loss and capital management
When we reach the first target, save some profit and then change the stop to entry
Comment if you have any questions
Thank You
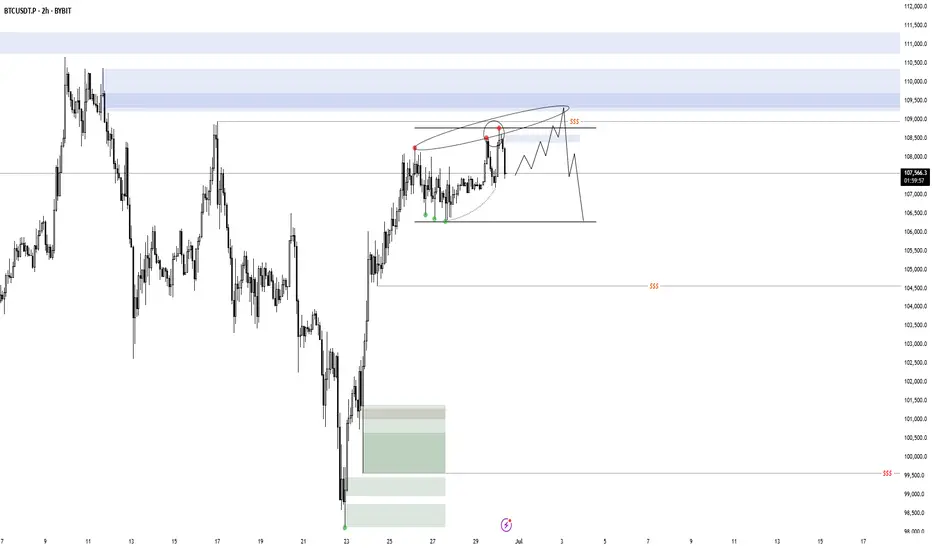
BTC 30.06.25So far BTC is behaving exactly as expected, i'm just waiting for a valid setup to appear. I would love to see a model 1, which takes out the high and mitigates supply, but i'm also not ignoring a potential model 2. These 2 deviations merge together on a higher time frame, where the range is also valid on, so they can be counted as one. There are many altcoins with similar behavior and USDT/C in potential accumulation. I'm waiting to see confirmations/ invalidations.
USDCHF..SHORT📌 USDCHF – Multi-Scenario Setup
This pair has two key levels: one short-term, the other long-term.
If price reaches the first level and shows solid bearish reaction, I’ll enter a short.
If that level breaks and confirms, I’ll go long—but manage the long aggressively, since I’ll look to exit around the higher level.
If the price pushes beyond even the second zone, I’ll be ready to buy again.
❗️I’m never upset by a loss or a broken level.
The market leads—I follow.
Claiming “it must drop from here” or “it has to rise” is wishful thinking, not trading.
✅ Stay calm, stay flexible, and stay prepared for every scenario.

MarketBreakdown | EURUSD, GBPUSD, USDJPY, USDCHF
Here are the updates & outlook for multiple instruments in my watch list.
1️⃣ #EURUSD weekly time frame 🇪🇺🇺🇸
The pair is unstoppable.
The market violated a significant weekly resistance cluster last week.
It opens more growth potential after a pullback.
2️⃣ #GBPUSD weekly time frame 🇬🇧🇺🇸
In comparison to EURUSD, GBPUSD is now approaching a major
resistance area. I think that we can expect a retracement from that.
3️⃣ #USDJPY daily time frame 🇺🇸🇯🇵
The market continues a correctional movement lower.
The closest strong support that I see is based on a rising trend line.
I think that buying interest may spark again after its text.
4️⃣ #USDCHF daily time frame 🇺🇸🇨🇭
The price updated a historic low on Friday.
The next strong support that I see is based on a falling trend line.
We can expect a pullback from that.
Do you agree with my market breakdown?
❤️Please, support my work with like, thank you!❤️
I am part of Trade Nation's Influencer program and receive a monthly fee for using their TradingView charts in my analysis.

THE KOG REPORTTHE KOG REPORT:
In last week’s KOG Report we said we would be looking for price to attempt that higher level and potentially break for higher pricing. If it didn’t the path showed the level for an opportunity to short which fell just short but worked well into the level we initially wanted.
We then published the red box targets and the bias through the week which held, and we managed to complete all bearish targets by Friday.
Was it easy? No! Did we expect that flush? No! We simply got to a stage on Friday where we could only watch or get in with the volume, so we stood back and just watched.
So, what can we expect in the week ahead?
Simple one this week. We can see potential for lower, however, we’re too low to attempt shorting this, especially with the key level 3250-55 just below and major support. For that reason, we published the red boxes to help you all, look for the break either side! Ideally, we want to support on the low from the open and then continue with the move upside into the 3280-85 level initially, which should flip us on the support at 3270-75. We could range there as there is no news tomorrow but a gradual incline is what we’re looking for.
Support 3250-55 needs to break for lower, while resistance 3306-10 is the level that needs to break to go higher. That’s our potential range for now.
KOG’s bias for the week:
Bullish above 3250 with targets above 3278, 3285, 3297 and above that 3306
Bearish below 3250 with targets below 3240, 3232, 3220 and below that 3212
RED BOX TARGETS:
Break above 3275 for 3279, 3285, 3289 and 3306 in extension of the move
Break below 3260 for 3255, 3251, 3240 and 3235 in extension of the move
Please do support us by hitting the like button, leaving a comment, and giving us a follow. We’ve been doing this for a long time now providing traders with in-depth free analysis on Gold, so your likes and comments are very much appreciated.
As always, trade safe.
KOG

GBPUSD Selling from resistance at 1.37600📈 GBPUSD – Technical Analysis (4H Timeframe)
The pair is currently respecting an ascending channel, but price is reacting to a key resistance at 1.37600, indicating a potential short opportunity.
🔻 Sell Scenario:
If rejection holds, we could see a move toward the following technical targets:
📍 1st Target – 1.36000 (Demand Zone)
📍 2nd Target – 1.34000 (Demand Zone)
📍 3rd Target – 1.32500 (Bullish Order Block)
Stay sharp — structure remains bullish overall, but short-term corrections are in play!
---
📲 Like, Follow & Comment
💬 Drop your thoughts below & join us for more real-time trade setups and market insights!
#Forex #GBPUSD #PriceAction #TechnicalAnalysis #ForexSignals #LiviaTrades 😜

GBPCHFAnalysis complete — scenarios outlined. The zone could be a decision point for . Price reaction here may define the next move.
If price breaks and pulls back to retest, a reversal setup might emerge.


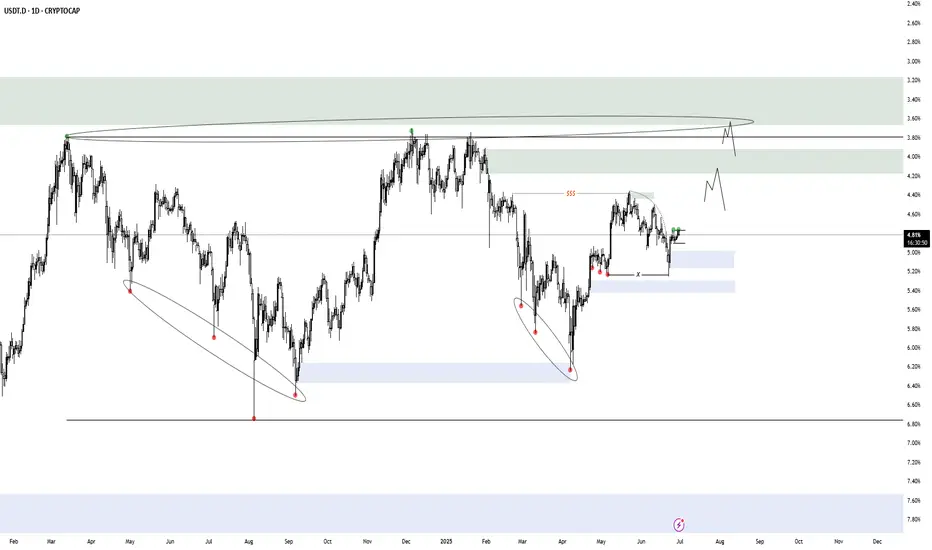
USDT.D HTF AccumulationThats the HTF accumulation model i use as confluence to the potential HTF BTC distribution. I have inverted the chart so it's easier to see. I am watching one of these 2 demand zones for either a model 1 or 2. Can't wait to see how it will play out.
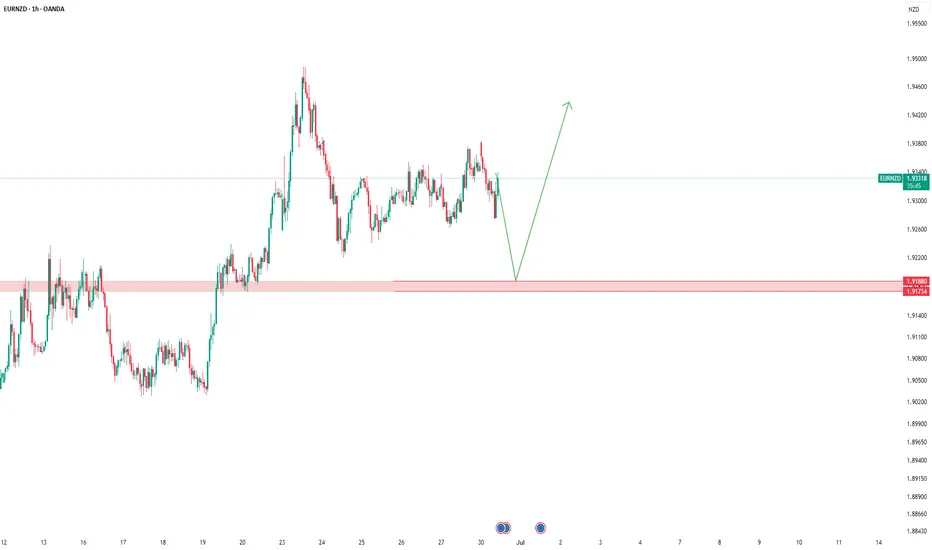
EURNZD🎯 EURNZD Setup
Waiting for price to reach our key level.
If we get a buy signal there, I’ll go long. But if the level breaks and we get a proper pullback, I’ll look to short.
No predictions — just reacting with a clear plan and risk control.
🟢 Long on reaction
🔴 Short on break & pullback
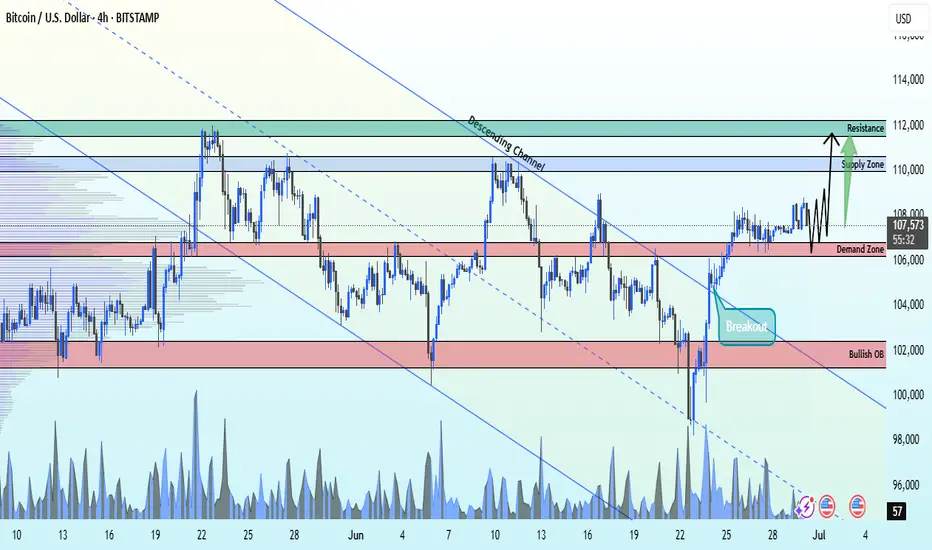
BITCOIN Breakout From Ascending Channel bullish from demand ZoneBTCUSD Breakout Alert
Bitcoin has officially broken out of the descending channel on the 4H timeframe, signaling a potential bullish reversal from the key demand zone at 106,100.
🎯 Technical Targets:
1st Target: 110,000 – Major supply zone
2nd Target: 112,000 – Strong resistance level
🔒 Stop Loss: 103,000 – Below bullish order block for risk protection
This setup offers a clean R:R with strong confluence. Watch for continuation above 108K for confirmation.
📊 TA only – always manage your risk!
🔥 Like, follow, & comment to stay ahead with more real-time updates!
#BTC #CryptoTrading #PriceAction #BitcoinAnalysis #LiviaTrades 😜
EURUSD – June 30th OutlookBias: Still bullish
Liquidity zone pullback: 1.16853 held as expected
Next move: Watching for break of Friday's high at 1.17342 → possible retest of 1.17311 → continuation upward
HRHR Setup: If price returns to 1.16853 today, it's a high risk play due to end-of-month volatility
Caution: If we break below the previous 4H candle, we could range between 1.17342 and 1.16853 for the remainder of the day.
🔹 Approach with caution — it’s the final trading day of the month.

GOLD (XAUUSD) – June 30th OutlookWeekly: Gold opens bullish while still respecting the Dec 2024 trendline, despite the last two weekly candles closing bearish.
Daily: Currently at 3295, approaching key intraday bearish structure at 3310.
Last Week’s Bounce: From 3274 delivered 220+ pips, now becoming a pivotal reaction zone.
If 3310 Breaks: Expect continuation to 3344 – a 350-pip swing.
If 3310 Rejects: Anticipate a move back to 3274 for re-evaluation.
⚠️ Note: Today is the final trading day of the month. Watch for false breakouts and potential liquidity traps.

XAUUSD SHORT SETUPExpecting a possible bearish reversal from Gold back to sweep the liquidity below.

WTI OIL TRADING IDEA 1 JULY 2025WTI Crude Oil is currently trading around $64.77, following a recent rejection from the $76–78 resistance zone. This area represents a strong supply zone and coincides with the upper boundary of a long-term descending channel, indicating institutional selling pressure. From a Smart Money Concepts (SMC) perspective, this move appears to be a liquidity grab above previous highs, where price tapped into a bearish order block before aggressively reversing. Price action confirms this bearish sentiment, with a visible rejection and bearish engulfing candle suggesting that sellers are defending the region aggressively.
On the supply and demand side, the $76.77–78.30 zone is the immediate supply zone, while the next key resistance above lies between $79.37 and $93.94. On the downside, demand lies at $58.69–64.00, with major demand and liquidity resting around $55.00 and $51.79. Fundamentally, the recent spike in oil prices was largely driven by heightened tensions in the Middle East, particularly renewed conflict concerns between Iran and Israel. However, as no direct disruption to oil supply has occurred, the geopolitical risk premium is now being priced out. Additionally, concerns over global demand, especially from China and Europe, along with a gradual and controlled U.S. Strategic Petroleum Reserve (SPR) refill, are putting downward pressure on prices despite OPEC+ maintaining output cuts.
Based on this analysis, the trade idea favors a bearish swing setup. A short position around $64.00–66.00 could be considered, targeting $58.69 as the first take-profit level, followed by $55.00 and $51.79 for extended targets. The stop loss should be placed just above $78.50 to allow room beyond the supply zone and trendline. This setup offers a risk-reward ratio of approximately 1:3. However, if price breaks and holds above $78.50, it may signal a structural shift toward bullish momentum, likely driven by unexpected geopolitical escalation or a change in OPEC strategy. In such a case, the bias should flip to bullish, with potential targets around $89.00–93.00.

NEIRO ANALYSIS (8H)From the point where we placed the red arrow on the chart, it seems that NEIRO’s correction has begun.
This correction appears to be a diagonal (diametric) pattern, and we are currently at the end of wave F.
Wave G could complete within the green zone, where we can look for a Rebuy setup.
The targets are marked on the chart.
If a daily candle closes below the invalidation level, this analysis will be invalidated.
For risk management, please don't forget stop loss and capital management
When we reach the first target, save some profit and then change the stop to entry
Comment if you have any questions
Thank You

XAUUSD AnalysisAs from the above analysed chart I can see possible reversal from the zone 3297-3310 .
So, we can dilligently hope to find our setup from the zone .
Please follow me to find out my setup .

NQ Power Range Report with FIB Ext - 6/30/2025 SessionCME_MINI:NQU2025
- PR High: 22842.50
- PR Low: 22751.50
- NZ Spread: 202.75
Key scheduled economic events:
09:45 | Chicago PMI
Weekend volatility taking auction into new ATHs
Session Open Stats (As of 12:45 AM 6/30)
- Session Open ATR: 345.85
- Volume: 33K
- Open Int: 261K
- Trend Grade: Neutral
- From BA ATH: +0.1% (Rounded)
Key Levels (Rounded - Think of these as ranges)
- Long: 23239
- Mid: 21525
- Short: 20383
Keep in mind this is not speculation or a prediction. Only a report of the Power Range with Fib extensions for target hunting. Do your DD! You determine your risk tolerance. You are fully capable of making your own decisions.
BA: Back Adjusted
BuZ/BeZ: Bull Zone / Bear Zone
NZ: Neutral Zone
