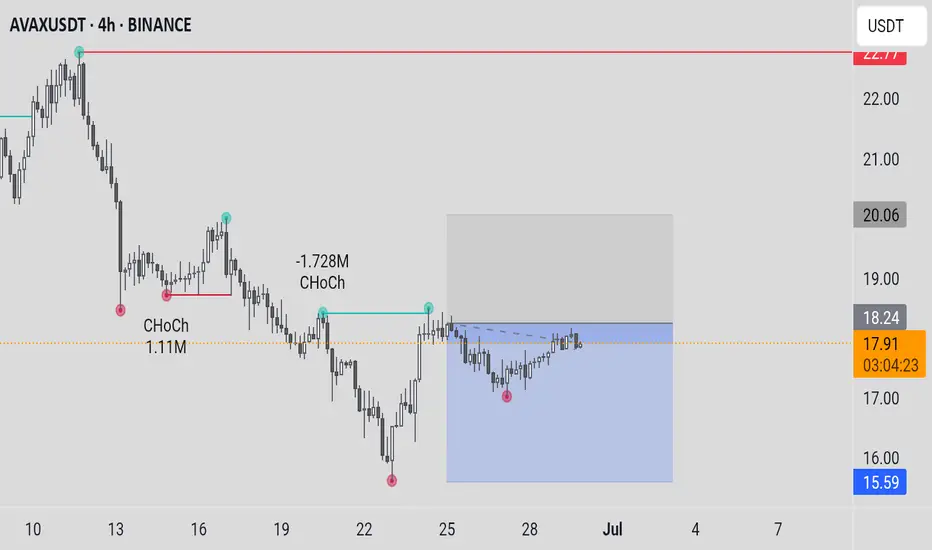
AVAXUSDTCryptocurrency Futures Market Disclaimer 🚨🚨🚨
Trading cryptocurrency futures involves high risks and is not suitable for all investors.
Cryptocurrency prices are highly volatile, which can lead to significant gains or losses in a short period.
Before engaging in crypto futures trading, consider your risk tolerance, experience, and financial situation.
Risk of Loss: You may lose more than your initial capital due to the leveraged nature of futures. You are fully responsible for any losses incurred.
Market Volatility: Crypto prices can fluctuate significantly due to factors such as market sentiment, regulations, or unforeseen events.
Leverage Risk: The use of leverage can amplify profits but also increases the risk of total loss.
Regulatory Uncertainty: Regulations related to cryptocurrencies vary by jurisdiction and may change, affecting the value or legality of trading.
Technical Risks: Platform disruptions, hacking, or technical issues may result in losses.
This information is not financial, investment, or trading advice. Consult a professional financial advisor before making decisions. We are not liable for any losses or damages arising from cryptocurrency futures trading.
Note: Ensure compliance with local regulations regarding cryptocurrency trading in your region.
thanks for like and follow @ydnldn
Supply and Demand
DYDXUSDTCryptocurrency Futures Market Disclaimer 🚨🚨🚨
Trading cryptocurrency futures involves high risks and is not suitable for all investors.
Cryptocurrency prices are highly volatile, which can lead to significant gains or losses in a short period.
Before engaging in crypto futures trading, consider your risk tolerance, experience, and financial situation.
Risk of Loss: You may lose more than your initial capital due to the leveraged nature of futures. You are fully responsible for any losses incurred.
Market Volatility: Crypto prices can fluctuate significantly due to factors such as market sentiment, regulations, or unforeseen events.
Leverage Risk: The use of leverage can amplify profits but also increases the risk of total loss.
Regulatory Uncertainty: Regulations related to cryptocurrencies vary by jurisdiction and may change, affecting the value or legality of trading.
Technical Risks: Platform disruptions, hacking, or technical issues may result in losses.
This information is not financial, investment, or trading advice. Consult a professional financial advisor before making decisions. We are not liable for any losses or damages arising from cryptocurrency futures trading.
Note: Ensure compliance with local regulations regarding cryptocurrency trading in your region.
thanks for like and follow @ydnldn

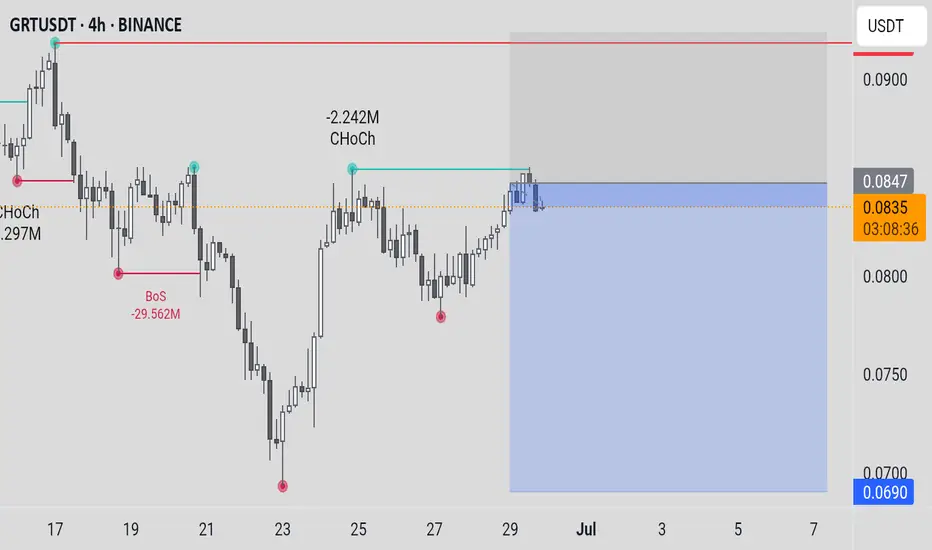
GRTUSDTCryptocurrency Futures Market Disclaimer 🚨🚨🚨
Trading cryptocurrency futures involves high risks and is not suitable for all investors.
Cryptocurrency prices are highly volatile, which can lead to significant gains or losses in a short period.
Before engaging in crypto futures trading, consider your risk tolerance, experience, and financial situation.
Risk of Loss: You may lose more than your initial capital due to the leveraged nature of futures. You are fully responsible for any losses incurred.
Market Volatility: Crypto prices can fluctuate significantly due to factors such as market sentiment, regulations, or unforeseen events.
Leverage Risk: The use of leverage can amplify profits but also increases the risk of total loss.
Regulatory Uncertainty: Regulations related to cryptocurrencies vary by jurisdiction and may change, affecting the value or legality of trading.
Technical Risks: Platform disruptions, hacking, or technical issues may result in losses.
This information is not financial, investment, or trading advice. Consult a professional financial advisor before making decisions. We are not liable for any losses or damages arising from cryptocurrency futures trading.
Note: Ensure compliance with local regulations regarding cryptocurrency trading in your region.
thanks for like and follow @ydnldn
Positioning Buy idea on Sugar (SB1!)Based on :
- Cot at extremes potential reversal
- Seasonality and quantitative analysis
- 2 Demand zones

GBPCHF Buy Trade IdeaHello Traders
In This Chart GBPCHF HOURLY Forex Forecast By FOREX PLANET
today GBPCHF analysis 👆
🟢This Chart includes_ (GBPCHF market update)
🟢What is The Next Opportunity on GBPCHF Market
🟢how to Enter to the Valid Entry With Assurance Profit
This CHART is For Trader's that Want to Improve Their Technical Analysis Skills and Their Trading By Understanding How To Analyze The Market Using Multiple Timeframes and Understanding The Bigger Picture on the Charts

Natural Gas is in the Buying DirectionHello Traders
In This Chart NATGAS HOURLY Forex Forecast By FOREX PLANET
today NATGAS analysis 👆
🟢This Chart includes_ (NATGAS market update)
🟢What is The Next Opportunity on NATGAS Market
🟢how to Enter to the Valid Entry With Assurance Profit
This CHART is For Trader's that Want to Improve Their Technical Analysis Skills and Their Trading By Understanding How To Analyze The Market Using Multiple Timeframes and Understanding The Bigger Picture on the Charts

Silver is in the Bearish trend after testing ResistanceHello Traders
In This Chart XAGUSD HOURLY Forex Forecast By FOREX PLANET
today XAGUSD analysis 👆
🟢This Chart includes_ (XAGUSD market update)
🟢What is The Next Opportunity on XAGUSD Market
🟢how to Enter to the Valid Entry With Assurance Profit
This CHART is For Trader's that Want to Improve Their Technical Analysis Skills and Their Trading By Understanding How To Analyze The Market Using Multiple Timeframes and Understanding The Bigger Picture on the Charts

NAVINFLUOR on the Verge of BreakoutNAVINFLUOR is on the Breakout level, but there is a negative RSI divergence in both DTF and WTF. Hence expecting it to Breakdown, unless heavy buying comes in and shoot RSI in overbought zone.
Stock is NC, but shared for learning purpose

EURJPYAs our followers may remember, we already secured a great profit on EURJPY.
Now, we're once again waiting for price to revisit our key level — so we can potentially catch another high-probability setup.
📌 Always remember:
The market is unpredictable.
We're not here to predict — we're here to react, using technical analysis, clear setups, proper risk and trade management.
❌ If a level breaks, we don’t panic.
✅ Instead, we patiently wait for a pullback and take advantage of the next smart entry.

EURUSD..BUYAnalysis complete — scenarios outlined. The zone could be a decision point for . Price reaction here may define the next move.
If price breaks and pulls back to retest, a reversal setup might emerge.


#GBPUSD: Bulls are in control, DXY Dropping Sharply!Hello Team,
We have identified a promising opportunity with a favourable price movement. The Pound Sterling to US Dollar (GBPUSD) pair has exhibited strong bullish volume, indicating potential further appreciation.
The current geopolitical tensions, particularly the involvement of the United States in the Iran-Israel conflict, are expected to negatively impact the US Dollar. This decline could potentially lead to an appreciation of the GBPUSD pair and other USD-denominated currencies.
It is advisable to closely monitor the price behaviour of the GBPUSD pair and consider potential investment opportunities based on its current trend.
Best regards,
Team Setupsfx

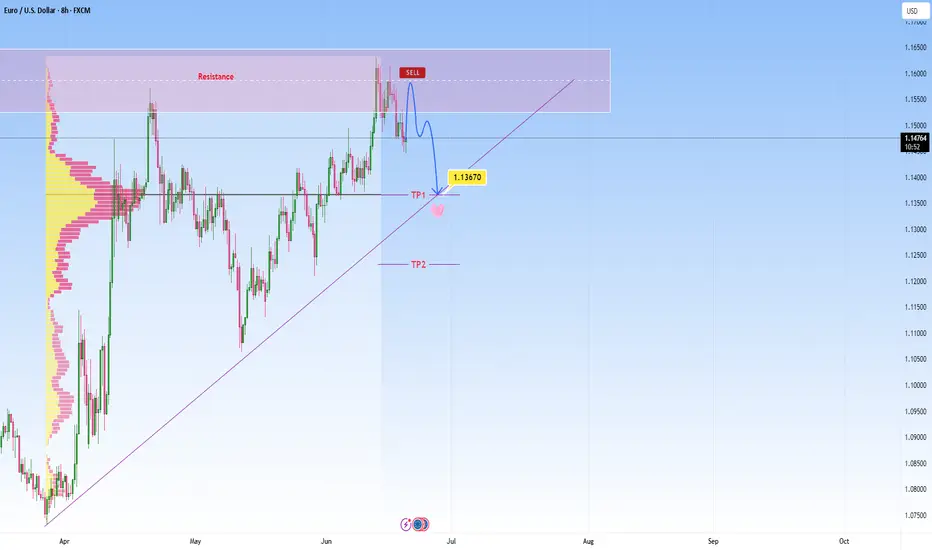
EURUSD heads towards resistance, short-term reversal expectedEURUSD has been in a strong uptrend, and we’re currently observing price action is reaching a notable resistance zone. I am watching for a reversal here as marked on my chart, not expecting a major move, but rather a short-term rejection with a downside target at around 1.13670 , which also aligns with the POC.
This is where it can become a decision point, either price finds support and bounces, or it breaks below, and that’s when we might see the move start to extend lower.
If we get a decisive breakdown through that ascending trendline, my next area of interest is marked as TP2. From there we can expect either potential accumulation or another reaction, depending on broader market sentiment at the time.
That said, we're navigating a complex backdrop currently:
The EU macro environment is under pressure, as weak economic data from Europe is contributing to cautious sentiment around the euro.
Meanwhile, a sustained USD bid continues, supported by stronger U.S. growth expectations, favorable yields, and persistent global demand. This further weighs on EURUSD.
Adding to the uncertainty, escalating tensions between Israel and Iran have rattled markets this week. This geopolitical risk could be pushing oil prices higher:
It’s important to note that if price convincingly rejects here and loses structure, especially with high volume and obvious bullish structure, this setup would become invalid. In that case, I would reassess and adapt
CRV ANALYSIS (1D)The smaller structure of CRV is bearish. It is expected to reject downward from the red zone, with our rebuy zone being the green area.
Given that the internal structure is bearish, it is ultimately expected to reach the green zone.
Closing a daily candle below the invalidation level will invalidate this analysis.
For risk management, please don't forget stop loss and capital management
When we reach the first target, save some profit and then change the stop to entry
Comment if you have any questions
Thank You
TON New Update (1D)This analysis is an update of the analysis you see in the "Related publications" section
Since we started publishing a series of bearish analyses on TON, the coin has experienced a significant drop | despite the ongoing growth of the Telegram app and its expanding user base.
Before reaching the support zone mentioned in our previous analysis, a strong intermediate demand zone is visible along the way, located just below a notable liquidity pool. A solid bullish reaction is expected from this identified demand area.
Targets are clearly marked on the chart.
A daily candle close below the invalidation level will invalidate this analysis.
For risk management, please don't forget stop loss and capital management
When we reach the first target, save some profit and then change the stop to entry
Comment if you have any questions
Thank You

Silver has follow the bullish trend buying possible from support📈 Silver Alert – Bullish Momentum Building! 🚀
Silver is showing strong bullish movement after bouncing off key support at 34.9000 on the 4H timeframe.
🎯 Technical Targets:
1st Target: 36.6000 – Approaching key supply zone
2nd Target: 37.5000 – Major resistance level to watch
The trend looks solid with momentum picking up — bulls are in control for now!
💬 Like, follow, comment & join us for more real-time updates and expert insights.
Stay ahead of the market with Livia 😜
#Silver #XAGUSD #TechnicalAnalysis #TradingSignals #BullishTrend #PriceAction

XTIUSD Breakdown from ascending channel now buy from supportXTIUSD Technical Update – 1H Timeframe 🚨
Crude Oil (XTIUSD) has broken down from the ascending channel, but is now showing a strong bullish reaction from the key demand zone at 65.10.
📈 Upside Targets:
🔹 1st Target: 70.00 – Local supply zone
🔹 2nd Target: 74.00 – Key supply zone
🔹 3rd Target: 77.00 – Bearish order block
The momentum is shifting – bulls are stepping in! Watch for confirmations on lower timeframes and manage risk accordingly. 🔍
✅ Like
✅ Follow
✅ Comment
💬 Join us for more real-time updates and analysis!
— With 💖,
Livia 😜

EURUSD: Support & Resistance Analysis for Next Week 🇪🇺🇺🇸
Here is my latest structure analysis
and important supports & resistances for EURUSD for next week.
Consider these structures for pullback/breakout trading.
❤️Please, support my work with like, thank you!❤️
I am part of Trade Nation's Influencer program and receive a monthly fee for using their TradingView charts in my analysis.

GBPJPY Major Resistance Breakout Ahead📈 GBP/JPY Technical Analysis – 4H Time Frame 🔍
GBPJPY has maintained its ascending structure and recently broke above the previous supply zone at 196.900, signaling bullish strength.
🎯 Entry Idea:
Watch for a retracement to the 196.900 zone — now turned potential demand — for a possible long entry.
📌 Technical Targets:
1st Target: 198.600 (key resistance)
2nd Target: 200.000 (psychological resistance level)
The breakout confirms bullish momentum — a clean retest could offer a solid risk-to-reward setup.
💬 Like, follow, and drop your thoughts in the comments!
📢 Join us for more real-time updates and smart trade setups.
— With love,
Livia 😜✨

BTCUSD Descending channel breakout bullish possible from SupportBTCUSD Breakout Alert!
1H Timeframe Analysis
Bitcoin has broken out of the descending channel with a strong bullish candle — signaling a potential reversal from the key demand zone around 103,600.
📈 Technical Targets:
🔹 First Target: 108,000
🔹 Second Target: 110,000
This breakout could offer a solid long opportunity, but as always — manage risk wisely! ✅
💬 What’s your bias?
❤️ Like | 🔁 Share | 💭 Comment
📲 Join us for more real-time updates and insights!
#BTC #Bitcoin #CryptoTrading #TechnicalAnalysis #Breakout #BullishMomentum

XAUUSD Has Ascending channel breakdown selling strong now🔔 XAUUSD Update – 4H Breakdown Alert!
Gold (XAUUSD) has officially broken down from the ascending channel, signaling strong bearish momentum starting from 3322.
📉 Technical Targets Ahead: 1️⃣ 3280 – First demand zone
2️⃣ 3240 – Next key demand zone
3️⃣ 3160 – Major support level
We're seeing solid selling pressure, and the 4H timeframe confirms the structure shift. Keep an eye on price action around these zones for potential reaction or continuation.
💬 Drop your thoughts in the comments!
👍 Like | 🔁 Share | ✅ Follow for live insights and real-time market updates.
Join the team for more smart trades & updates 💼
— Livia 😜

GBPUSD Selling From Bearish Order Block At 1.36200GBPUSD Technical Breakdown
Timeframe: 1H
Price has officially broken out of the descending channel and is now reacting from the bearish Order Block around 1.36200. We're looking for short opportunities as momentum shifts.
🎯 Bearish Targets:
🔻 1st Target: 1.35500 – Key Demand Zone
🔻 2nd Target: 1.34700 – Deeper Demand Zone
🔻 3rd Target: 1.34000 – Bullish Order Block
📉 Setup looks clean – watching PA confirmation on each level.
👇 Like, follow, comment, and join us for more updates & smart trade setups.
Trade smart. Trade safe. 💼✨
— Livia 😜

EURUSD Selling From bearish ob at 1.16100 strong sell📉 EURUSD Analysis – 4H Timeframe 📉
The pair is currently respecting an ascending channel, but we’re eyeing a potential reversal from the bearish Order Block (OB) around 1.16100 – a prime sell zone.
🎯 Technical Targets:
1st Target: 1.14500 – Demand Zone
2nd Target: 1.13000 – Demand Zone
3rd Target: 1.11000 – Key Support Level
This setup offers clean risk-reward with price action confirming supply pressure at the top.
🚨 Watch for confirmations before entering – smart entries win the game.
💬 Like, follow, comment your thoughts, and join the team for more real-time updates and insights!
With love,
Livia 😜💹
