ETHUSDT minor trendsEthereum BINANCE:ETHUSDT is downtrend with lower highs from the bottom is nearly finished 📉 . For a stronger rise, it needs to stabilize above $2500 ⚡. Mid-term targets are $3300 (end of second leg) and $3700 (major resistance) 🎯. Key supports are $2500, $2070, $1800, and $1550, the base where the uptrend began 🛡️.
Supports & Resistances:
Supports: \$2500, \$2070, \$1800, \$1550
Resistances: \$2500 (critical level), \$3300, \$3700
Supply and Demand

GBPCAD FORMING BEARISH FLAG PATTERNGBPCAD Bearish Trend Analysis (1-Hour Time Frame)
The GBPCAD pair is currently exhibiting a bearish trend on the 1-hour chart, with the market forming lower lows, confirming a sustained downward momentum. This price action indicates that sellers are in control, and the bearish sentiment is likely to continue in the upcoming trading sessions.
Bearish Flag Pattern Signals Further Decline
The price is forming a bearish flag pattern, a continuation pattern that often leads to further downside movement. This pattern suggests that after a brief consolidation, the pair may resume its downward trajectory. Traders should watch for a breakdown below the flag’s support, which could accelerate the decline.
Key Support and Resistance Levels
- Downside Targets: If the bearish momentum continues, the pair could test 1.84500, followed by 1.83200. These levels may act as potential take-profit zones for short positions.
- Upside Resistance: On the higher side, 1.87700 remains a critical resistance level. A break above this level could temporarily halt the bearish trend, but as long as the price stays below it, the downtrend remains intact.
Trading Strategy
- Short positions could be considered near resistance levels, with stop-loss orders placed above 1.87700 to manage risk.
- A confirmed breakdown below the bearish flag may present additional selling opportunities.
- Traders should monitor price action around support levels (1.84500 & 1.83200) for potential pullbacks or continuation signals.
Conclusion
With the lower lows formation and the bearish flag pattern, GBPCAD is expected to remain under selling pressure. Traders should watch for breakdowns below key support levels while keeping an eye on resistance at 1.87700 for any trend reversal signals.

DMC Buy/Long Setup (4H)After a time-consuming bullish move in a compressed structure, the price is now approaching a key support origin.
Buy/long positions can be considered around the green zone.
Targets are marked on the chart.
A daily candle closing below the invalidation level will invalidate this analysis.
For risk management, please don't forget stop loss and capital management
When we reach the first target, save some profit and then change the stop to entry
Comment if you have any questions
Thank You

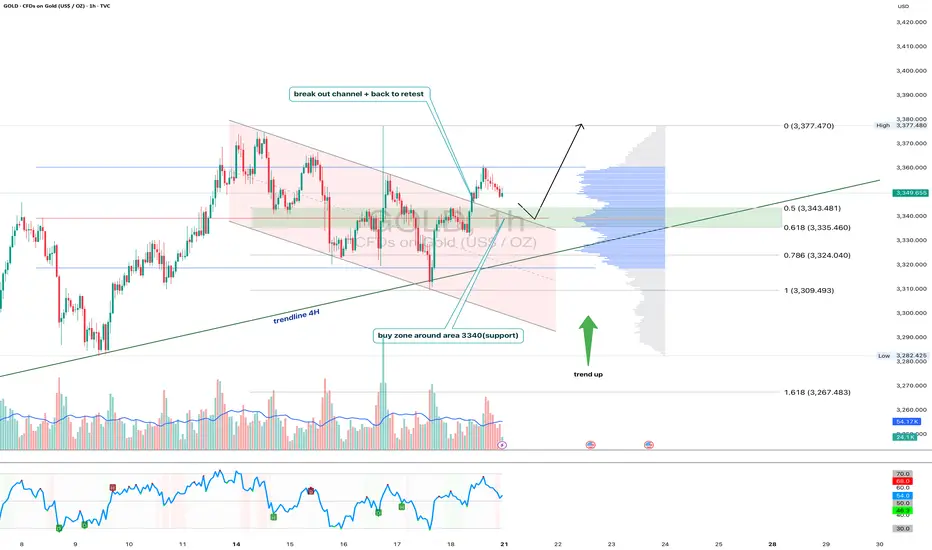
Gold 1H - Retest of channel & support zone at 3340After breaking out of the falling channel, gold is currently retesting its upper boundary — now acting as support. The 3340 zone is particularly important as it aligns with the 0.618 Fibonacci level and high volume node on the visible range volume profile. The price action suggests a potential bullish rejection from this area. With both the 50 and 200 EMA below price on the 1H, the short-term trend remains bullish. The 4H trendline further supports this setup. RSI is cooling off near the neutral zone, leaving room for another leg higher toward the 3377 resistance zone. If 3340 fails, 3324 (0.786 Fibo) becomes the next line of defense. Until then, the structure remains bullish following the successful breakout and retest of the channel.
XAUUSD ANALYSISWe are waiting for the price to come to our zone demand where we look for buy UpTo the level of supply zone where we look for sell entry .
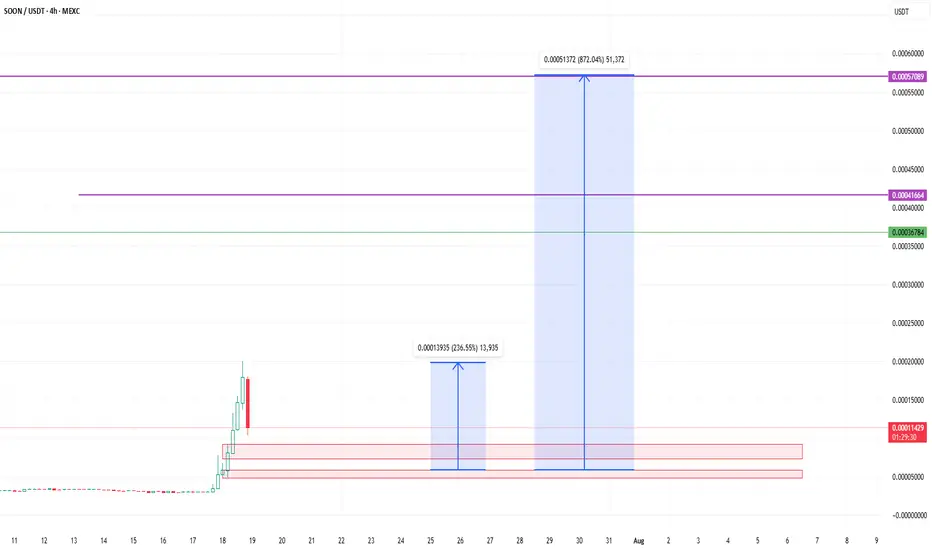
MR SOON GO TO THE MOON with huge commiunity and holder MR soon token is the Best meme for buy noow and a few wait foor a BIG pump so just buy and wait for pump and dont wory be happpy !
MR SOON GO TO THE MOON with huge commiunity and holder
now i am waiting for a very very very BIG PUMP my freind
The range that will be touched in CAD/JPY It endedI provided you with this analysis that I had high confidence in.
I hope you have used this approximately 6% profit.

GBPAUD a bullish momentum in 1hr TFsweep happen at 2.04438
consider the price is at the bottom area in the range of D (larger TF)
if the price at 2.05599 level (0.618) appear consolidation would be perfect
need a breakout of consolidation in small TF
long entry in smaller TF

$NQ Supply and Demand Zones 7/18/25 This is for SEED_ALEXDRAYM_SHORTINTEREST2:NQ chart only, not as many supply zones with the limited timeframes I can use for TradingView free plan. This is my chart coming into next week.
However, we have so far found rejection from new ATH and making our way to retest the imbalances and previous resistance-now support levels of past supply zones.
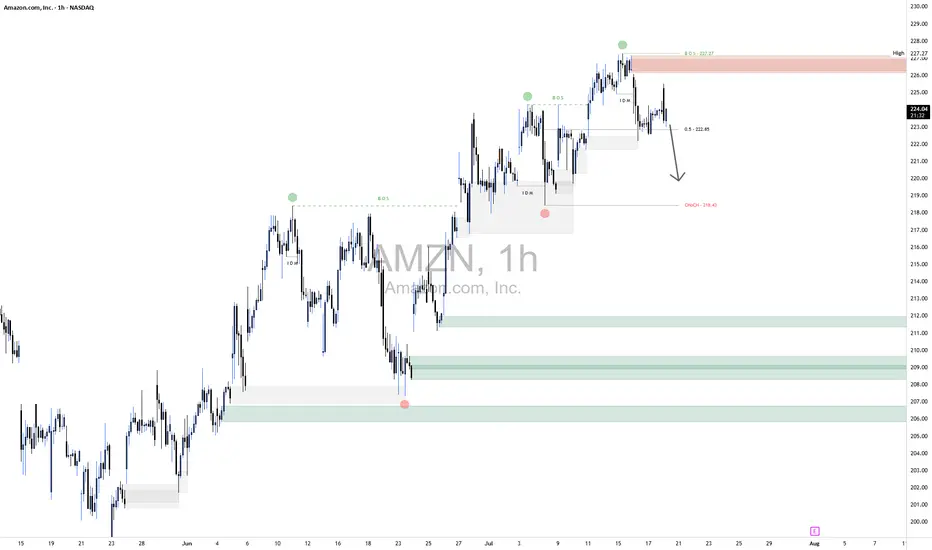
AMZN Short1.Liquidity Landscape
Buy-Side Liquidity Cleared:
Liquidity above the recent swing high was taken — likely triggering breakout traders and stop orders from earlier shorts.
This move appears to be a classic liquidity raid before a reversal.
Sell-Side Liquidity in Focus:
Price is now targeting sell-side liquidity resting below recent higher lows (e.g., below ~222 and especially near 218.50).
This aligns with the direction of your arrow, suggesting price may hunt liquidity pools beneath internal lows.
2. Confirmation via Reaction
The strong rejection from that supply zone confirms no intent to hold price above 227, meaning that was likely a liquidity raid, not a genuine breakout.
Price has already broken below the midpoint (0.5 level at 222.85), adding confidence to the short bias.
3. Liquidity Targets Below
The next likely targets are sell-side liquidity pools resting below:
Around 218.50 (marked zone)
Deeper lows near 211–212, and potentially 208–209, where untouched demand and previous stop clusters lie.
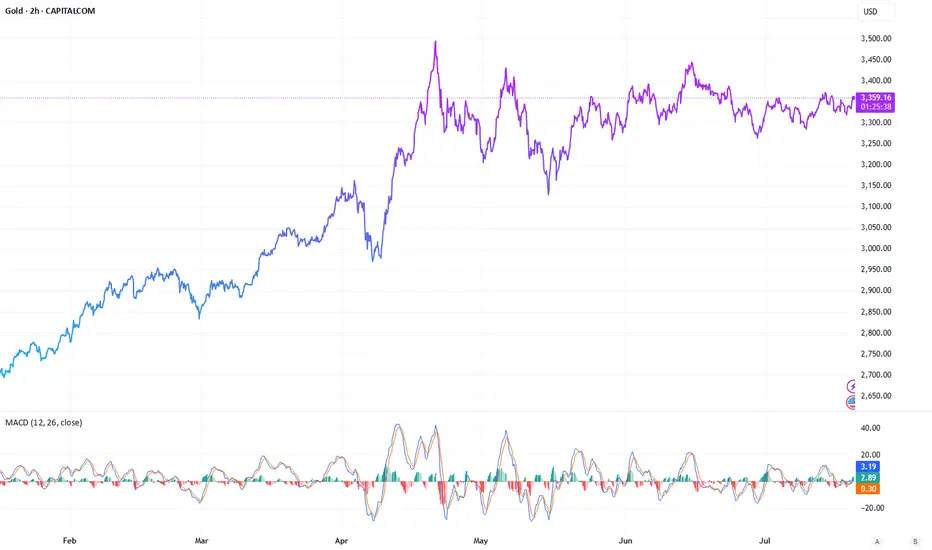
Gold’s Q2 Surge: What’s Next for the Safe Haven?The Q 2 Rally: A Response to Global Uncertainty
Gold prices hit new heights in the second quarter of year, breaching the $3,500 per ounce mark for the first time amid a wave of global instability. After climbing steadily from $2,658.04 on January 2 to $3,138.24 by April 2, the precious metal faced a brief dip below $3,000 in early April. However, it quickly rebounded, peaking at $3,434.40 on April 21 and briefly touching $3,500 during trading. By June 30, it closed at $3,303.30 showing a volatile yet upward trend driven by tariff threats, geopolitical tensions, and a shaky financial landscape.
Key Drivers Behind the Scene
The surge was sparked by U.S. tariff policies, with broad import fees announced on April 2 causing a global market panic. Investors, wary of rising 10-year bond yields as major holders sold U.S. treasuries, flocked to gold as a safer alternative. A temporary pause in tariff plans eased some pressure, but uncertainty lingered, keeping prices elevated. Geopolitical flare-ups, including Israel’s June 12 attacks on Iranian nuclear sites and ongoing regional conflicts, further bolstered demand. Central banks added to the momentum, purchasing 244 metric tons in Q1 (24% above the five-year average) and 20 metric tons in May, while retail and ETF inflows-$21 billion in North America, $6 billion in Europe, and $11 billion in Asia for the first half-signaled growing interest.
Persistent Risks and Opportunities
Experts predict that the factors fueling gold’s rise won’t fade soon. Tariff deadlines, now extended to August 1 after a July 9 reprieve, could trigger another rally if tensions escalate. I feel existing tariffs could gradually lift prices, potentially prompting the Federal Reserve to delay rate cuts, which would further boost gold demand, especially among central banks. A weaker U.S. dollar-down 11% year-to-date-also enhances gold’s appeal for international buyers, a trend, I think, will persist.
Geopolitical hotspots, including Middle East tensions and ongoing global conflicts, add to the uncertainty. Prolonged shock period, rather than the typical summer lull, suggests gold could remain a go-to safe haven. Higher inflation expectations and a fragile dollar outlook only strengthen its case.
Couple Last Words
Gold’s second quarter performance keeps holding tight its role as a hedge against uncertainty. With prices holding above $3,300 and potential catalysts like tariffs and geopolitics on the horizon, it’s a compelling option for diversification. Watch for the August 1 tariff update-it could be a key inflection point.
GOLD! Pre-Market Analysis For Friday July 18th!In this video, we'll present pre-market analysis and best setups for Friday July 18th.
Enjoy!
May profits be upon you.
Leave any questions or comments in the comment section.
I appreciate any feedback from my viewers!
Like and/or subscribe if you want more accurate analysis.
Thank you so much!
Disclaimer:
I do not provide personal investment advice and I am not a qualified licensed investment advisor.
All information found here, including any ideas, opinions, views, predictions, forecasts, commentaries, suggestions, expressed or implied herein, are for informational, entertainment or educational purposes only and should not be construed as personal investment advice. While the information provided is believed to be accurate, it may include errors or inaccuracies.
I will not and cannot be held liable for any actions you take as a result of anything you read here.
Conduct your own due diligence, or consult a licensed financial advisor or broker before making any and all investment decisions. Any investments, trades, speculations, or decisions made on the basis of any information found on this channel, expressed or implied herein, are committed at your own risk, financial or otherwise.

Binance Coin (BNB) to $780? Chart Says 5.8% Rally Incoming!BNBUSDT is currently showcasing a clear bullish structure, supported by consistent demand and a strong breakout beyond previous resistance zones. The price action has steadily evolved into higher highs and higher lows since July 10, confirming bullish market control.
After consolidating around the 707–710 USDT range, the pair decisively broke out, flipping this level into support. The price is now hovering near 736.50 USDT, holding its gains despite brief intraday corrections.
The ascending pattern that started from mid-July saw a short-term dip toward 675 USDT, but strong buying interest quickly stepped in. This bounce marked the formation of a new swing low, followed by a powerful rally above the previous resistance.
The recent long-bodied bullish candles reflect strong momentum and possible accumulation by larger players. Buy and sell signals shown on the chart further validate the demand zone around 674–691 USDT, where bulls aggressively defended support.
The breakout structure is now entering a price discovery phase, with room for a measured move toward the upper resistance near 780 USDT, which is both a psychological round number and the projected Fibonacci extension zone.
________________________________________
📍 Trading Setup (Based on Chart)
• Entry Price: 736.50 USDT (current market price)
• Stop-Loss: 725.00 USDT (just below the recent structure low and horizontal support)
• Take-Profit: 780.22 USDT (Fibonacci target + psychological resistance)
• Risk: 11.78 USDT (~1.60%)
• Reward: 42.94 USDT (~5.82%)
• Risk-Reward Ratio: ~3.65 — favorable for swing-long positions
________________________________________
🧭 Key Zones to Watch
The support zone between 707.54 and 691.35 USDT is now the major demand base. As long as BNBUSDT holds above this area, the bullish thesis remains intact. A retest of this level followed by a bounce would further strengthen the ongoing uptrend.
Immediate resistance is at 737.28 USDT, but the market is attempting to flip this level. If it holds as support on the next retest, upside continuation to 780.22 USDT becomes highly probable.
If bulls fail to defend the 725 USDT level, we could see a deeper retracement toward 707 or 691 USDT, but currently that risk remains low given the strength of the latest breakout.

TSLA: Don't Sleep on the PullbackTesla’s bullish momentum is still in control – the weekly chart shows we’re still in an uptrend, and the trend is still our best friend. After a strong bounce from support a couple weeks ago, price is now rejecting off a weak resistance zone. Ideally, this pulls it back into my entry zone to retest the bottom or the 50% mark of the current swing. I’m using trend lines for guidance and expecting the next swing to push up into that confluence area. My golden zone is set between $367–$390, with partial profits be taken at $367 (top of the channel) and the rest near $390, where we meet the trend line. Stop loss is placed at $241, just below the level where momentum would likely shift.

AAPL Short Term Highs IncomingAAPL 1D
Apple looks good from here.
Target 1 @ 214.30
Target 2 @ anywhere from 218 to buyside liquidity
Retest of the former high then a pullback to fair value region is possible before continuation to the next short term high.

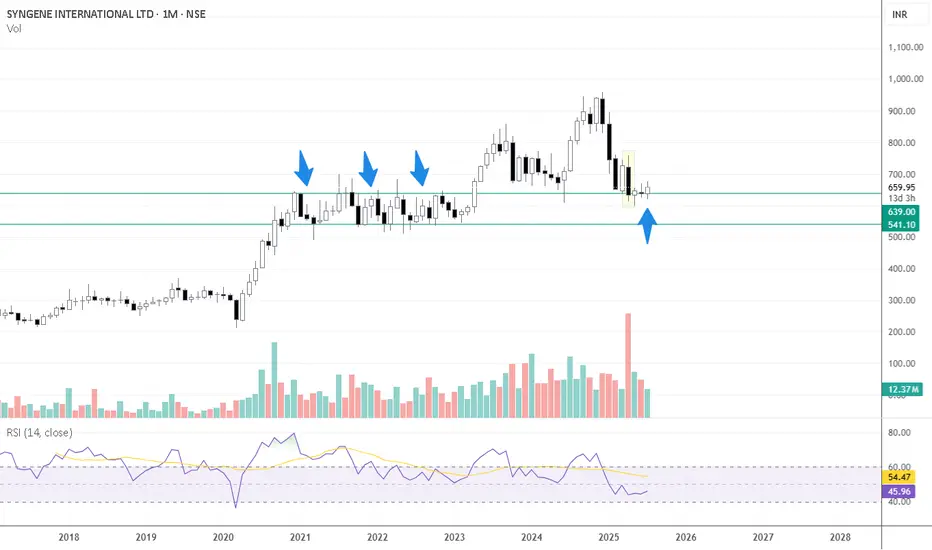
SYNGENE INTERNATIONAL LTD at Old Peaks Key Support 📈 Monthly Chart – Key Support at Old Peaks
The stock has recently revisited the ₹600–₹610 range, which corresponds to a previous consolidation and monthly swing-low zone (~₹607) from November 2020 to April 2023 on the monthly timeframe
This zone isn’t just another support level—it represents an area where price historically spent over 2.5 years, making multiple tests before breaking higher. Such zones often act as strong demand zones when revisited
A sustained hold above ₹607 would reinforce this support, signaling a potential base for a multi-month reversal or bounce
🕯️ April Monthly Candle – Selling Exhaustion?
Large bearish candle in April (FY25 Q4 results month).
High volume, which often signals capitulation or Selling climax.
Price has since stayed within the range of this candle-no breakout above or below.
Indicates a potential exhaustion of sellers if the stock holds above the low of that candle, this structure often represents a volatility compression after a sharp move-like a spring coiling.
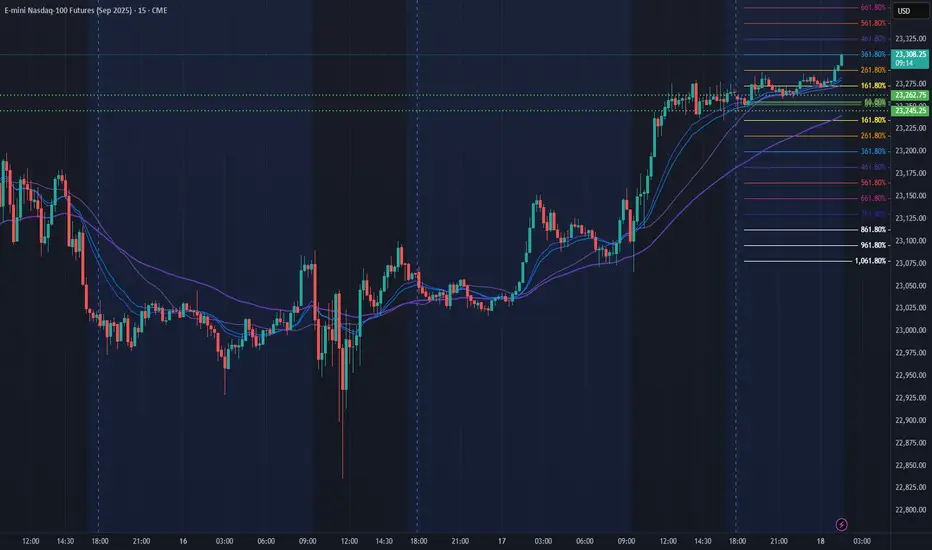
NQ Power Range Report with FIB Ext - 7/18/2025 SessionCME_MINI:NQU2025
- PR High: 23262.75
- PR Low: 23245.25
- NZ Spread: 39.0
No key scheduled economic events
Pushing ATH through overnight hours
Session Open Stats (As of 1:15 AM 7/18)
- Session Open ATR: 272.56
- Volume: 18K
- Open Int: 286K
- Trend Grade: Neutral
- From BA ATH: -0.0% (Rounded)
Key Levels (Rounded - Think of these as ranges)
- Long: 23811
- Mid: 22096
- Short: 20383
Keep in mind this is not speculation or a prediction. Only a report of the Power Range with Fib extensions for target hunting. Do your DD! You determine your risk tolerance. You are fully capable of making your own decisions.
BA: Back Adjusted
BuZ/BeZ: Bull Zone / Bear Zone
NZ: Neutral Zone
META Short📈 Scenario Outlook:
Bias: Bearish
Primary Expectation: Price is currently in a corrective decline and is expected to continue toward the 676.67 CHoCH level.
Bearish confirmation was seen upon rejection from the 713.20 mid-level, with price now printing lower highs and lower lows on the 4H chart.
This move may ultimately form a larger distribution pattern on the daily timeframe.
📌 Key Zones ("Your Borders"):
🔴 Mid-Supply Rejection Zone (Resistance)
Level: ~713.20 (50% equilibrium of last bearish swing)
This level acted as the midpoint during the retracement following the initial selloff from the top.
The market respected this region as a mid-range rejection, further reinforcing bearish momentum.
Failure to reclaim this level confirms bearish dominance in the short-to-medium term.
⚪ Target Zone / CHoCH Demand Test
Zone: 676.67 (CHoCH)
This is your projected draw on liquidity and primary downside target. It marks a structurally significant low where prior bullish order flow initiated.
If this level fails to hold, META may shift into a broader corrective phase, potentially unwinding a large portion of the prior rally.

Ethereum (ETH) – Strategic Trade PlanEthereum (ETH) continues to show resilience, currently trading around $1,790 after a strong bounce earlier this month. While the crypto market remains volatile, ETH is holding key technical levels that could fuel a major move in the coming weeks.
🎯 Entry Points:
Market Price: $1,790 — Ideal for an early position, as ETH holds above critical support zones.
$1,645 — Secondary strong support, aligning with the 20-day EMA; great for scaling in if market pulls back.
$1,400 — Deep value zone, offering a high-risk/high-reward setup if broader market correction occurs.
💰 Profit Targets:
$2,500 — First major resistance. A realistic mid-term target if bullish momentum sustains.
$3,000 — Psychological milestone and breakout confirmation level.
$3,800+ — Ambitious but achievable with broader crypto market recovery and strong ETH network metrics.
🛡️ Risk Management:
Set stop-losses dynamically below each entry support level.
Scale into positions progressively to manage volatility.
Monitor macroeconomic trends and Bitcoin's influence closely.
🔍 Key Observations:
Strong on-chain activity supports a bullish thesis.
Current resistance around $1,812 must be broken to confirm bullish continuation.
Be cautious of sudden market-wide corrections — always plan your exits and manage your risk accordingly.
📢 Disclaimer: This is not financial advice. Trading cryptocurrencies involves significant risk, and you should only invest what you can afford to lose. Always perform your own research before entering any position.

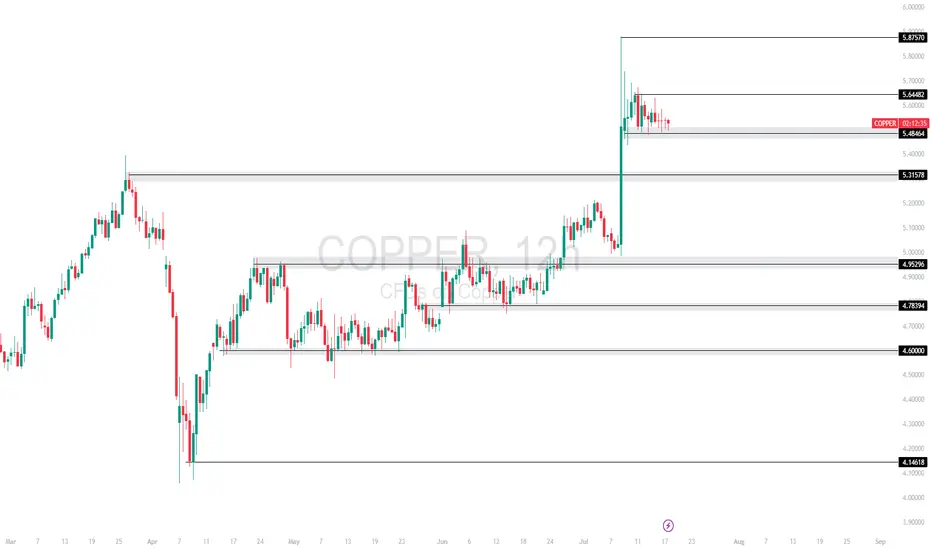
COPPER TECHNICAL ANALYSISCopper spiked into 5.8750 but is now consolidating just below short-term resistance at 5.6448, showing signs of a bullish continuation pattern. Price remains supported at the 5.4864 zone.
Currently trading at 5.4864, with
Support at: 5.4864 / 5.3157 / 4.9929 🔽
Resistance at: 5.6448 / 5.8750 🔼
🔎 Bias:
🔼 Bullish: Break above 5.6448 could push price toward 5.8750 and beyond.
🔽 Bearish: Loss of 5.4864 may trigger downside toward 5.3157.
📛 Disclaimer: This is not financial advice. Trade at your own risk.
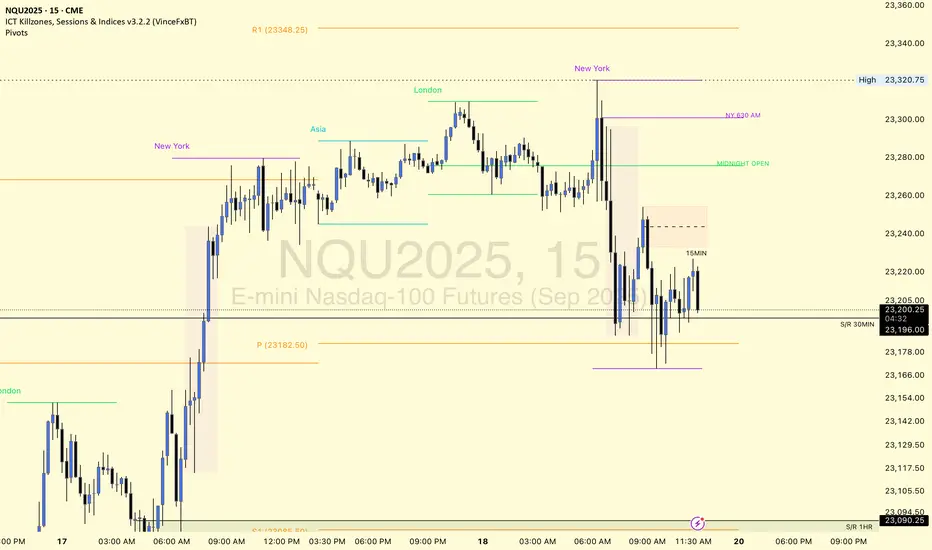
$NQ Supply and Demand Zones - All Time High! 7/17/25This chart is for SEED_ALEXDRAYM_SHORTINTEREST2:NQ only.
We recently hit ATH this AM session and now price is accumulating and we are waiting to see what it wants to do next. Continue to hold support at ATH before we breakout higher, or break below and close below ATH support for a retest lower?

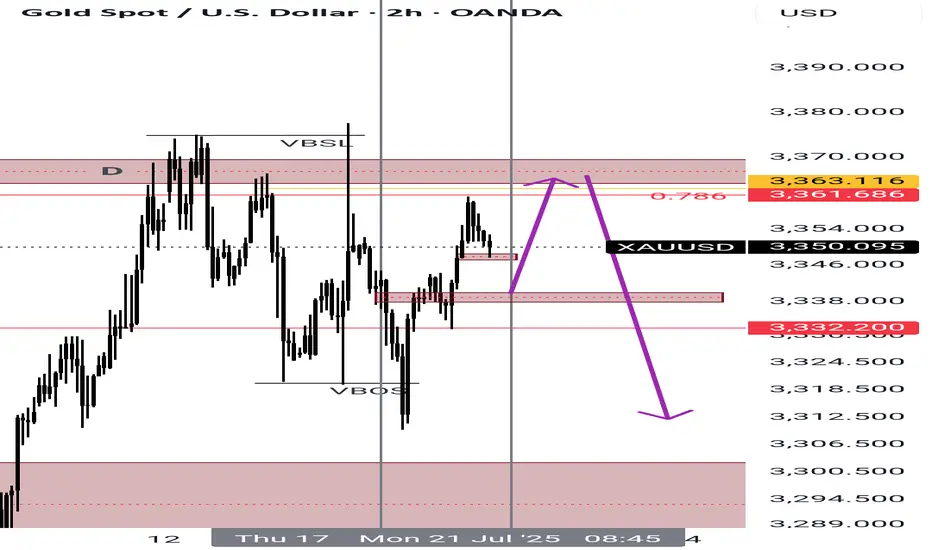
Re-attempt to buy?Trade Journal Entry – XAUUSD (Gold Spot)
Date: July 17, 2025
Platform: TradingView (Demo Account)
Timeframe: 1H/4H
Direction: Long Bias
Status: Stopped Out – Awaiting New Setup
Result of Last Trade: +£33
New Plan: Wait for buy opportunity in Asian or London session
Previous Trade Outcome
Entry was valid at POI based on bullish setup logic.
Trade failed to break structure to the upside convincingly.
Stop-out occurred after price pushed below mitigation zone (~3,316).
However, due to early partials and trade management, the result was a net profit of £33.
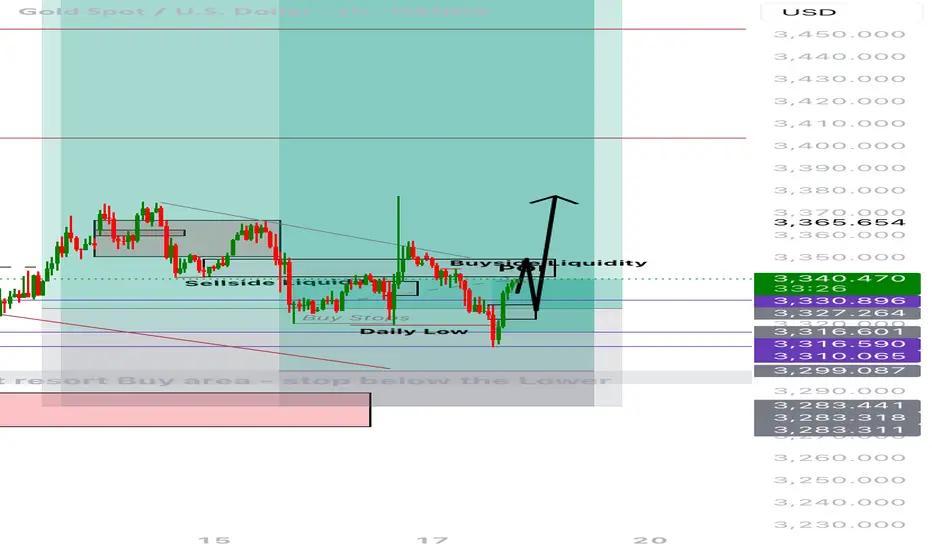
Updated Outlook
Price has rebounded aggressively from just below Daily Low.
Current price near 3,339.305 — strong push back into prior structure.
Buyside liquidity and POI overhead acting as short-term magnet.
Ideal pathing (marked with black arrows):
→ Sweep POI
→ Retest structure (likely near 3,327–3,330)
→ Continuation toward 3,365+, targeting liquidity void above.
Entry Plan
Await price to revisit POI, potentially after liquidity run.
Ideal confirmation setup:
- SFP or bullish engulfing on M15–H1
- Volume divergence or re-accumulation pattern
Target entry during Asian or early London session when liquidity is typically engineered.
Management Approach
- Keep risk tight on re-entry (0.5% max risk)
- SL below new HL formed during retest
- TP: 3,365 / extended 3,380–3,390 depending on session follow-through
- If no clean retest, skip trade — don’t chase
Emotional Reflection
Felt more in control than previous attempts. Took the stop like a professional.
No revenge trades — staying focused on structure and quality.
Grateful that proper risk management led to a small win despite being stopped out.
Reflection Questions
- Did I adjust my expectations quickly once structure failed?
- Am I giving the market enough space and time to form clean entries?
- Will I stay patient for session-specific setups?
GBPCAD – Key Level, Buy Setup & Dual StrategyRight now, price is sitting on a major level.
📌 If a valid buy signal shows up, I’ll enter a long position.
But that’s not all…
🔁 If price reaches the next resistance level, I’ll:
Hold my long position
Open a short position there
This way: ✅ If price reverses → my long trade is closed by trailing stop
✅ And my short trade runs into profit
→ I profit both from below and above
⚠️ If my short trade’s SL hits, no worries —
My long is still open and growing in profit.
📈 But if the resistance breaks and we get a pullback,
➡️ I’ll activate pyramiding and build more position with zero added risk.
