USDJPY Ascending channel breakdown ahead selling strong📉 USDJPY Breaks Down!
Strong sell-off from the key supply zone at 145.500 – the ascending channel has been broken on the 1H timeframe, signaling momentum shift.
🎯 Technical Targets:
🔹 1st Target: 144.000 – key demand zone
🔹 2nd Target: 143.000 – strong support level
Bearish pressure is building — price action confirms the shift. Eyes on lower zones as sellers take control. 📊
🔔 Like, Follow, and Comment your thoughts!
💬 Join us for more timely market updates and clean setups!
#USDJPY #ForexAnalysis #TechnicalTrading #PriceAction #FXSetup #LiviaTrades 😜
Supply and Demand

Last week of June EU outlookWeekly forecast for EU. We have seen a very bullish June so far. We approached a weekly POI before starting to consolidate.
We are now entering the last week of the month where the monthly candle's upper wick needs to be formed.
In this video I have identified a potential area where we could see the pullback take place.

XOM daily setup to $117XOM gave us a 50% retracement on the daily (I use 24 hour chart since it includes after hours), swept a key level, and bouncing off bullish FVG.
We break and hold $110.94 and we're in business.
Targeting $117.05. I have July 18 $110 calls.

US30 looking for the short on Bearish PAI believe we can expect a pull back down to JuBias: Short-term Bearish (Contingent Setup)
Context: Price is currently trading just below a high-probability supply zone between 44,048 – 44,277. This area aligns with prior highs and liquidity, making it a prime zone to look for a short-term rejection if strong bearish price action (PA) appears on the 4H or Daily timeframes.
We are currently seeing strong bullish momentum on the Weekly, Daily, and H4 candles. Any short positions from this zone must be reactive — not anticipatory. A clear bearish signal (e.g., engulfing, structure break, supply confirmation) is required to consider entry.
Key Zone:
Seek bearish PA between 44,048 – 44,277
Contingency: If price breaks and closes above 44,250 (2024 highs), expect continuation toward 45,000
Short Targets if Rejection Occurs:
Target 1: 43,350
Target 2: 42,500
Extended Target: 41,734 (June Low)
Post-Rejection Bullish Scenario:
If we do get a rejection and targets are met, we will then look for bullish PA in the demand zones (42,500 or 41,700) to consider long setups back toward the 2024 highs and potentially beyond.
Breakout Scenario:
If price breaks and closes above the 44,277 zone early this week, we anticipate the next leg to 45,000 before any meaningful reversal.
At this stage, it’s a waiting game — let price action lead. We don’t predict, we react.ne lows before an

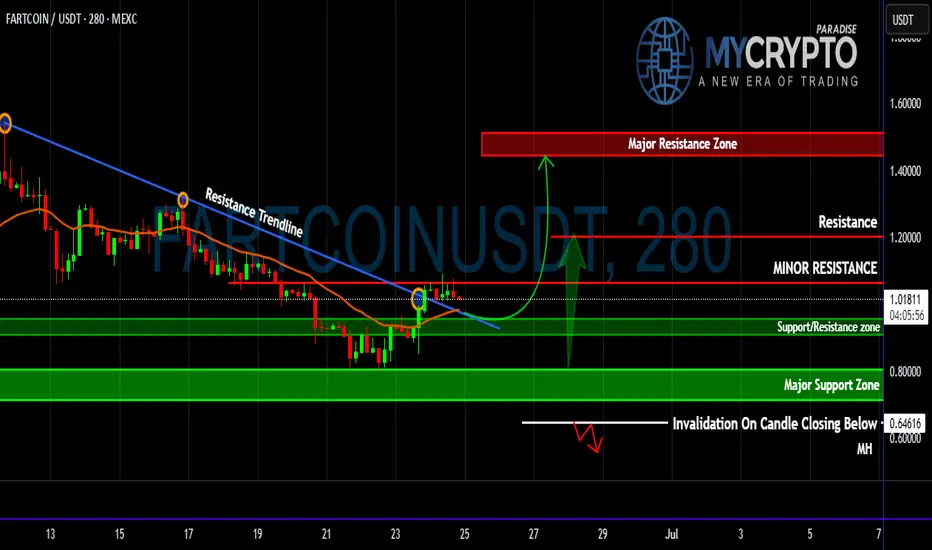
FARTCOIN Flipped Key EMA—Is This the Start of a Pump or Trap?Yello Paradisers ! Are we looking at a breakout that could deliver massive upside, or is this just another emotional trap before the next leg down? The market has been ruthless lately, and unless you base your decisions on structure, probability, and proper confirmation, you’re gambling—not trading. Let’s break down this #FARTCOIN setup from a professional standpoint.
💎#FARTCOIN has finally broken above a clearly defined descending resistance trendline, signaling a potential probable shift in short-term momentum. This breakout occurred precisely as the price reclaimed the multi-timeframe EMA —a key dynamic level that has consistently acted as resistance throughout the downtrend. The reclaim and hold above this EMA significantly increase the probability of a short- to mid-term trend reversal, especially as it aligns with an early attempt to build a bullish market structure.
💎Price is now trading just below a minor resistance level. This zone has capped previous upward attempts and is the first level bulls must overcome for continuation. A confirmed 4H/1H or daily candle close above this resistance will open the door to a measured move toward the next key level at $1.20265, with extended upside potential into the major resistance zone between $1.44660 and $1.55099. Should bullish momentum pick up with increasing volume, a Probable upside move becomes a realistic scenario.
💎However, none of this is guaranteed. We're dealing with probabilities, not certainties. The support/resistance flip zone between $0.95949 and $0.90596 now becomes a crucial reference point. A healthy retest of this area could provide a higher-probability long entry, especially if price continues to respect the reclaimed EMA. Below that, the major support zone from $0.80693 to $0.71058 represents a broader demand block. If the price pulls back this far, it may signal the formation of a larger accumulation range rather than immediate continuation.
💎To manage risk effectively, traders must monitor the invalidation level at $0.64616. A 4H candle close below this level would nullify the bullish breakout scenario and increase the probability of renewed bearish control, suggesting the recent breakout was a deviation or fakeout.
Stay sharp, Paradisers! Will this be a breakout or a fake-out? Only time—and disciplined trading—will tell!
MyCryptoParadise
iFeel the success🌴
Gold RangeThis reaccumulation model for gold just popped into my head, so I wanted to post it on my profile to see how wrong I was later. My main focus right now is this potential internal distribution, which will likely take some time to confirm/invalidate. I'll take a closer look if there are more signs that it's playing out.

Weekly Forex Outlook Sun.June.29.2025 - Fri.July.4.2025Like and Comments would be appreciated :D Not Financial Advice, Just my outlook/opinion

Weekly Market ReportIn this week’s video, I break down the key technical levels and market dynamics across four major instruments: S&P 500 (/ES), Gold (XAUUSD), Crude Oil (WTI), and Bitcoin (BTCUSD).
We explore price structure, liquidity zones, and potential setups with a focus on probability-based trade planning and risk management. Whether you're a swing trader or intraday participant, this breakdown offers valuable insight into the week ahead.

Market Re-Cap and Outlook for NEXT WEEKHere I am giving you a little insight as to what trades I am currently in, taken & looking to take for the week just gone and the week coming.
1 Winning trade on EU
1 Current open position on EU
EURGPB - Breakdown
AUDUSD - Breakdown
NZDUSD - Breakdown
Gold - Breakdown
If there are any pairs you would like me to share my feedback on give me a message and I will be happy to try and do so.
Thanks
Happy Hunting

Solana coin Long setupIn this video I go through the current price action and talk about how the 126$ target level was recently reached for a clean long entry and on the daily timeframe we printed a higher low .
I expand on my thoughts for a continuation to the upside and to retest some higher levels of resistance 180$s and time will tell if we print a higher high at the 180$s before retesting the $200 zone .

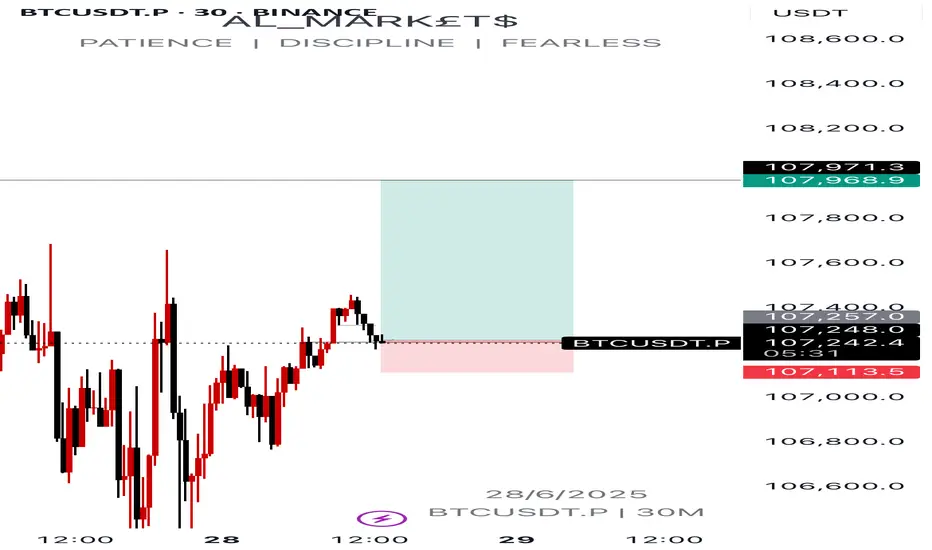
BTCUSDT.P potential short term buysCurrent price action is pointing out to potential short term buys on btc.
IRENs Incredible Surge Continue next wWeek?NASDAQ:IREN has been on a rampage since the April surging 175% and nearing all time high! A great couple of trades for us so far!
Price is likely to hit all time high next week with such a strong trend, where resistance and a pullback is a high probability.
The weekly pivot is $9.77, the most likely area for price to find support just above the 0.382 Fibonacci retracement (which will be dragged up to the weekly pivot once a new high is made).
Price discovery terminal target are the R3 & R5 weekly pivot points at $28 and $40.
Safe trading

$HUT Macro Chart Preparing for Breakout?NASDAQ:HUT looks poised for a strong breakout with a wave 3 long term target of $58 and a short term resistances of $21 and $33
HUT is moving strong almost up 100% from the recent swing low, overcoming its weekly 200EMA with ease. A test of the 200EMA as support is likely before continuation.
Price is consolidating under major resistance High Volume Node (HVN) and the weekly pivot point. Consolidation under resistance often leads to a breakout.
A series of 1-2s appears to be taking place on the Elliot Wave count finding support at the 'BTC-Miners golden pocket' of 78.6 Fibonacci retracement.
Analysis is invalidated below $10.10
Safe trading

Bitcoin: Curve AdjustmentsBottoms can be expressed as a curve which matches logarithmic growth patterns. In the long-term perspective it serves as signal of trend's transition phase in broader scale. Coordinate of top adjusted accordingly.
Extending them is crucial because together they gives boundaries of range compression. Some sort of wave limits which help to clarify price-based levels.

BTC.D Nearing a Historic Inflection PointBTC Dominance (BTC.D) is fast approaching the 67.64% resistance level, sitting firmly within a key supply zone marked at point D. This area represents a high confluence region, aligning with a long-term descending trendline and the upper boundary of a bearish wedge structure.
If validated, this would complete a potential ABCDE reversal formation suggesting a macro top in Bitcoin dominance may already be forming.
A rejection from this zone could trigger a pullback towards the immediate support at the 60% level. Should this level break, further downside may unfold toward 54.64%, with a deeper long-term target resting around the 45% zone.
This setup could mark a significant turning point if dominance begins to unwind, we may witness an aggressive rotation into altcoins. Keep a close eye on structural breaks and liquidity sweeps.
Alt season might just be closer than we think.
What’s your take on this potential shift? Let’s discuss in the comments.

Eur/Jpy breaks the previous🔍 Key Observations:
Supply Zone (169.713):
Price is approaching a marked supply zone, where sellers previously stepped in with strong momentum. This zone could act as a resistance area, potentially rejecting price downward.
Previous Low Break:
The structure shows that price broke below a previous low, indicating bearish pressure and a possible shift in market sentiment.
Demand Zone Below (~168.700):
There's a strong demand zone marked below the current price, which may serve as a target for short sellers or an area for bullish entries if reached.
Projected Move (Orange Arrows):
The orange path suggests a potential move:
Price may first retest the supply zone around 169.713.
A rejection from that level could trigger a downward move, breaking recent support levels.
The price may bounce slightly midway before continuing the drop toward the demand zone.
RSI Indicator (Relative Strength Index):
Currently at 54.80 (blue line), the RSI is nearing overbought territory but not yet extreme. This leaves room for a bit more upside before a potential reversal, aligning with the idea of testing the supply zone first.

Gold – Can It Recover From 3 Week LowsGold is back in focus this morning after it fell to a 3 week low at 3287 in early European trading.
Part of the reason for the fall may have been the on-going ceasefire agreement holding between Israel and Iran, which can reduce the need for Gold as a safe haven, or prices may have been influenced by comments from US Commerce Secretary Lutnick made to Bloomberg TV overnight which suggested that the Trump administration have plans to reach agreements with a set of 10 major trading partners ahead of the July 9th pause deadline to reinstate higher tariffs.
Of course, these potential Gold negatives need to be balanced against the potential positives of increased optimism in recent days that the Federal Reserve may cut interest rates by more than expected into the end of 2025 as the US economy stalls, and the US dollar printing a fresh 3 year low yesterday.
Looking forward, the release of the Fed’s preferred inflation gauge, the PCE Index at 1330 BST later today could hold the key to whether Gold falls below support to even lower levels (see technical section below) or moves back higher again into Friday’s close.
Whatever the outcome, its setting up for an interesting end of the week for Gold.
Technical Update:
With selling pressure developing in Gold again so far this morning, traders might well be searching for next support levels that may be successful in limiting current price declines, or if broken, could in turn lead to a more extended phase of weakness.
Much will depend on future price trends and market sentiment, but as the chart above shows, latest price activity is this morning posting new 3-week lows for Gold. This suggests traders might now be focused on 3245, equal to the last correction low in price posted on May 29th as the next possible support level.
While not a guarantee of further declines if broken, 3245 closing breaks could lead to further price weakness towards 3120, the May 15th downside extreme.
Of course, it is possible this 3245 low does continue to act as support to price weakness and may turn activity higher again. However, if this is to lead to a more sustained period of price strength, resistance might now stand at 3356.
Equal to the Bollinger mid-average, closing breaks might be required to suggest possibilities to resume price strength back towards the 3435/3452 May 6th and June 16th price failure highs.
The material provided here has not been prepared accordance with legal requirements designed to promote the independence of investment research and as such is considered to be a marketing communication. Whilst it is not subject to any prohibition on dealing ahead of the dissemination of investment research, we will not seek to take any advantage before providing it to our clients.
Pepperstone doesn’t represent that the material provided here is accurate, current or complete, and therefore shouldn’t be relied upon as such. The information, whether from a third party or not, isn’t to be considered as a recommendation; or an offer to buy or sell; or the solicitation of an offer to buy or sell any security, financial product or instrument; or to participate in any particular trading strategy. It does not take into account readers’ financial situation or investment objectives. We advise any readers of this content to seek their own advice. Without the approval of Pepperstone, reproduction or redistribution of this information isn’t permitted.

Eurusd bos/making LL swingsAs you can see on the 1 hr tf there's a bos creating a lower low, I think the market made new highs but in the short term i'm expecting the market to balance out fvg before rallying higher. Current bias : bearish short term and bullish long term

Long trade
30sec TF entry
📍 Pair: USDJPY
📅 Date: Thursday, June 26, 2025
🕒 Time: 4:15 AM (London Session AM)
⏱ Time Frame: 15min
📈 Direction: Buyside
📊 Trade Breakdown:
Metric Value
Entry Price 143.803
Profit Level 144.825 (+0.71%)
Stop Loss 143.733 (−0.05%)
Risk-Reward
Ratio 14.6 : 1
🧠 Context / Trade Notes
🔄 15 Minute Structure Support:
The trade was based on a reactive low from the 5-minute TF, aligning with a buy-side imbalance zone formed on the 5-minute chart (Monday, 16th June, 10:00 AM).
📉 RSI in Low Region:
RSI was observed in an oversold condition on LTFs, providing additional confluence for a short-term reversal setup.
30sec TF entry overview

Final $LINK in the corrective chain?If you find this information inspiring/helpful, please consider a boost and follow! Any questions or comments, please leave a comment!
LINK could be finishing a double zigzag correction. Recent reaction at the channel’s most likely target area shows promise. Watching for an internal retrace that holds above key support.
Key Levels:
11.81: Ideal retrace floor
11.00: Break kills impulse idea
13.25: First upside flip needed
15.00: Big level to break for bulls
Bulls have been tricked before with possible impulse starts. This one has the right look and confluence, but caution is warranted. Ideally, we get consolidation and push above 13.25 to build confidence in further upside.
As long as price holds above 11.81 and builds higher lows, potential remains for an impulsive move up. Break below 11 and bias flips back to bearish continuation.
Trade Safe!
Trade Clarity!

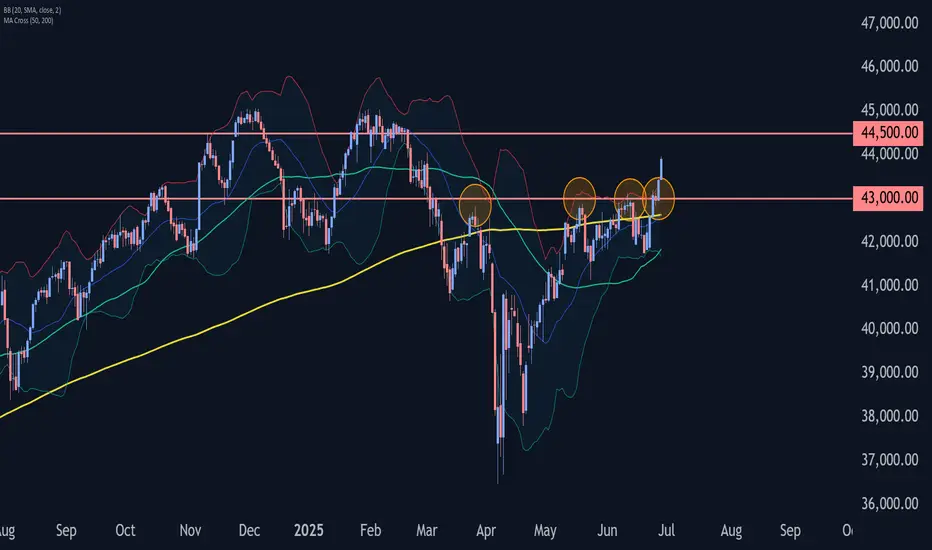
Dow Jones Wave Analysis – 27 June 2025
- Dow Jones broke pivotal resistance level 43000.00
- Likely to rise to resistance level 44500.00
Dow Jones index recently broke above the pivotal resistance level 43000.00 (which has been reversing the price from the end of March, as can be seen from the daily Dow Jones chart below).
The breakout of the resistance level 43000.00 accelerated the active impulse wave 3 of the intermediate impulse wave (C) from the end of May.
Dow Jones index can be expected to rise to the next resistance level 44500.00, which is the target price for the completion of the active impulse wave (C).
Don't Miss Your Port Call (NCLH & CCL)Hello Everyone! Please, remember this is for educational purposes only, you MUST do your own research. Investing involves risk and should be evaluated with your own financial advisor...
Nonetheless, I am personally invested in NCLH. When you look at each industry mentioned, specifically into the individual companies mentioned, they have ALL recovered. I expect this will take more time, but macroeconomic conditions are favorable although everyone though we were going into a recession several months ago lol... Cruise line companies have been showing record revenue and strong sales for 2025 and 2026.
When you evaluate interest rates and inflation, you might think we are still a bit too high, yet discretionary spending has not ceased much, yet it is expected a possible rate cut in July or August and what do you think will happen to the market...? Just Saying.
Don't Miss your Port Call, next stop BAHAMAS!
Have a great weekend everyone. Feel free to share with others. Drop your comments below if I missed anything or you would like me to look at other companies. Happy Trading!

BA, Boeing1. Higher Timeframe Context
Price is currently trading within a well-defined higher timeframe supply zone between 214–218, which previously acted as a major distribution area. This zone aligns with a prior bearish impulse leg and represents unmitigated institutional sell-side interest.
2. Current Price Action
On the 15-minute chart, price has aggressively rallied into the supply zone with low retracement, suggesting an imbalance created by passive sellers.
The move into this zone has occurred without a clear internal structure shift to the downside yet, but early signs of exhaustion are evident.
There's a visible cluster of equal highs around 218, indicating resting buy-side liquidity that smart money may target.
3. Liquidity & Market Structure Outlook
We anticipate a liquidity sweep of the highs at ~218, which is typical when price revisits a premium zone filled with uncollected orders.
The projection is for a short-term rejection or distribution reaction from current levels, which could lead to a retracement into the newly formed demand zone at 208–210.
This area represents a bullish order block, which could act as a reaccumulating point before a continuation to the upside.
4. Trade Planning Framework
Short Bias (Reactive Play):
Look for signs of lower timeframe distribution, such as a break of internal structure or supply engulfing at 214+.
Potential target: 208–210 zone for partials or full exit.
Long Bias (Continuation Play):
Upon reaction from 203–205demand, anticipate bullish PA such as a CHOCH (Change of Character) or BOS (Break of Structure) on LTF.
Entry on confirmation (e.g., bullish engulfing or mitigation entry).
Target: 218+ liquidity sweep zone.
5. Risk Management Considerations
Avoid blind entries within the resistance zone; confirmation is key.
Size positions based on RR parameters (minimum 1:2) and predefine invalidation levels—especially in the short scenario, as failure to reject this zone could lead to a breakout.
Be aware of potential news catalysts or macro events that may add volatility to BA during the setup period.
