US100 (NASDAQ 100 Index) – Breakout with Clear Upside ProjectionUS100 has broken out cleanly above the key resistance at 22,097.1, indicating bullish continuation. The breakout is supported by strong upward momentum, targeting the next key level around 23,441.9, as illustrated by the projected range.
Support at: 22,097.1 🔽 | 20,750.0 🔽
Resistance at: 23,441.9 🔼
🔎 Bias:
🔼 Bullish: Sustained price action above 22,097.1 keeps the bullish breakout valid, aiming toward 23,441.9.
🔽 Bearish: A drop back below 22,097.1 would invalidate the breakout, possibly pulling price toward 20,750.0.
📛 Disclaimer: This is not financial advice. Trade at your own risk.
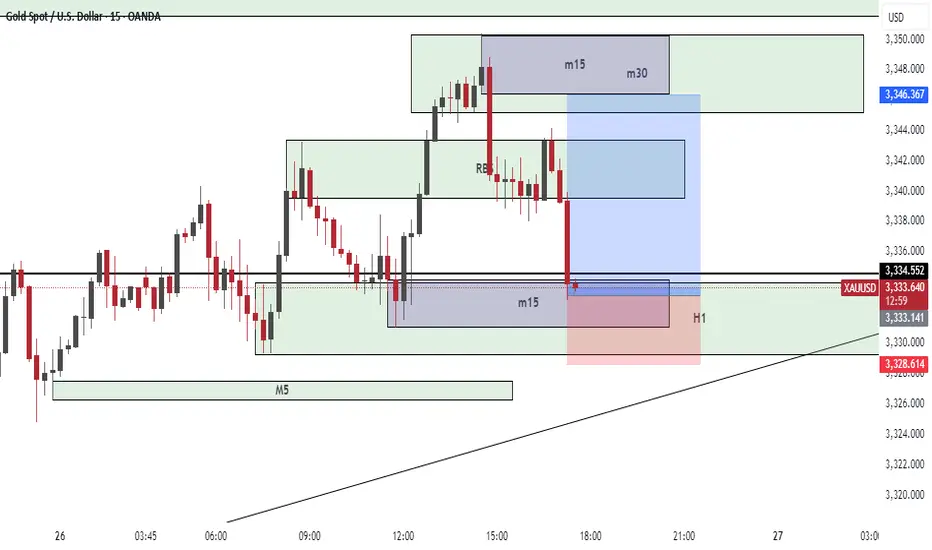
Supply and Demand

Possible movement on the near future, if it close under 3332If the prices closes under 3332 and we have enough volume in the markets we will hunt the liquidity in the 3320-3315 area, before a possible move to the upside.

Advance technical analysis AUX USD ✅ Advanced Technical Analysis – XAU/USD (Gold) – 1H Timeframe
🧩 Chart Overview:
Timeframe: 1 Hour (H1)
Current Price: 3,333.675
Recent High: 3,451.525
Recent Low: 3,293.500
Marked with BOS (Break of Structure), CHoCH (Change of Character), supply and demand zones.
---
🔍 Step-by-Step Technical Breakdown:
---
1️⃣ Market Structure (Price Action)
🔺 Bullish Phase:
From June 13 to June 22, price showed a series of H1 BOS, confirming bullish structure.
🔻 Shift to Bearish:
After June 22, we observe several H1 CHoCH and BOS to the downside.
This indicates a clear transition from bullish to bearish, or at least a corrective phase.
---
2️⃣ Supply & Demand Zones
🟢 Demand Zone:
Marked between 3,293.5 and ~3,310
Price dipped into this zone and showed a minor bullish reaction (lower wick = liquidity grab)
🔴 Supply Zones:
Resistance at 3,393.509 (minor)
Stronger supply between 3,440 and 3,451 (previous unbroken highs)
---
3️⃣ Fibonacci & Potential Reversal Targets
If demand holds and bullish confirmation appears:
TP1: 3,393
TP2: 3,440
TP3: 3,451.5
These levels align well with structure and historical resistance.
---
4️⃣ Candlestick Behavior
Recent candles show price tapping the demand zone with some rejection.
Look for bullish engulfing, pin bars, or momentum candles as confirmation.
---
5️⃣ Potential Long Setup (If Confirmed):
Element Value
Entry Zone 3,305 – 3,315
Stop Loss Below 3,293 (e.g., 3,285)
TP1 3,393
TP2 3,440
TP3 3,451
Risk–Reward Estimated 1:3 to 1:5
---
⚠️ Risks & Considerations:
If the 3,293 demand zone breaks, bearish structure may continue.
Liquidity grabs and false breakouts are possible – wait for solid confirmation.
Align your entries with higher timeframe signals (e.g., H4) for stronger confluence.
---
❗️Disclaimer:
> This analysis is provided for educational purposes only and does not constitute financial advice or a recommendation to buy or sell.
You are solely responsible for your own trading decisions.

SNOW Based on the current 15-minute chart for SNOW (Snowflake Inc.), we are observing a clear liquidity sweep and internal CHoCH (Change of Character) following a strong bearish impulse. Price has aggressively retraced and is now approaching a key supply zone near 222.00, which also aligns with the most recent internal high and potential inducement zone.
I anticipate price may push slightly above 222, tapping into remaining liquidity from late buyers before reversing. This aligns with a higher timeframe resistance, suggesting the up-move is corrective rather than impulsive.
From a structural standpoint:
The prior Break of Structure (BoS) confirms bearish intent.
Liquidity was taken both at the highs and lows, typical of distribution before a larger move.
The ideal short entry is upon confirmation of rejection from this 222+ level, targeting the demand zones around 217.00 and possibly as low as 211.00, respecting the higher timeframe bearish narrative.
Risk Management Tip: Wait for a bearish engulfing or clear rejection pattern on the lower timeframes within the 222–223.20 range before entering short. Set stop-loss slightly above the last high and manage position accordingly as price approaches each demand zone.

THE KOG REPORT - UpdateEnd of day update from us here at KOG:
Again, just like yesterday, we completed the long trade into the red box, RIPPED then played red box hockey before swooping the low and coming back up. What madness on the markets with continuous whipsawing which is not allowing traders to hold positions without huge stop losses.
For now, we have support at the 3325-8 level which if held should give us a move upside towards the red box. What we want to see here is do we get a lower high or not?
MA's still drawn together and more choppy price action expected in the sessions to come.
As always, trade safe.
KOG

EUR/USD | Bullish SMC SETUP EUR/USD | 15min | Bullish SMC Setup 🚀💶
Price swept Asian session lows into a higher timeframe demand zone, followed by a strong bullish BOS (Break of Structure). We’re now anticipating a pullback into the FVG (Fair Value Gap) + LQC (liquidated candle) and demand zone for potential continuation to the upside.
The entry idea is based on:
🔹 Liquidity Grab (sell-side sweep)
🔹 BOS confirmation
🔹 FVG + Demand confluence
🔹 Expecting bullish continuation toward previous high and premium zone.
Waiting for price to tap the zone before riding the wave up! 📈
You can wait for confirmation on 5min TF after tap into POI
Let’s see if it delivers.
#SMC #EURUSD #Liquidity #SmartMoney #FXTradingClub #OrderFlow #Sam_trades_smc

XAUUSD/GOLDThe bullish trend has opened. After the retracement is confirmed, continue to buy and wait for the market to rise and fill the gap.

GBPUSD GBPUSD has completed its bullish leg, reaching our previously identified target zone.
Current price action indicates potential exhaustion, and we are now actively monitoring for a short setup, targeting the 1.37200 level, which aligns with a minor inefficiency and previous structural support turned resistance.
This move is supported by overextended intraday momentum on the 15-minute chart, along with bearish divergence forming against key price levels — suggesting a potential retracement phase.
Risk Management Strategy:
Entry: Upon confirmation of a bearish setup (e.g., rejection from a lower high or failure to break recent highs with strength).
Stop-Loss: Placed above the most recent swing high or invalidation level, ensuring protection against false breakouts.
Target: 1.37200, offering a favorable risk-to-reward ratio of at least 1:2.
We’ll continue to monitor price behavior closely and adjust if momentum shifts or invalidation levels are breached.

Long position for 1INCHUSDT in 4H 2.74 RRLong Position for 1INCHUSDT in 4H with a 2.74 RR
Long 0.1748
TP 0.1904
SL 0.1691

Divergence FormingThe descending channel pattern is always my favorite. Mixed with RSI, channels aligning with gaps and volatility being at $20, its a good chemical mix.
AMEX:SOXS to $10 can happen quickly but I think the move will be sharp and quick. Long term bearish signals forming to.
Lets see where it goes!

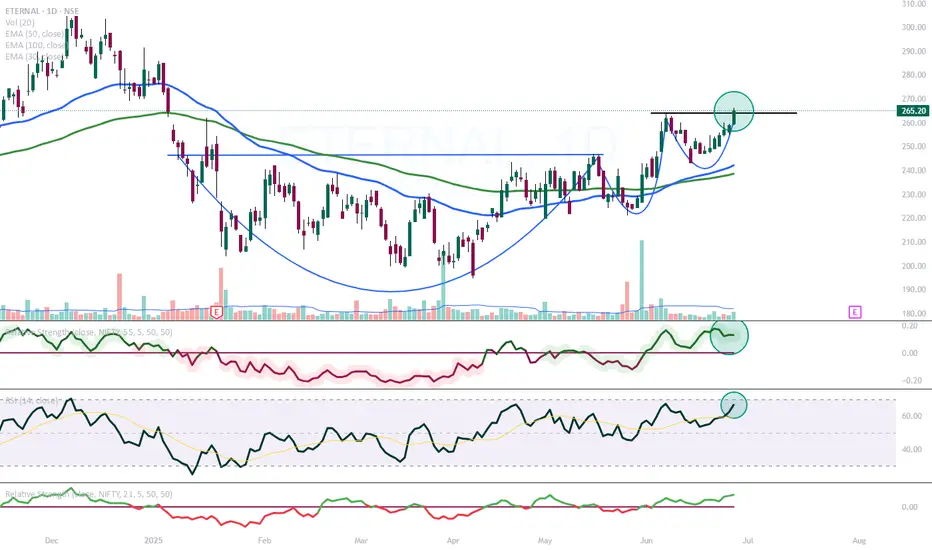
ETERNAL gaining momentum!NSE:ETERNAL seems to be gaining momentum
RS positive
RSI Above 60
Trying to break out.
We need volume confirmation on this breakout.
BANKNIFTYBanknifty levels are based on imbalances
1. gapup 57200 wait for retracement for long
q2. 57200-56800 trade breakout
3. gapdown 56800 short

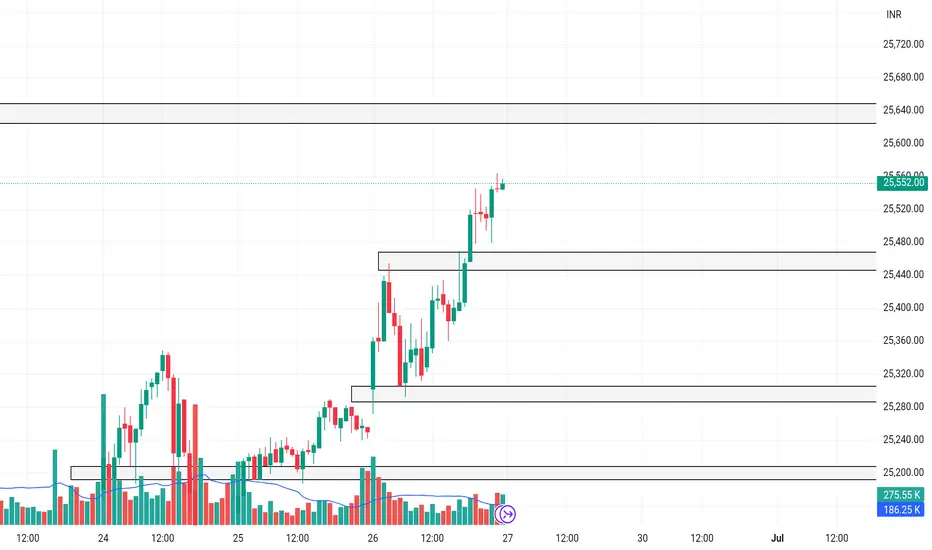
NIFTYNifty levels are based on imbalances
1. gapup 25650 long
2. 25650-25450 trade breakout
3. gapdown 25450 short
#USDCAD: Two Major Buying Zones, Patience Pays! As previously analysed, USDCAD is expected to decline towards our predetermined entry point. We anticipate a bearish US Dollar for the remainder of the week, which will ultimately lead USDCAD to reach the entry zone. Three distinct target areas exist, collectively worth over 1100 pips. Each entry point, stop loss, and take profit is clearly defined.
We wish you the best of luck and safe trading.
Thank you for your support.
If you wish to assist us, we encourage you to consider the following actions:
- Like our ideas
- Provide comments on our ideas
- Share our ideas
Kind Regards,
Team Setupsfx_
Much Love ❤️🚀

Btcusd sell setup H4Hello! Friends,
Greetings. Please leave a Like if you like the idea.
Before start talking about technical Let's share your LOVE by giving me LIKES to support this work. Thanks in advance.
