Gold Double Bottom Rejection - Bullish Confirmation PatternThere is currently a double bottom rejection pattern at play and price is reacting to an H4 TF demand zone. Confirmations to go long will be in this demand zone or the next one. But my money is on the current one.
Best thing to do is wait for an M15 supply to break to validate taking longs from the current demand. But the bulls are showing strength.
Supply and Demand

Is it right time and choice to buy UNH Stock - {15/07/2025}Educational Analysis says that UNH Stock (USA) may give trend Trading opportunities from this range, according to my technical analysis.
Broker - NA
So, my analysis is based on a top-down approach from weekly to trend range to internal trend range.
So my analysis comprises of two structures: 1) Break of structure on weekly range and 2) Trading Range to fill the remaining fair value gap
Let's see what this Stock brings to the table for us in the future.
Please check the comment section to see how this turned out.
DISCLAIMER:-
This is not an entry signal. THIS IS FOR EDUCATIONAL PURPOSES ONLY.
I HAVE NO CONCERNS WITH YOUR PROFIT OR LOSS,
Happy Trading.

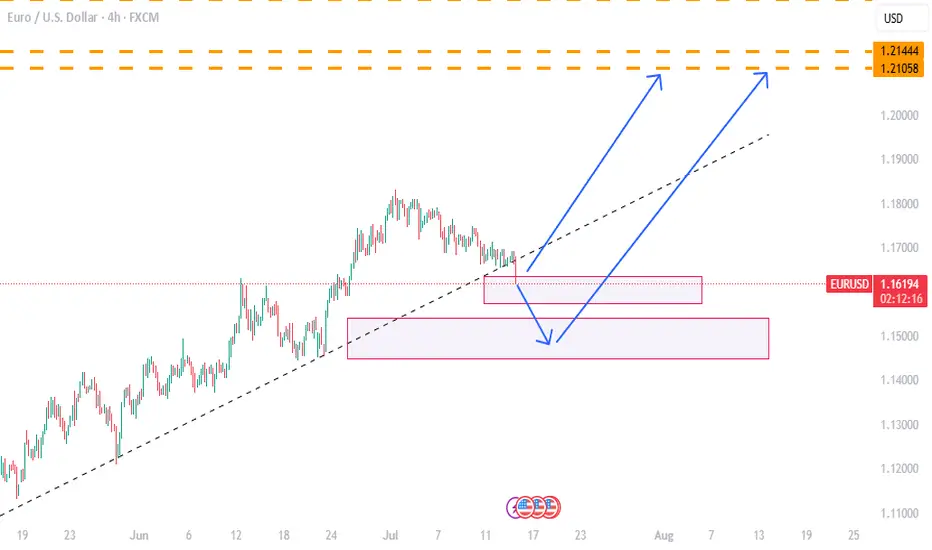
EURAUD, Trend continuationPrice has made a correction and pulled back into the trendline, a continuation of the uptrend is the next.

analyse eurusd *The content on this analysis is subject to change at any time without notice, and is provided for the sole purpose of assisting traders to make independent investment decisions.
BTC ShortBTC has shown some short-term bullish signs, with a corrective bounce from the demand zone around 116,000–115,000, indicating a temporary reaction from buyers. However, this move appears to be a retracement rather than a full reversal, as the overall structure remains bearish.
Price is currently pushing into a previously broken intraday supply zone and approaching the 50% equilibrium level near 119,000, which aligns with a potential lower high forming. As long as BTC stays below this key level and fails to break market structure to the upside, the bias remains bearish.
We still believe BTC is likely to come back down to retest the recent lows, possibly revisiting the 116,000 zone to sweep more liquidity before any meaningful reversal can occur.
As always, proper risk management is essential. Wait for confirmation before entering trades and protect your capital in these volatile conditions.

BTC Analysis — Long-Term Buy Zone AheadI'm watching $111,000 as a major buy zone on Bitcoin.
If price retraces to that level, I’ll be ready to enter a long position.
This is not a prediction — it’s a scenario.
Smart traders don’t guess, they prepare.
Let price come to your level. No chasing.
📍Set your alerts and stay patient.

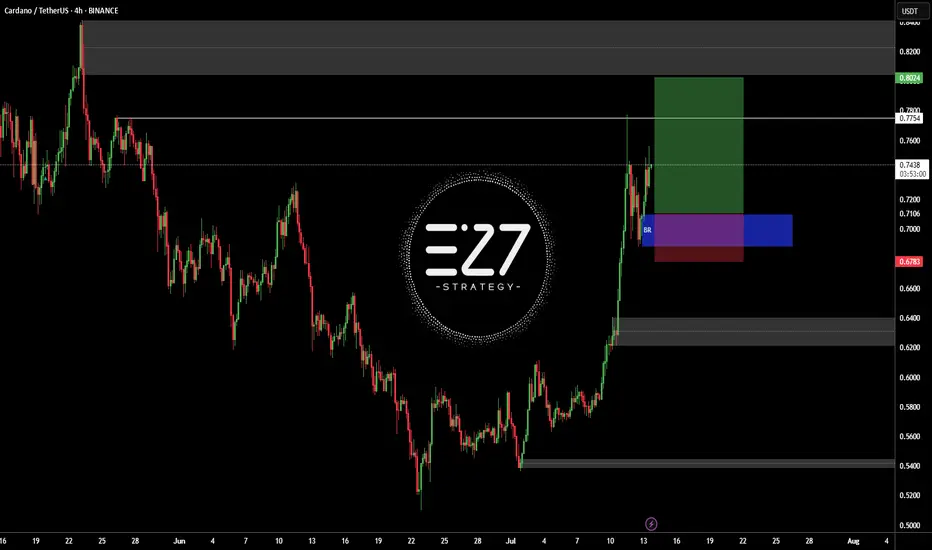
ADAUSDTBINANCE:ADAUSDT in up-trend and my open position buy in latest sowing low.
Best entry: 0.6952 - 0.7259
Target: 0.7754 - 0.8024
Stop loss: 0.678
Please control RISK management
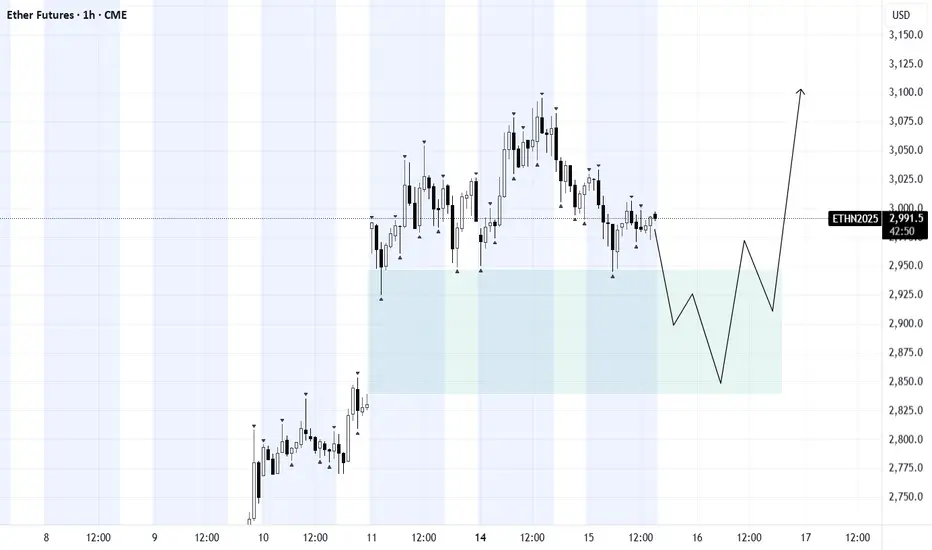
ETH/USDTETH is showing a similar structure to BTC, with a visible gap in play. A partial or full fill of the gap, followed by a bullish structure break on lower timeframes, would be a strong signal of buyer strength.
Waiting for confirmation before acting.
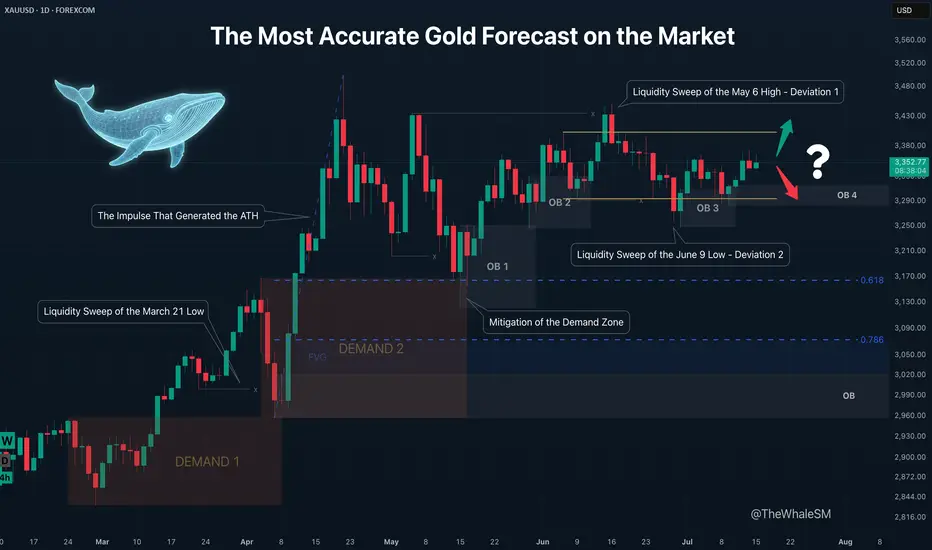
The Most Accurate Gold Forecast on the MarketThis is a continuation of sorts of my educational article that received an "Editor's Pick" from TradingView and a large number of positive reactions from this amazing trading community. However, unlike that post, this is a trade idea that outlines clear entry conditions for when the price reaches a relevant manipulation zone and shows a reversal reaction. If you don't want to get into the details and trace the entire chain of events through which large capital brought the price to its current levels, feel free to skip the intro and go straight to the 4H chart with the long setup conditions.
To better understand the logic of "smart money," let's revisit the Gold daily timeframe from my educational article:
We will approach this analysis like detectives, following the facts and footprints in the style of Sherlock Holmes and Hercule Poirot.
So, let's begin our investigation. On the daily structure, we see a clear order flow confirming the intention of large capital to lead the price in continuation of the uptrend. After the latest impulse that began on February 28th and ended on April 3rd, the price corrected and mitigated the DEMAND1 manipulation zone. The "Whale" refueled with liquidity, eliminated some competitors, closed its losing short positions used for the manipulation, and gained energy for the next impulse that set a new ATH. The correction that mitigated the DEMAND1 zone was nothing other than the next manipulation, also in the form of a DEMAND zone, within which there is a still-valid daily order block. How can we assert that DEMAND 2 is a manipulation and not just a correction?
Firstly, the sharp nature of the move swept liquidity from the March 21st low. Secondly, the sharp upward impulse accompanied by a series of FVGs showed the Whale's true intention. And thirdly, the reversal from this DEMAND 2 zone, combined with the 61.8% Fib retracement level, resulted in the formation of the next manipulation in the form of the OB 1 order block. Further, we see the continuation of the order flow on this daily structure; the price reacts to OB1, forming another order block, OB2 . The impulse from OB2 sweeps liquidity from the May 6th high. Many might have expected a continuation of the impulse and a new ATH instead of a sweep of this high, but as often happens when too many participants pile into one direction, the price sharply reverses and liquidates their positions. This intense decline after sweeping the high looked something like a local trend change from bullish to bearish, but the sharp recovery after sweeping the liquidity from the June 9th low and forming a new order block, OB 3 , finally revealed what was really happening: it turned out to be a range . It's impossible to identify a range until it is fully formed. A range is another type of manipulation where internal and external liquidity is swept from both sides. In our case, there was first a deviation above (Deviation 1 on the chart), then a deviation below (Deviation 2), after which the price swept some internal liquidity and got stuck exactly in the middle of the range.
And finally, after all our investigations and deductions, we can say with absolute certainty, practically with 100% confidence divided by two, that ABSOLUTELY NO ONE KNOWS where the price will go from the current levels. Because the center of a range is a state of complete uncertainty. Moreover, I dare to suggest that even the Whales don't know where the price will go right now. They certainly have enormous funds to sharply move prices at the right moments to capture liquidity and conduct manipulations. At other times, they can nudge the market to create a trend and direct it like a chain reaction of falling dominoes. But the entire market is much larger, and if its sentiment changes drastically due to external factors, smart money won't waste its resources fighting it. Their goal is to make more money, nothing personal. Why else is the price stuck in the middle right now? Inflation data is coming out soon, which could push the price in an unpredictable direction. The Whales will wait to use this news-driven impulse to their advantage.
So, what have we concluded from this investigation? Was it all in vain since we can't even say with 51% probability where the price will go next? Of course not. We simply need to wait for the price to reach an area where the probability of it moving in a certain direction is significantly higher than 50% — that's all you need to be profitable in the long run. This probability will never be close to 100% because we don't know what's really happening in the depths of the market. Are the Whales accumulating positions in this range now, or are they selling off at high prices after the ATH? Unless you are one of the few direct participants in large capital, you can't know this. Moreover, you don't need to know it to make a consistent profit in the market. It is enough for us to predict the next move of smart money with high probability at certain moments, join their movement, and take our profit. It's like a weather forecast: the further from the current date, the lower the probability of it being accurate. It's the same with the market; a completely unpredictable combination of factors, news, and hidden internal processes can lead the price on a unique path, but always accompanied by smart money. It doesn't matter where the gold market goes next, whether to a new ATH or down to the next correction level. When the Whale reveals itself again by leaving a trail in the form of a manipulation, we can lie in wait near it and join its next move. Why is it generally a good idea to enter from manipulation zones? You are essentially stepping onto a field where the Whale has already cleared the liquidity, and it has returned to that place for other business — to close its losing positions. That is, a mitigated manipulation zone is a safer place to enter the market; there's a much lower chance the Whale will absorb your position. Right now, we have such a manipulation in the form of the OB 4 order block, and we can switch to the 4H timeframe to look at a potential entry zone in more detail.
4H CHART - SETUP CONDITIONS
So, we already know the general context: the price is inside a range. After the second deviation, it has already reacted to the order block formed after it, and we are waiting for the mitigation of the next one, OB 4 , which will serve as a pivot point for a potential setup. A reversal from this order block will confirm the order flow for the price to move at least to the upper boundary of the range. The presence of a manipulation zone alone is not enough to open a position; additional confirming conditions are always needed. As one such condition here, we can take the combination of mitigation with one of the Fibonacci retracement levels — 61.8% or 78.6%. Upon reaching each level, the price must hold (not be broken by the bodies of 1-4H candles) and show a reversal reaction. The final confirmation for entry will be an LTF confirm in the form of a break of structure (BOS) or the beginning of order flow on a lower timeframe. An important part of the context is that important US inflation news is coming out soon, and positions should not be opened right before it or for some time after (at least an hour).
Invalidation of the long scenario would be a break below the 78.6% level and OB 4.
~~~~~~~~~~~~~~~~~~~~~~~~~~~~~~~~~~~~~~~~~~~~~~~~~~~~~~~~~~~~~~~~~
If you found this analysis helpful, support it with a Boost! 🚀
Have a question or your own view on this idea? Share it in the comments! I read every single one. 💬
► Follow me on TradingView for more educational content like this and to not miss my next detailed trade idea .
~~~~~~~~~~~~~~~~~~~~~~~~~~~~~~~~~~~~~~~~~~~~~~~~~~~~~~~~~~~~~~~~~
BTCA gap is currently in play. For further upside, it would be healthy to see a full or partial fill in the near term, followed by a strong reaction.
Such a move would signal strength and validate bullish momentum.
LONG ON GBP/USDGU is currently in its pullback phase of its uptrend.
We have a nice sell side Liquidity sweep being completed at this moment.
Price should now tap into previous demand that broke a high to repeat history and rise again.
Very Nice Setup over 300 pips on the table to the previous high/supply zone.

THE KOG REPORT - UpdateEnd of day update from us here at KOG:
Nice start to the week with price attempting that higher red box and failing to breach it. We then activated an Excalibur signal short, identified the structure and got a lovely move into the 3552 level from 3371 activation. Traders then had the opportunity to capture the tap and bounce from the 50MA on the hourly, again giving a minimum of 100pips on the bounce.
Now, we have support below 3340 which was the bias level which has also rejected price giving a long, but, resistance here stands at 3357. Below that level we are more likely to see this range or attempt lower sticking to the plan on the KOG Report published yesterday.
KOG’s Bias of the day:
Bullish above 3340 with targets above 3375, 3388 and above that 3392
Bearish on break of 3340 with targets below 3335, 3332, 3320 and 3310 (No Breach)
RED BOXES:
Break above 3376 for 3382, 3390, 3396 and 3304 in extension of the move (No breach)
Break below 3365 for 3362✅ and 3355✅ in extension of the move
As always, trade safe.
KOG

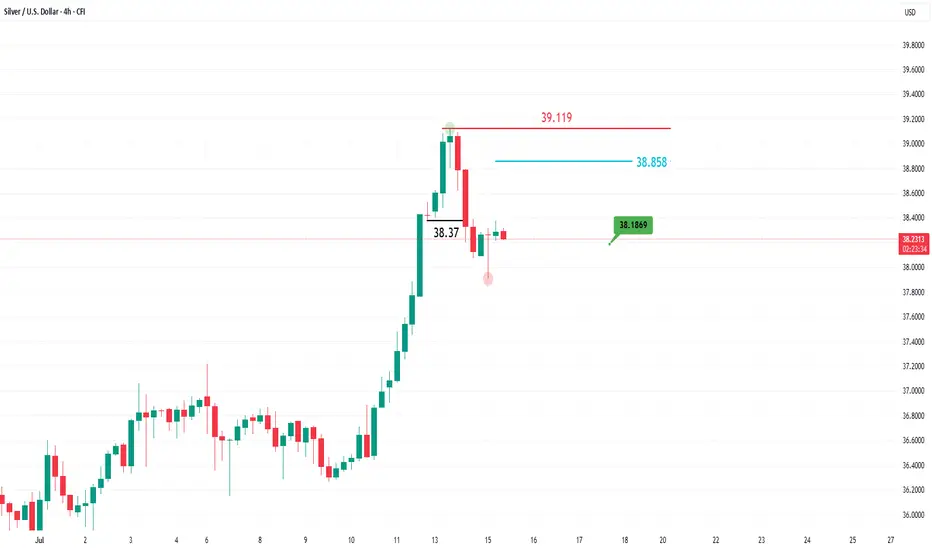
A temporary pause for silver!After its recent surge to reach the highest levels since September 2011, silver is showing short-to-medium-term negative signals on the 4-hour timeframe, before potentially resuming its upward trend on the daily chart.
As seen in the chart above, the price dropped quickly below the 38.37 level, forming a new low and shifting the 4-hour trend from bullish to bearish. The rebound to the 38.858 level appears to be a corrective move targeting the 38.1869 level.
The bearish scenario would be invalidated if the price rises again and forms a higher high on the 4-hour chart above the 39.119 level.
buy projectionBullish structure(high,low,irl).
Liquidity: sweep and inducement
Point of interest: orderblock
SIGN buy/long setup (4H)A tight consolidation range has been broken to the upside, and price has not yet pulled back to it.
On the chart, we have a trigger line breakout and the formation of a bullish change of character (CH).
When the price reaches the green zone, we can look for buy/long positions.
Targets are marked on the chart.
For risk management, please don't forget stop loss and capital management
Comment if you have any questions
Thank You

BankNifty levels - Jul 16, 2025Utilizing the support and resistance levels of BankNifty, along with the 5-minute timeframe candlesticks and VWAP, can enhance the precision of trade entries and exits on or near these levels. It is crucial to recognize that these levels are not static, and they undergo alterations as market dynamics evolve.
The dashed lines on the chart indicate the reaction levels, serving as additional points of significance. Furthermore, take note of the response at the levels of the High, Low, and Close values from the day prior.
We trust that this information proves valuable to you.
* If you found the idea appealing, kindly tap the Boost icon located below the chart. We encourage you to share your thoughts and comments regarding it.
Wishing you successful trading endeavors!
Nifty levels - Jul 16, 2025Nifty support and resistance levels are valuable tools for making informed trading decisions, specifically when combined with the analysis of 5-minute timeframe candlesticks and VWAP. By closely monitoring these levels and observing the price movements within this timeframe, traders can enhance the accuracy of their entry and exit points. It is important to bear in mind that support and resistance levels are not fixed, and they can change over time as market conditions evolve.
The dashed lines on the chart indicate the reaction levels, serving as additional points of significance to consider. Furthermore, take note of the response at the levels of the High, Low, and Close values from the day prior.
We hope you find this information beneficial in your trading endeavors.
* If you found the idea appealing, kindly tap the Boost icon located below the chart. We encourage you to share your thoughts and comments regarding it.
Wishing you success in your trading activities!
CRUDEOIL FUTURE - BULLISH VIEWCrudeoil just showed a reversal from 0.618 golden fibonnaci zone. It may go till 6000-6100 levels in coming weeks with 5700 as strong support.
please do your own research before taking any trades. This chart is only for educational purpose

Buy XAUUSD?Date: July 15, 2025
Pair: XAUUSD (Gold Spot)
Timeframe: 4H
Direction: Long
Entry: ~3,360
Stop Loss: ~3,327 (below sell-side liquidity)
Take Profit: ~3,492
RR Ratio: ~1:4
⸻
🔍 Market Context
• Price had been trending downward and then consolidated for several sessions.
• A sell-side liquidity sweep occurred just below 3,327 — taking out stops beneath local lows.
• Strong bullish reaction followed, forming a clean bullish order block and reclaiming structure.
⸻
🎯 Trade Rationale
• Sell-side liquidity taken → market structure shift → bullish BOS (break of structure).
• Bullish order block formed with clear mitigation.
• Small black-box consolidation likely a retest zone for low-risk entry.
• Targeting inefficiency toward 3,492, with a clean range above.
⸻
🧠 Trade Management Plan
• Move stop to breakeven at 3,375 once price clears local resistance.
• Consider partial TP at 3,420–3,450 to lock profit.
• Trail remainder to higher lows or use fib-based trailing stop.
⸻
😐 Emotional State Before Trade
Calm and focused. Recognized a textbook SMC entry — no rush or FOMO.
⸻
✅ Post-Trade Reflection (To Fill Later)
• ❓ Did price react to the zone as expected?
• ❓ Was entry execution precise (limit vs market)?
• ❓ Any slippage or management improvements?
• ❓ Was I patient enough?

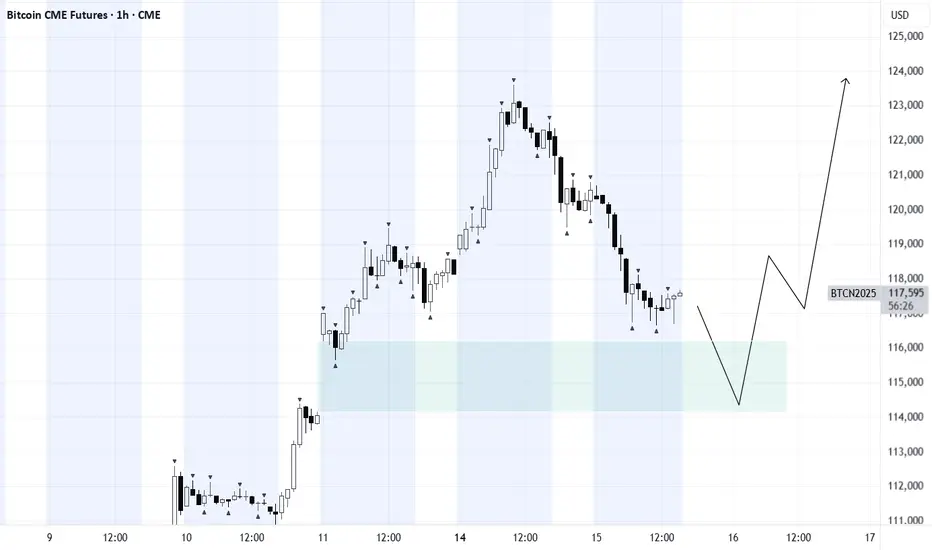
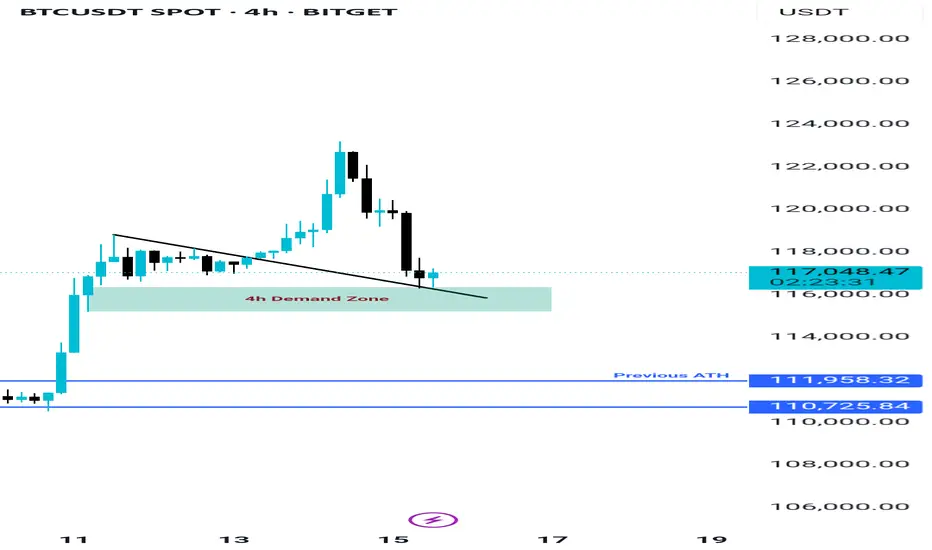
BTC still Holding the Demand Zone, Bitcoin is currently holding the demand zone between $116K and $117K, which also aligns with the retest area of a previously broken trendline—making this zone quite strong. If BTC manages to close above $117.8K on lower timeframes, we could see the beginning of a new uptrend targeting around $130K. However, if this zone fails due to any unexpected news or events, the next key support lies between $111K and $113K.
$HBAR Weekly Pivot Time...In classic CRYPTOCAP:HBAR fashion what a powerful move this week! Moves like this leave me skeptical of continuation straight away as you often get a pretty decent pullback afterwards before the next leg up. However how many times have you seen a move like this that completely unwinds weeks later and goes lower?
Wave (3) looks truly underway after wave (2) tested the High Volume Node and 'Golden Pocket' 0.50.618 Fibonacci retracement as support on weekly bullish divergence from the RSI.
The weekly pivot is now resistance and it already proving itself. If price continues the all time high is next resistance and price has a weekly R5 pivot target of $1.2 while the Fibonacci extension targets have a minimum of $5.2..
Analysis is invalidated below $0.12
Safe trading
