Supplyandemandzones

XAUUSD Potential Breakout TradeGold is about to break its range please place buy and sell order to take trade.
Manage your risk accordingly.

GBPUSD Potential Breakout Trade SetupGBPUSD breakout trade on either side, if broke resistance or support. Place TP and SL with buy stop and sell stop orders.

Surrender Bears! Accumulation above 26,747 ? 📽️Timeframes are closing above Weekly Zone 26,770. Unless during the next 22 hours we see a 1.22% dump below our weekly level , I'm Looking up from here.
Price has returned into our range from the second half of May between Daily Zone 27,400$ and 26,747$ Weekly Zone. Price printed a solid Bull candle rejecting our Weekly level which was anticipated. Price consolidated and dropped slightly during yesterday's daily candle. We haven't started dumping and price has been consolidating along the Highs of our Daily range from the Second half of Month May. The Highs during the Second half of May being 27,400$. As the New week begins I am looking for an Increase in Bitcoin as the debt ceiling controversy ends and the Summer begins. 29,246 Weekly Level is our target for the 1st half of June. Safe Trading.

⚖️ Auction Market Theory📍Auction Market Theory, developed by J. Peter Steidlmayer and expanded upon by Jim Dalton in his book Mind Over Markets, explains how financial markets function as auctions where buyers and sellers interact. The theory focuses on two main objectives: facilitating trade through a two-way auction process and determining the fair value of assets. Supply and demand dynamics and price discovery play a crucial role in this process. Auction Market Theory is represented using tools like Market or Volume Profile, which utilize bell-shaped curves to identify the value area, representing 68% or 1 standard deviation from the mean.
🔷 In a balanced market , buyers and sellers agree on prices based on their perception of fair value. This leads to lower volatility and prices that remain relatively stable, resulting in a ranging market. The fair value can be recognized using the Market or Volume profile, which appears as a Gaussian bell-shaped curve. However, financial markets rarely stay in balance indefinitely. New information, whether fundamental or technical, causes markets to move away from fair value and transition into a different environment.
🔷 Imbalance refers to the opposite of balance, where there is a disagreement about fair value. In this scenario, one side of market participants becomes more aggressive, leading to a trending market. Typically, markets tend to trend only about 20% of the time and range about 80% of the time. When the market is within the value range, it is more likely to remain in balance and explore within that range. However, in the case of an imbalance, the market often drifts higher or lower until it reaches a stop, typically within a previous value area.
💥Key Takeaways:
🔸 Auction Market Theory explains how financial markets function as auctions, focusing on facilitating trade and determining fair value.
🔸 Supply and demand dynamics and price discovery are essential in the Auction Market Theory process.
🔸 Tools like Market or Volume Profile use bell-shaped curves to identify the value area, representing 68% or 1 standard deviation from the mean.
🔸 In a balanced market, buyers and sellers agree on prices based on their perception of fair value, leading to lower volatility and a ranging market.
🔸 Financial markets rarely stay in balance indefinitely, as new information causes them to move away from fair value and transition into different environments.
🔸 Imbalance occurs when there is disagreement about fair value, leading to a trending market.
🔸 Markets tend to trend about 20% of the time and range about 80% of the time.
🔸 When the market is within the value range, it is likely to remain in balance and explore within that range.
🔸 Imbalanced markets often drift higher or lower until they reach a stop, usually within a previous value area.
👤 @AlgoBuddy
📅 Daily Ideas about market update, psychology & indicators
❤️ If you appreciate our work, please like, comment and follow ❤️

🔔ATORUSDT🔔💥The resistance range has been broken and it seems that it can make a move...
🔥Low market cap and high risk...
✌WOMAN , LIFE , FREEDOM✌

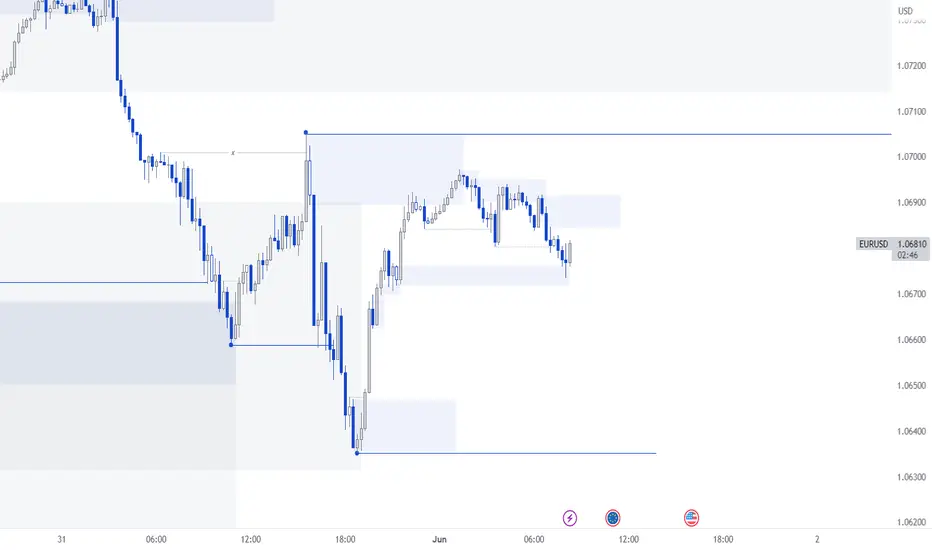
EURUSD | Supply and Demand | 1 JUN 23M15 Time Frame | LONDON OPEN | Market Structure | Supply and Demand POI | Liquidity
GBPAUD I Approaching supply zone where it may fallWelcome back! Let me know your thoughts in the comments!
** GBPAUD Analysis - Listen to video!
We recommend that you keep this pair on your watchlist and enter when the entry criteria of your strategy is met.
Please support this idea with a LIKE and COMMENT if you find it useful and Click "Follow" on our profile if you'd like these trade ideas delivered straight to your email in the future.
Thanks for your continued support!

S&P500 - WEEKLY PREVIEW | KW03 |In today's article, we will look at the *S&P500* and its relevant markers
for the coming week.
> KW 03 = 16.01. - 20.01.
> The marks should serve you as orientation for your own analysis.
> The "VIOLET" marked ZONES are TARGET RANGES - for possible trades.
! NOTE !
If financial events take place, there is a high probability that through market maker manipulation, the given marks are not respected .
> Every Monday, I therefore upload a FX event overview, the respective week, which gives you an insight of the "turbulent" days and times.
The cover picture shows an example of a possible trade .
> This is one of many possible setups and is not alone in the room.
ASSESSMENT
This week, the S&P500 will, with great probability, come up against a strong resistance.
As can be seen quite nicely from the daily perspective, a downtrend line resistance area is coming towards it. (Red lines + Red colored area).
> In addition, important Fibonacci levels and a 4-hour SUPPLY zone are untouched, which for a further upswing, must first be overcome.
> My target range for the upward movement is - 4,040 - 4,060 points - in this zone, strong resistance should be expected at the latest.
> Of course, this forecast must be supported by the USD (DXY), which would be the driver for a possible sell-off in the S&P500.
POSSIBLE MARKET SCENARIOS
> THESIS 1:
On Monday, we directly see a strong USD = S&P500 immediately sells off.
> THESIS 2:
On Monday, we continue to see a weakening USD = S&P500 will run into my "target range" and then bounce back.
> THESIS 3:
On Monday, we see by the new data of W2, another down sell in USD = S&P500 will run into my "target area", conquer it and run up to further spheres.
OUTZOOMED
"4 HOURS + DAY - INTERVAL"
"1 HOUR + 4 HOUR - INTERVAL"
ZOOMED IN
"4 HOURS + DAY - INTERVAL"
"1 HOUR + 4 HOUR - INTERVAL"
POSSIBLE SCENARIES
„4 HOUR – INTERVAL“
> Let's share our perspectives and views in the comments.
> Sharing your point of view allows each of us to improve.
If this idea and explanation has added value to you, I would be very happy to receive a review.
Thank you and happy trading!
ZIEL IST DIE AUTARKIE | THE GOAL IS SELF-SUFFICIENCY

EUR/CHF - LONG - ANALYSIS + EXPLANATIONThe "EUR/CHF" has been in a downtrend since March – 2021, and it is obvious that we can expect a trend reversal if necessary.
> The EUR is the base currency of the pair and has suffered greatly from the USD (DXY) appreciation.
> The CHF is generally seen as a security, which is why the EUR is losing out to them.
--> Once the USD (DXY) shows signs of corrective behavior, I personally expect a significant upswing.
= What this upswing might look like, I'll let you know in the following lines.
Table of contents
- 1st part = CURRENT STATE
- 2nd part = TARGET ZONE PROPERTIES
- 3rd part = CONCLUSION
PART ONE
Since the end of July until today, a formation has formed, which is also known as the "Head&Shoulders - pattern".
--> This is formed in the EUR/CHF "OVERCOME", which is usually ended with a "Bullish" breakout.
--> The neckline (breakout line) of the pattern, is located at the resistance line (gold-spiked), which has formed since March / 2020.
Thus, it can be concluded that if the pattern breaks out "successfully", we will also break the resistance line.
After the break of this resistance line, the following sequence of events would be possible:
1. SHORT-TERM TARGET = 1.618 FIB -> 0.98977
2. TEST = of the broken resistance -> conversion into support
3. TARGET = TARGET ZONE 1
SECOND PART
"TARGET ZONES" are drawn on the chart, all of which have "concentrated" resistance characteristics.
1. | TARGET ZONE | 0.99718 - 1.00000 | points
RESISTANCE - CHARACTERISTICS
- "MSB" (Market Structure Break) | March/2022 LL.
- "FIB" (Fibonacci) = 0.328s | Created March/2021 - September/2022
- "POI" (Point of interest) = 1.00000 | Psychologically important resistance level
- "MA" (Simple Moving Average) = 8-long | Monthly chart
- "ICHIMOKU CLOUD" = Conversion line | Weekly chart + Baseline | Monthly chart
- "VP" (Volume Profile) = GAP in the zone | Not much volume traded = little resistance.
2. | TARGET ZONE | 1.00879 - 1.01526 | points
RESISTANCE - CHARACTERISTICS
- "MSB" (market structure break) | HL of April/2022
- "FIB" (Fibonacci) = 0.618s + 0.65s | Created = May/2022 - September/2022
- "FIB" (Fibonacci) = 1.618s | Originated = 02/09/2022 - 26/09/2022
- "POI" (Point of interest) = 1.01000 | Psychologically important resistance
- "MA" (Simple Moving Average) = 50-length | weekly chart + 200-length | daily chart
- "ICHIMOKU CLOUD" = no resistance in the HTF (Higher time frame) time levels T / W / M
- "VP" (Volume Profile) = small volume | not much past traded volume = little resistance to the upside .
3. | TARGET ZONE | 1.02391 - 1.02791 | points
RESISTANCE - CHARACTERISTICS
- "RESISTANCE LINE" | Created September/2021 (4x touches).
- "FIB" (Fibonacci) = 0.75s + 0.786s | Created = May/2022 - September/2022
- "POI" (Point of interest) = 1.02500 | Psychologically important resistance level
- "SUPPLY ZONE" = | Monthly chart
- "ICHIMOKU CLOUD" = Cloud resistance | Weekly chart + Conversion line | Monthly chart
- "VP" (Volume Profile) = Strong Volume | Much Past Traded Volume = Major Resistance.
X. | POI ZONE | 1.03736 - 1.03936 | Points
RESISTANCE - CHARACTERISTICS
- "FIB" (Fibonacci) = 0.88s | Originated = May/2022 - September/2022
- "POI" (Point of interest) = 1,04000 | Psychologically important resistance
- "SUPPLY ZONES" = | Daily + Weekly chart
- "VP" (Volume Profile) = Strongest volume | Highest past traded volume concentration = Very large resistance.
- "MA" (Simple Moving Average) = 50-length | monthly chart.
- "ICHIMOKU CLOUD" = no resistance in HTF (Higher time frame) time levels T / W / M
4th | TARGET ZONE | 1.04839 - 1.05398 | points
RESISTANCE PROPERTIES
- "FIB" (Fibonacci) = 0.618s + 0.65s | Created March/2021 - September/2022
- "POI" (Point of interest) = 1.05000 | Psychologically important resistance level
- "MA" (Simple Moving Average) = 100-length | weekly chart + 50-length | monthly chart
- SUPPLY ZONES" = daily + weekly + monthly chart
- "VP" (Volume Profile) = GAP in the zone | Not much past traded volume = little resistance to the upside.
CONCLUSION
You now know what the scenario for "EUR/CHF" could look like.
The following conditions must be met:
- DXY (USD) starts to CORRECT = pressure way fall for the EUR -> EUR more dominant than CHF
- BREAKOUT of the H&S pattern
-> OVERCOME the resistance line + successful back-test
= transformation into a support line.
- DEVELOPMENT of the individual ZONES and their relevant resistance properties.
PS:
+ I have once taken the liberty to draw a possible "course", so you can see how it could run.
+ Many of the indicators described are not visible in the chart, so that a clear view remains.
-> Feel free to discuss it in the comments and share our perspectives, I'd be "burning" to hear your take on the whole thing.
If this idea and explanation has added value to you, I would be very happy to receive a review of it.
Thank you and happy trading!
For anyone who would still enjoy the other HTF and want to hide all the "noise" - following the weekly and monthly chart.

5/25: Market Recap, Outlook, and Trading PlanSPDR S&P 500 FUTURES ESM2023 & SPY ETF - Market Update - 5/25/23
Today's Recap
This week has been a mirror image of last week, with the ES building a smaller triangle and breaking down, triggering a nearly 100-point sell. Although this seems dramatic, similar dips have occurred in the past month and have been bought. The question now is whether this dip will also be bought.
Debt Ceiling Crisis
The current market environment is complex and headline-driven, with the debt ceiling debate making the next few days of trading potentially difficult. Traders need to be flexible and prepared to react to price movements, rather than trying to predict or forecast the market.
Bond Yield Rates
Bond yields have been fluctuating due to the uncertainty surrounding the debt ceiling crisis. This has led to increased volatility in the market, making it more challenging for traders to navigate.
Key Structures
The latest rally of this bull leg started because we broke out a triangle structure shown in blue below. It is currently at 4123-4116 and represents an important back-test, which we managed to defend.
The yellow rising channel connecting the May lows. This broke down yesterday. As always, when price breaks down any sort of significant level that level needs to be recovered in order to “end” the immediate move (down). Currently, this is 4165-75 and I would say a “bottom is in” when that is recovered.
While this is very far away - note the lowest white trendline. This connects the October low with the March low and is currently 3980. I consider this the driving trendline controlling the multi-month bull market we are currently in. We remain in a clear uptrend by every definable measure.
The Flat Bottom
You can see the flat bottom pattern failed to hold and triggered the sell-off at 4190.
The Yellow Uptrend Channel
The yellow uptrend channel, which connects the May lows, broke down yesterday. In order to end the immediate move down, the level of 4165-75 needs to be recovered.
Supports and resistances are listed, and I discuss potential bids and trade scenarios for both bull and bear cases. In summary, 4195-4220 is chop, and there is a heavy headline risk due to the debt ceiling.
Bulls control above the structure
Bears control below the structure
The back-test level is now 4140-42.
Support Levels
The bull case would look something like yesterday lows continue holding, and from there we push up the levels to 4147, 4156, then 4166-75 where ES can try another sell.
4123, 4116 (major), 4100-05 (major), 4087, 4075 (major), 4061, 4053 (major), 4040, 4020-25 (major), 4013, 4000 (major), 3977-83 (major).
Resistance Levels
Starts on the failure of yesterday’s low. Ideally, one more bounce attempt at 4116-23 before trying a short. After this bounce though, consider a short 4115 or so for a move to 4100-05 where gains should be locked in.
4135 (major), 4147, 4157, 4166 (major), 4175 (major), 4191-95 (major), 4204 (major), 4212, 4221 (major), 4235, 4242-45 (major), 4253, 4259, 4270-75 (major).
Trading Plan
If buying big red candles, these are “knife catch trades”. Size them down. 4123-4116 is major support still, one could bid it direct again or wait for a decisive failed breakdown. In terms of spots to try knife catches, 4100-05 and 4075 would be possible regions.
Wrap Up
In conclusion, the market is currently in a complex and headline-driven environment due to the debt ceiling crisis. Traders need to be flexible and prepared to react to price movements, rather than trying to predict or forecast the market. Keep an eye on key structures, support and resistance levels, and have a solid trading plan in place to navigate the market successfully.
Disclosure: This is not financial advice and is for informational purposes only. Please consult a professional financial advisor before making any investment decisions.

Riding the Bull: Are We Set to Rally Higher?SPDR S&P 500 FUTURES CME_MINI:ESM2023 & AMEX:SPY ETF - Evening Market Update - 10/18/23
Today's Recap
We saw a remarkable movement in ES over the past week. It was technical analysis at its finest: a 10-day tight range was followed by a breakout, just as the underlying trend suggested. As per historical trends, these range breakouts can lead to sustained rallies.
Key Structures
Several key structures have emerged that are worth watching:
The Week-Long Triangle Structure: This structure triggered the recent breakout. The market dynamics can be summarized as follows: bulls control above it, and bears control below it. The back-test level is now 4140-42.
The Purple Uptrend Channel: This structure, connecting the May 4th low and this week's low, is a crucial support area at around 4140-42. Bulls will want to hold this structure.
The Blue and White Broadening Formation: This structure has been a focus in our discussions. The white broadening formation resistance, at around 4197, was the target for weeks, and it broke out late today.
Support Levels
As long as 4147 holds, we continue our upward trajectory.
The 4140-42 area, derived from the triangle structure and the purple uptrend channel, is an obvious structure bulls want to hold.
4197, the previous resistance, has now turned into a support level.
4197-95 (major), 4182-85 (major), 4175, 4168, 4156 (major), 4140-42 (major - backtests the triangle breakout), 4135, 4126 (major - triangle support), 4114, 4106, 4092-95 (major - broadening formation support).
Resistance Levels
Initial resistance was at 4192, acting as a magnet, as previously identified.
According to the blue broadening formation, the next major resistance level is now at 4242.
4212, 4221 (major), 4235, 4243 (major), 4249, 4263 (major), 4270-72, 4277 (major), 4296, 4306 (major).
Trading Plan for Tomorrow
The plan for tomorrow is straightforward:
If the market remains above the key structures (4140-42), we should anticipate a continued upward trend toward the resistance at 4242.
However, if the market dips below these structures, it could signal a shift in control to bears.
Wrap Up
Stay patient and adhere to your trading plan. Follow the key structures, resistance, and support levels closely.
Disclosure: This is not financial advice and is for informational purposes only. Please consult a professional financial advisor before making any investment decisions.

Bulls Maintain Control as Market Holds Near Breakout LevelsThe market closed higher today. The move higher was driven by a number of factors, including stronger economic data and expectations that the Federal Reserve will not raise interest rates in June. However, the looking debt deadline is not in the review mirror yet.
Key Points
The market broke out from the tightest range seen since April 2017.
The next level of resistance for ES_F is at 4175. If ES_F can break above this level, it could open the door to further gains towards 4200.
The next major economic event for ES_F is the Federal Reserve's meeting on June 13-14. The Fed is not expected to raise interest rates.
Bull Case
As long as the 4155-47 breakout back-test area holds, bulls are in control. If it fails, bulls will want to recover quickly from 4135 support.
Generally though, as long as that backtest holds, bulls are in control and we likely chop, bull flag, then continue to push to 4195 megaphone resistance.
Possible pullback there then on to break the May highs.
In terms of spots to add on strength, I will be watching for bull flag formation.
We have the flag pole with todays rally, and the flagging would occur under 4178-80 and above 4166.
If this flag can develop overnight, I may consider buying it in the morning.
Bear Case
Several levels need to fail for there to be any short-able bear case.
The first warning, though is the 4147 breakout back-test.
4125 support needs to crack. However, a breakout short, perhaps 4122, to work down the levels to 4100 and lower.
Final Thoughts
The market is in a bullish trend, but it is important to be aware of the risks. The market could pull back in the coming days, especially if the debt ceiling isn’t raised, and it is important to be prepared for this possibility.
Disclosure: This is not financial advice and is for informational purposes only. Please consult a professional financial advisor before making any investment decisions.

After-Market Analysis: Patience in Play Amid ES_F's Narrow RangeWe witnessed a choppy session today, mainly pinned at 4135. The market fluctuated between 4155-4130, indicating the possibility of a breakout pushing up the levels to megaphone resistance. The bearish case will start with the failure of 4131.
Today's session was marked by a continued consolidation within a narrow range for ES_F. The market has been in a tight range for the past week, with closing prices consistently falling within 1% of the 4130 zone. This is one of the tightest consolidations we've seen in years, and it's a consequence of the May 4th/5th rally and the options expiry week.
We saw the ES_F put in a notable 6 daily candles stacked tightly side-by-side in approximately a 60-point range, likely the tightest range since the March or January lows. This could potentially be a trap for newer traders who are always seeking the rare "big home run move". Instead, the market seems to be tactically playing between levels, resulting in failed breakdowns to trap chasers.
Resistance Levels:
4127, 4135 (major), 4142, 4148, 4152 (major), 4166, 4173-75 (major), 4188-90 (megaphone resistance, major), 4197, 4205 (major), 4220 (major), 4232, 4240-42 (major - large broadening formation resistance), 4256, 4266, 4273-76 (major), 4282, 4290-92 (major), 4305 (major).
Support Levels:
4118 (major), 4111, 4100-4105 (major - broadening formation support), 4079-83 (major), 4070, 4057, 4040-44 (major - broadening formation support), 4025, 4020 (major), 3999, 3990 (major), 3967-72, 3956 (major).
Key Structures:
The small white broadening formation with support at 4105 and resistance at 4187-90.
The larger blue broadening formation pattern with support at 4040 and resistance around 4235.
The purple rising channel structure with support around 4136-31.
Bonds:
On the bond front, the yield on the 2-year, 10-year, and 30-year Treasuries showed a marginal increase today. This could be a significant factor to watch for in the coming days.
Trading Plan:
In the evening hours, I opened a short trade here at 4133 resistance. For any long positions, a sustained break above 4133-35 will be needed to trigger the upside once again. A false break will trigger back to downside support.
Final Thoughts:
In summary, while the market's current state might be frustrating for those seeking the "big move," it's crucial to remain patient and tactical. The market's gyrations test our resilience and adaptability as traders.
Disclosure: This is not financial advice and is for informational purposes only. Please consult a professional financial advisor before making any investment decisions.

GBPUSD short setupHey traders! Ok so here is what I'm looking at going into London session today...
GBPUSD reacted from origin supply on 15M. Confluence with 4H supply. I took a long trade into this zone yesterday, which hit TP pretty quickly (wish all trades were that easy haha).
Here and now...looking for shorts after a pullback into premium of this bearish drive and the last buy-to-sell prior to the impulsive move. My only hesitation is the resting buy-side liquidity above the recent highs. I would really like to see this liquidity taken out and then take a trade on lower TFs (1-5M) after a Change of Character or Break of Structure.
Target for my shorts is the bottom end of the 15M range at 1.24428. If we get there prior to a pullback into my point of interest, I will re-evaluate based on new structure.
Happy trading!

Litecoin - Scenarios To Watch 👀What's up, traders! In today's market breakdown, we're mapping out our latest levels to watch for on the Litecoin 1H chart.
Let's dive right in...
Ticker: LTCUSDT
Date: 05/12/23
Timeframe: 1H
Supply: 83.82-85.24 (1st red zone), 89.07-89.86 (2nd red zone)
Key zone: 81.41-82.00 (grey zone)
Demand: 75.18-77.74 (green zone), 65-67.58 (green zone)
Commentary:
LTCUSDT seems to be one of the few cryptos that have established a low on this move down and continues to respect demand down at these lows. This means it could be one of the tickers to play now that we have established new demand and supply levels.
Currently it seems to be respecting this ~82 level grey zone as supply but if this 75.18-77.74 demand holds up it is only a matter of time that this zone gets broken. There are a few trades we could target from here:
✅ Bullish Scenario 1: you want to see price pull back into the demand zone ~75.18-77.74 and buyers to emerge again for an upside move, possibly into ~81.41-82 key zone or higher into supply at ~83.82-85.24. This is the safer upside play.
✅ Bullish Scenario 2: you want to see price break above ~81.41-82 key (grey) zone, pull back to retest this zone and turn it into demand to catch a break and retest for a further upside move, potentially into supply at ~83.82-85.24.
✅ Bullish Scenario 3: you want to see price rally and break both this key (grey) zone and supply level at ~83.82-85.24, pull back to retest ~83.82-85.24 zone and turn it into demand to catch a break and retest for a further upside move potentially into next supply at ~89.07-89.86.
🟥 Bearish Scenario 1: you want to see price approach this key (grey) zone at ~81.41-82, sellers to regain control as they have done since Wednesday this week, and possibly catch a retest of this zone into demand at ~75.18-77.74 again. This will be the safer downside play if it sets up soon.
🟥 Bearish Scenario 2: you want to see approach supply at ~83.82-85.24, show weakness, possibly retest this zone and reject again for a move down into the grey zone or further down into demand.
🟥 Bearish Scenario 3: you want to see price break below demand at ~75.18-77.74, pull back up to retest and turn this zone into supply for further downside into March lows. There is a demand zone at ~65-67.58 so be cautious of that.
That's all we got for you in this one.
So what do you think? Are you bullish or bearish?
Let us know in the comments below!
We'll see you in the next one.
-The AlgoBuddy Team

April's CPI Surprise: Can Bulls Charge Forward For Now?SPDR S&P 500 FUTURES ( CME_MINI:ESM2023 ) & ETF ( AMEX:SPY ) - Market Update - 10/10/23
The April Consumer Price Index (CPI) report showed a 0.4% increase last month, driven by rising shelter, used vehicle, and gas prices. This increase met Wall Street expectations, and the annual inflation rate of 4.9% came in slightly below estimates, providing hope for a lower trend. For workers, real average hourly earnings, adjusted for inflation, rose 0.1% for the month but were still down 0.5% from a year ago. These CPI figures provided a stick save for ES_F.
A massive 60-point range started with a failed breakout at 4176, and ES_F tested the overnight low, flushing to the 4114 support level. An intraday bull flag formed at the 4118-4123 support zone, with bulls getting long at the 4129-4134 range. A broadening formation (megaphone) pattern emerged at 4114, with resistance at 4176-4180. The rising uptrend channel from the March 2023 low is highlighted in yellow, establishing new support at 4134.
Bull Case:
On any pullback, look for re-entry to go long at the 4145-4146 level. If we move above 4145, the new magnet zone is 4176-4181. The 4166 support level is also a good magnet.
Bear Case:
On any pullback, look for re-entry to go short below 4134.
Economic Factors:
Keep an eye on the PPI-Final Demand and Jobless Claims data released at 8:30AM (EST) today.
Bonds:
The US10Y supports the bull case on the 4-hour chart with a new lower low. A symmetrical triangle pattern with a 5-day rising support range is visible, extending from 3.0308% to 3.311%.
Support Levels:
4134-32 (major), 4122, 4114-16 (major), 4111, 4105, 4092, 4082-78 (major), 4061, 4048 (major - broadening formation support), 4037, 4020-22 (major), 4011 (major), 3997, 3984 (major), 3978, 3952 (major), 3942, 3935 (major), 3904 (major), 3892 (major)
Resistance Levels:
4146 (major), 4154, 4166, 4176-81 (major, broadening formation support), 4188-92 (major), 4200, 4210, 4218-20 (major), 4230 (major - broadening formation support), 4243-46 (major), 4256
Final Thoughts:
As the market continues to digest April's CPI surprise, traders should remain vigilant and watch key support and resistance levels. The bull case still has potential, but it is crucial to monitor economic factors, such as PPI-Final Demand and Jobless Claims data, as well as bond market developments.
Not Investment Advice:
Please note that the information and strategies shared in this newsletter are for informational and educational purposes only. They should not be considered investment advice, nor should they be used as a basis for making any investment decisions. Always consult a financial professional before making any investment decisions, and ensure you understand the risks involved in trading and investing.

Spot the Shift: Is Market Compression Leading to Big Move?SPDR S&P 500 FUTURES ( CME_MINI:ESM2023 ) & ETF ( AMEX:SPY ) - Market Update - 10/12/23
The trading session was a showcase of failed breakdowns. This reaffirmed that most local lows and highs are set with these failures. A key takeaway is that more trading doesn’t necessarily lead to more profits. The strategy that has proved most profitable is consistently stacking level-to-level gains and then getting out.
As we've observed nearly every day since March, we're in a “buy dips regime” technically. This perspective has simplified trading for the past two months, as every 1-2 day dip has been bought. This past week, after a robust 100+ point vertical rally, the market has entered a consolidation phase, building a range with resistance at 4165 and support at around 4115. This range consolidation led to one of the tightest range weeks of 2023, with four daily candles stacking side by side.
Market observers and traders are anticipating a big trend move due to the current compression in the market, which is likely to lead to expansion.
In recent weeks, it has been crucial to trade from level to level, making terms like “bullish” or “bearish” less relevant for short-term traders. We've been in a 1.5 month consolidation within a strong bull trend, rallying 350 points from March 13th to mid-April and consolidating ever since. Current support and resistance levels lie at 4045 and 4230, respectively.
Bull Case
Holding key support levels is required for the bull case, with the potential for a breakout if these are maintained.
Bear Case
The bear case requires a fail of 4123-21, indicating potential for shorts. We are currently in a very tight, tactical range with low predictability.
Economic Factors
Turning our attention to economic factors, the producer price index, a measure of prices for final demand goods and services, increased 0.2%, which was less than the Dow Jones estimate for 0.3%. The headline PPI rose just 2.3%, down from 2.7% in March, marking the lowest reading since January 2021.
Bonds
In bond markets, U.S. Treasury yields were mixed on Thursday, as a report on wholesale prices confirmed inflation was slowing. The yield on the 10-year Treasury decreased 4.7 basis points at 3.392%, while the 2-year Treasury traded less than 1 basis point higher at 3.908%.
Support Levels:
4134, 4121-4123, 4114 (broadening formation), 4106, 4090, 4078-82 (major), 4061 (major), 4040-45 (major), 4034, 4015-20 (major), 4010, 3980-83 (major)
Resistance Levels:
4145 (major), 4153 (major), 4166, 4174, 4179-81 (major), 4190-93, 4200, 4209, 4218, 4225 (major), 4233 (broadening formation), 4243, 4250, 4262, 4275 (major)
Final Thoughts
Remember, more trading does not necessarily equate to more profits. Instead, a strategic approach—methodically stacking gains from level to level and knowing when to exit—will prove to be more profitable.
We must always stay vigilant, adaptable, and patient in this dynamic market. We'll continue to provide regular updates and strategies to help you navigate these waters.
Not Investment Advice:
Please note that the information and strategies shared in this newsletter are for informational and educational purposes only. They should not be considered investment advice, nor should they be used as a basis for making any investment decisions. Always consult a financial professional before making any investment decisions, and ensure you understand the risks involved in trading and investing.

$NU - Uptrend Commencing+14.73% MoM at the moment of editing. But more important than this percentual gain is what this candle represents.
This market had been ranging between the $3.5 & $5.5 thresholds for the past 12 months after a brutal sell off.
This month, after a shy breakout above the 10 EMA (M), this market is trading close to $6, with that proud green candle breaking above the above mentioned resistance threshold, making new high highs and announcing what could be the start of an uptrend.
Noteworthy is the fact that we are barely in the equator or the month, the time frame used for this analysis ... It goes without saying that we need a closed candle in order to draw firmer conclusions.
No less important, despite the curiosity triggered by this breakout, a careful examination of this market tells us that it has heavy overhead supply and also that the upcoming logical target (zone where the odds of the bears stepping in this market increase),entails that a bullish swing trade would have a poor risk to reward ratio ... if of course we place our stop loss in a logical place as well (below the $5.50 threshold - as previous resistance and new support, always with sufficient buffer).
Having this said, now comes the moment when I alert you for the complexity of the world and the financial markets. No Nobel prize, prime trader, financial institution or whatsoever, knows what's going to happen tomorrow. This is a game of probabilities and risk management. If your trade has 60% odds of succeeding (which are actually very good odds), it still means that you ought to expect 4 losses out of every 10 trades in the long run. 4 out of 10 are still pretty significant numbers. Can you really afford to place a bulky share of your capital at this risk? You need to stay alive to allow the good side of the odds to help you out here. So manage risk at all costs and make it your priority.
Cheers,
Tenacious Tribe - Backtested Trading Strategies & Studies
50% discount on all of our products, in our web, with the following code:
MOX Q3C WXRX

Profit in Both Bull and Bear MarketsThe EURUSD demonstrates a clear bullish trend based on the current market conditions. As a result, trend traders may seek to capitalize on potential buying opportunities at the support level of 1.0967.
Conversely, counter-trend traders may be interested in shorting the currency pair at the resistance level of 1.1035-1.1044 while placing initial stop-loss orders above 1.1067 to minimise risk. With a well-defined plan, traders can confidently approach the market from either direction and potentially reap substantial profits.

USDJPY continuation bullish?USDJPY has been bullish for quite some time, in the 15m chart the price just tapped into a supply zone with imbalance with sell side liquidity taken. Looking for a new higher high.

USDCAD LongIt appears we have a liquidity grab with the false breakout with the recent break of structure. We are looking for price to make a strong push to the target supply zone.

Supply and Demand 101 📚 OKXIDEAS📌 1- Introduction
To understand trading supply and demand, let's consider a simplified example. Imagine I typically purchase a specific brand of rice for $ 5 per bag. However, one day, while shopping, I discover that the price of this rice bag has increased to $ 7.
While I could afford the extra $ 2, I'm accustomed to paying $ 5 and prefer not to pay more if possible. So, I begin to search for an alternative brand of rice that costs $ 5. This behavior is common among consumers, and many others would likely do the same thing in this situation.
As time passes, the rice company notices that sales are decreasing, prompting them to reduce prices to move their inventory. Eventually, the bag of rice is back to HKEX:5 , and consumers begin purchasing it again.
In this example, HKEX:5 represents demand. The same principle applies to supply and is relevant in trading, where instruments such as BTC, APPL, USD are involved.
📌 2- Supply and Demand
Supply and demand is a trading and price action concept that analyses how financial markets move and how buyers and sellers drive the price.
On every price chart, there are certain price points where you can observe a sudden shift between the buyers and the sellers.
Those areas are usually characterized by strong and immediate turning points, or an explosive breakout. We as traders call those areas supply and demand zones.
The fundamental concept is to identify points on a chart where the price has experienced a significant increase or decrease. A demand zone is marked when the price experiences a strong advance, and a supply zone is marked when the market has undergone a sharp decline. This principle is based on the mass psychology behind supply and demand, as exemplified by the bag of rice analogy.
For instance, a trader may observe a significant bullish candle, but they may have missed out on the big move, causing them distress. Consequently, they are unlikely to buy now, believing the price is too high. Instead, they may wait for the price to retest the area where the aggressive upward movement began to identify buying opportunities where they perceive the price to be reasonable.
As a result, this area becomes a demand zone as many traders are awaiting its retest to purchase.
📌 3- There are four key areas of interest on the charts to look for:
The drop base rally, or ‘DBR’.
The rally base drop, or ‘RBD’.
The rally base rally, or ‘RBR’.
The drop base drop, or ‘DBD’.
A 'DBR' demand zone is typically indicative of a market bottom. Initially, the price is trending downwards until it begins to bottom out or base, then reverses its course to the upside.
Similarly, an 'RBD' supply zone is formed in the same way as the 'DBR' formation, but instead of a market bottom, this pattern creates a market top before reversing to the downside.
A 'RBR' demand zone typically emerges during an uptrend. The price starts with an upward movement, followed by a consolidation phase or base, and finally, a continuation move to the upside.
On the other hand, a 'DBD' supply zone is essentially the same formation as a 'RBR' area but occurs within a downtrend. The price begins with a decline, enters into a consolidation phase, and is followed by a continuation move to the downside.
Identifying these demand and supply zones can help traders in determining potential trading opportunities.
Now that we have a basic idea of what to look for, here’s how the noted zones above look on a live chart. OKX:ETHUSDT OKXIDEAS
📌 4- Characteristics Of a Strong Zone
a- Momentum from the zone
OKX:OKBUSDT OKXIDEAS
One of the fundamental rules to trading supply and demand is “The stronger the move away from a zone the higher the chance the market has of having a strong move away when it eventually returns”
b- Time Spent Away From Zone
OKX:OKBUSDT OKXIDEAS
It doesn't seem logical that an old zone still contains orders to buy or sell within it. Let's consider a supply zone that is four years old and the market has not returned to it yet. Is it plausible that traders still have a pending order to sell around it?
The strength of a supply or demand zone is defined by the amount of time the market has spent away from it. The more quickly the market returns to a supply or demand zone, the higher the probability of a successful trade.
Usually, older zones do not work out frequently. Therefore, it is better to concentrate only on the recently created zones.
In the above example, the last demand zone is still fresh, the more time passes, the weaker it becomes.
📌 5- Difference Between Supply & Demand and Support & Resistance
OKX:XRPUSDT OKXIDEAS
The concept of support and resistance is based on the idea that a line or area that has been tested multiple times in the past and prevented the price from moving beyond it is considered significant.
On the other hand, when it comes to supply and demand, we are interested in finding areas with a strong, recent, and untested movement, rather than areas that have been repeatedly tested and held strong.
Sometimes, just like the above XRP example, it happens that we have got a demand zone (blue) around a support zone (red) but it doesn't mean that they are the same.
📌 6- How to trade Supply and Demand
There are plenty of methods one can use to enhance the probability of a zone holding firm. Each individual is different and will, therefore, rarely look at the charts the same way.
Some traders, like myself, prefer to confirm these zones using other technical tools, while others prefer to simply trade the zones naked.
OKX:XRPUSDT OKXIDEAS
As per my trading style, I only locate supply/demand zones on higher timeframes. And as price approaches the supply/demand, I zoom in to lower timeframes to look for sell/buy setups for extra confirmation.
7- Conclusion
Traders, especially amateurs, are usually fascinated by supply and demand because they want to catch the exact price tops or bottoms. However, supply and demand is not foolproof and definitely not the Holy Grail.
Supply and demand zones are not a stand-alone strategy but act as extra confluence for an existing potential setup.
Remember:
Higher-timeframe areas are more reliable.
Trading the first time back to a zone is the highest probability trading setup.
I have shared my personal thoughts about Supply and Demand, however it is your job as a trader to find what works for you.
Let me know if you find this post useful, and what which topic would you like me to cover next 🙏
📚 Always follow your trading plan regarding entry, risk management, and trade management.
Good luck!
All Strategies Are Good; If Managed Properly!
~Richard
Disclaimer: The information provided is for educational and informational purposes only and should not be considered as financial advice. It is important to do your own research and make informed decisions before entering any trades. Past performance is not indicative of future results. Always be aware of the potential for losses, and never risk more than you can afford to lose.
