Morning Update- The Yens For The WinI don't have much to say about this week's trading except, glad it went the way it did and CPI data helped price move this week.
I took advantage of a few Japanese Yen trades. My hopes is that you did too. In my humble opinion, they moved better to me than most currency pairs did.
So, yay! It's the Yen's for the win!
Now to update.
Most Yen pairs made new lows. This is the best time to update your charts to find an opportunity to possible sell again, if your strategy meshes with the recent movement of course.
I'd love to see fullbacks via the daily timeframe before I enter another longterm swing again, but thats just me.
Be well. Happy Friday. Enjoy your weekend.
I'll see you all Sunday night at 8:00 pm EST. for another live stream.
-Shaquan
Supplyandemandzones

GJ - Waiting.. Ignore the first 4 seconds.. 🤣Getting used to this recording tool, its super fun! (Didn't realize it was recording for the first 7 seconds) 🤣
Here's what im looking at on GJ today, let me know your thoughts!

IntradayAnalaysis are based on Supply and Demand methodology and Price Action. Are we going to see bullish USD against SA Rand? No prediction just reacting

btcusdtperpHi my friends
From my point of view, the market moves in this way and after this drop, we will enter the accumulation phase

Possible SPY Long opportunity from smart money Please read the chart text. Furthermore we are in a box that has proved there are lots of bulls at this area hence the previous rally at this zone. Could this be the Santa rally everyone is talking about to save spy? We can hope for smart money to re-enter longs here to boost spy back up towards the top of this range otherwise, I fear spy may drop slowly into 360's or lower. There is also a chance that spy just trends sideways and ranges more into the new year. What do you guys think is brewing?

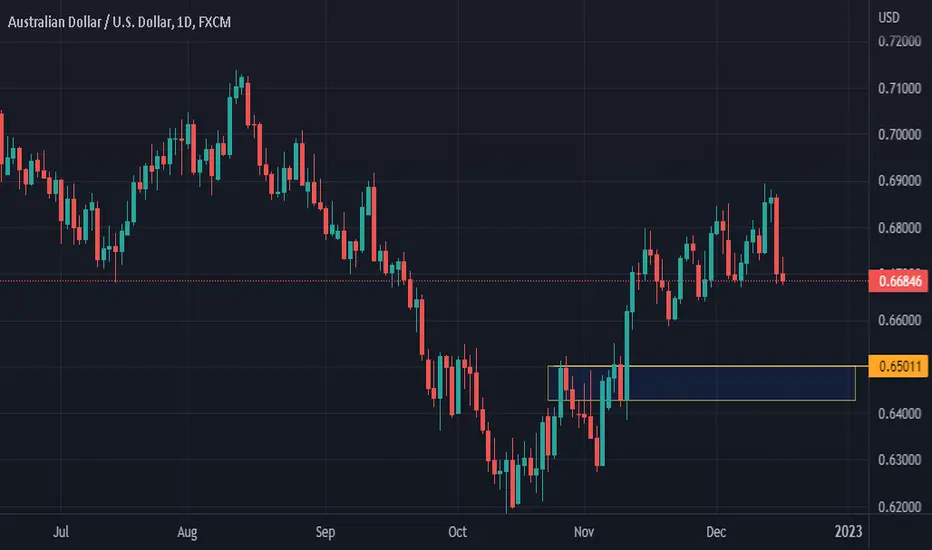
AUDUSD BUY @ Yellow price lineSupply and demand strategy.
Buy at yellow price line shown on chart.
Enter take profit for 50 pips.
Let me know how it worked for you.
S&P 500 Analysis and Trade IdeaInteresting. Loads of news coming! CPI, FOMC, and interest rate decisions for CHF, GBP and EUR.
I will wait until I see how the CPI data turns out before jumping in this market for trades.. especially for any buys.
I do, however, see that *support * differently... as I am tentatively bearish in this market.
D1:
1 - A bearish break of of Swing structure. Confirms the market is bearish until the high is taken out.
2 - The return to the impulsing order block. This is the expected pullback correction after a BOS.
This D1 supply zone was in the premium of the trading range, imbalanced and unmitigated, and price reacted
to it perfectly (see last weeks Sunday livestream). It also broke the daily uptrend line.
3* - This is no doubt going to look to some as price finding support for a move up. But it is sell side
liquidity, looking thru the lens of SMC. I expect those lows to be swept, as there are SLs there for the
traders that took longs from those levels.
4 - This is a well placed imbalance/fair value gap that looks to be filled ... potentially... as price moves to
mitigate the demand zone that formed that gap.
5 - This demand zone has potential to hold price once mitigated. So any shorts taken from up higher
into it should TP in this area, imo.
Personally, I will be looking for confirmations to take a long from here. We'll see how price reacts
to this poi firs, though.
If you like this analysis and would like to see more, give this post a BOOST with thumbs up!
Like & Subscribe is the best thank you in the world!
Trade safely.

Waiting...GBPUSD - I might take some LTF scalps up towards the 50% if we create structure above the current DH, but mainly im looking to see how price reacts to the 50%/4H BOS level, if price gets on top of this it will continue back up towards the 1.23238 resistance level, if we reject at the 50% i'll be looking for price to take out the current DL $ before looking for reversals inside the Daily demand zone.
Let me know your thoughts!

DXY – TRADES | MTF ANALYSE | KW48In today's post I present relevant marks of the DXY for the next week, which could support the one or the other, in their own analysis.
= the technical analysis approaches, are shown in individual images in the post. So that an individual interpretation of the respective - standing alone - is possible.
= the title picture shows an example, of a possible trade. This is one of many possible setups because the current course isn`t able to take a clear direction.
PERSONAL ASSESSMENT
If you look at the price in the higher time frames, you can quickly see that "without" another correction, we have been in free fall.
Thus, an intermediate correction in the smaller time frames is long overdue and could possibly await us next week, with a rising USD / DXY.
This just announces itself with a MACD divergence, in the small-time units. This does not mean that the price must immediately react to it, however, over the next few days after a possible small sell-off, the whole thing can run in the opposite direction.
Why this is so, I explain to you in the following.
MARKET MAKERS MOVE THE PRICE .
The DXY has been in correction for 2-months and many market participants assume a further USD value decline.
And exactly there is the existing problem,
-> "many market participants" are on the USD short side.
If you look a little bit into the TRADING of the HEDGE funds and banks, you will quickly come to the conclusion that without their participation, the market will not move.
1. from the moment the price moves permanently in one direction, it is no longer interesting for large investors.
2. their opportunities to make money are very small, which is why they have to reverse the market direction or initiate a consolidation.
This in turn is due to the following reasons:
- The position sizes of these investors are too large to be executed in a normal market environment.
- For this reason, you can e.g. only build LONG positions if enough investors sell to you = go SHORT.
- Thus, when the market falls, they can build a LONG position piece by piece, without having a "visible" influence on the market.
Then, when you decide that their position size has been successfully filled, let the price go in the opposite direction.
- During the e.g. upward movement, profits are then taken piece by piece where liquidity is highest so that the market does not break away again after these profit-takings.
So that you are prepared for both scenarios (LONG / SHORT), I have carried out the analysis combined with the different time units (monthly, weekly, daily and INTRA-Day) and in the following with chart images.
The following methods are used and shown below:
- MULTI TIME FRAME ANALYSIS
- TREND LINES + TREND CHANNELS
- SUPPLY&DEMAND ZONES
- FIBONACCI LEVEL
- MACD
MONTHLY TIME FRAME
WEEKLY WINDOW
DAY WINDOW
INNER DAY TIME WINDOW
4h + LONG
4h + SHORT
1h
4h Divergence - MACD - Intraday
> Feel free to discuss this in the comments and share our perspectives, I would be "burning" to hear your take on the whole thing.
If this idea and explanation has added value to you, I would be very happy to receive a review of it.
Thank you and happy trading!

CADJPY 1W Supply & Demand ZonesThe chart shows supply and zones in 1W time frame. It is necessary to take risk aversions, which can push this pare into next demand zone, into consideration

GBPCAD Looking for a CorrectionGBPCAD show a strong bear movement we expect a correction and mitigate a fresh the demand area


A Quick Short for GBPJPYGBPJPY is looking to mitigated a supply area in near 168.9xx and I expect the priced will react to at least fibo 50.

Waiting...Gold - still super bullish, looking to take buys if we can make structure/candle close above the 1796.300 level or if that level fails will wait until price hits the buy zone to look for more buy opportunities! I wont be looking for sells until we either break the buy zone or reject 1807!
Let me know your thoughts!

GODMODE scripts: Anchor Zones, Supply/Demand FischerMTFFischerTransform MTF with dip buy signal
AnchorZones great for range
Supply demand perhaps levels that will get revisited, verify with Volume profile VAH VAL


Looking at buys if 33500 holds 👀US30 - Daily candle failed to close below previous daily low (Could be a sign of a potential fake move to the down side before price heads back to the highs, i'll be keeping my eyes on this 33500 demand zone (Also sitting on strong support) I'll be looking for buys here until we get a solid break and retest of yesterdays low, lets see... 👀
Let me know your thoughts!

BTCUSDT local bullish until the supply?
The price is testing the resistance on the 4h timeframe and now the market is trying to create a new higher high
How to approach it?
IF the price is going to have a breakout, According to Plancton's strategy , we can set a nice order
–––––
Keep in mind.
🟣 Purple structure -> Monthly structure.
🔴 Red structure -> Weekly structure.
🔵 Blue structure -> Daily structure.
🟡 Yellow structure -> 4h structure.
⚫️ black structure -> <= 1h structure.
–––––
Follow the Shrimp 🦐

⚡Buy the Chiliz (CHZ) and earn +700 pips🎁🔰You can see the Chiliz crypto analysis in the 2-hour time frame (CHZUSDT_ 2H) 🔍🧨
💥Considering that the price has been able to break the Down trend line🖤 and make a pullback💜 to it once, and the price is near the DEMAND zone, there is a possibility of the price rising to the SUPPLY zone🔺🚀
Do you think this analysis can be profitable🧐❓
I hope the analysis was useful for you🤍🌹
_______📈TRADER STREET📉________

GOLD WEEKLY ANALYSIS (Nov 21 - 25)Looking at Gold price action it broke out of a daily major downward trendline together with daily support. It rallied up and currently it is now retracing, here short term sells will be facilitated. As seen by the grey supply and demand zones we expect Gold to retest the previous zone it broke through as it has not re-tested this zone yet. Just below this zone also happens to be a 38.2 fib retracement level which will be a safe spot to put SL below as we ultimately place long term buys to ride Gold all the way up to previous high.

CADJPY Sell !The pair got pushed down from the 103.412 pivot line and is now also done with the restest ready to move all the way down to its next Target 101.379 !!
The move is further strengthened by 50 and 200 EMAs pointing down on the daily and 4-H timeframe !
My final Traget for the pair is 101.4 !

US30 Favoring Buys until PRZ is broken!Price sitting at the demand level that created the BOS, i'm favoring buys here until we get a solid break/candle close below the PRZ then i'll look for retests and short opportunities down towards the DL!
Let me know your thoughts!

btcusdtperpAs I posted in the previous analysis, the price reacted well to the desired level. If you want to see analysis and updates, please follow and like.
The same target is still in place
I will update if it changes
