XAU/USDMarked this on the 4hr timeframe.
I seen that it reversed off the demand zone and also that there's 2 supply zones that have yet to be retested.
Price took out the trendline liquidity and is now headed toward the first zone. I think it could push through and head towards the 2000.00 zone. I wont be looking to trade unless I see the confirmation of course, but this is what I'm thinking.
Comment what you guys think or if you have something different.
Supplyandemandzones

XAGUSD SILVER Supply And Demand AnalysisSee picture for top-down analysis:
-Short Term Downward ML Break
-opposing zones removed
-People might think it's a great demand setup
which I agree but taking a look at the overall
price action over the last 7 days, you can see
price is making overall LL/LH by about .6%
-If someone bought at this demand then using a
structure SL is recommended.
-Low risk reward but higher probability for a 1:1 or
0.5:1 R:R.
-NO TRADE FOR ME

Potential Butterfly 🦋 US30 - Price is currently in a strong demand zone but looks like its going to break the DL and continue down to the D point of the butterfly (The next demand zone).
I will be looking for reversals in this current zone, but with todays sell off in the stock market im not to hopeful, price just keeps smashing through demand zones with very little pullback, lots of fakeouts today.
Let me know your thoughts!
* Disclaimer **
These ideas I never trade until the end target with my initial lots, I focused on high probable entries with higher lots and use a specific partial taking strategy giving me a very high win rate and take most of my profits very early, I only leave a small % of my capital to run the entire trade. On the flip side im constantly monitoring LTF momentum and will close early if things change, these analysis's are for research purposes only.

APEUSDT m15 - 06/04/2022This is my point of view on Ape. It will likely make a mini-explosion in the next few m15 candles

Potential Shark Forming 🦈🦈US30 - Trading with HTF PA, looking for this demand level to hold and to complete the Shark, we have LTF confirmation for buys, hopefully this level will take us up to the D point!
Let me know your thoughts!
* Disclaimer **
These ideas I never trade until the end target with my initial lots, I focused on high probable entries with higher lots and use a specific partial taking strategy giving me a very high win rate and take most of my profits very early, I only leave a small % of my capital to run the entire trade. On the flip side im constantly monitoring LTF momentum and will close early if things change, these analysis's are for research purposes only.

Shark Almost Complete 🦈NAS100 - Nice 4H Shark almost complete, looking for a push up-to the next strong supply zone with a D point completion landing on a very nice imbalance fill/OB, could get a small pullback first but structure overall is bullish, looking very good for buys!
Let me know your thoughts!
* Disclaimer **
These ideas I never trade until the end target with my initial lots, I focused on high probable entries with higher lots and use a specific partial taking strategy giving me a very high win rate and take most of my profits very early, I only leave a small % of my capital to run the entire trade. On the flip side im constantly monitoring LTF momentum and will close early if things change, these analysis's are for research purposes only.

US30 Sell SetupI am looking to sell US30 but would like for price to push up into the 1h SZ as it clears liquidity above the current market price.

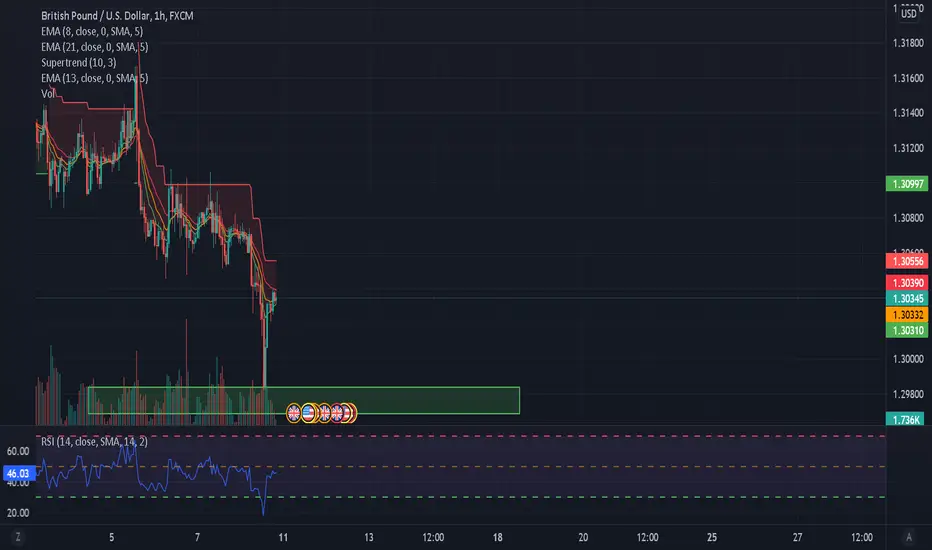
GbpUsd Weekly forex market analysis with forex trading strategyGbpUsd Weekly forex market analysis with forex trading strategy from 4th April,2022.
Fundamentally, the NFP released reports have shown that the number of jobs added to the US economy was lower than expected, even though the unemployment rate was lower than forecasted, hourly wages did not increase. Prior to the NFP,
the US GDP reports for the 4th quarter shows a lower than expected figure with initial jobless claims reports higher than expected.
From the UK, GDP reports for the 4th quarter shows a higher than expected figure . expected figure.
Fundamentals to keep an eye on the coming week include the US trade balance, euro retail sales...
Technically, price recently made an up thrust off a weekly retested demand zone after which a bearish week followed and currently price is reacting to a demand zone from the monthly time frame.
zone.
GbpUsd is close to the daily demand, I will be watching the area for confirmation to buy the Gbpusd .A full video and more detailed analysis with education was shared on my YT channel. 🦾
Let us go take some risks, let us go make some money.

POTENTIAL SELL ON AUDNZDPrice has potential for the downside from this retest of the current sell zone, wait for lower timeframe bearish price action to confirm the move.

NZDCAD ANALYSISNZDCAD trading in uptrend
price rebounded from uptrend line and 61.8% fib level
price above SMA 100
price above key level around 0.8720
RSI above 50
so it's expected bullish movement to resistance level; around 0.8900

SUPPLY vs DEMAND 📉📉📉✅1) Use longer time frames to identify supply and demand zones
By zooming out, traders are able to get a better view of areas where price had bounced off previously. Be sure to use the appropriate charts when altering the between multiple time frames. Draw a rectangular shape to denote this zone. Demand and supply zones do not necessarily have to appear together - often currency pairs can reveal one or the other.
✅ 2) Identify strong moves off the potential demand/supply zone
Certain price levels offer value to either bullish or bearish traders. Once institutional traders and big banks see this value, they will look to capitalize on it. As a result, price action tends to accelerate relatively quickly until the value has diminished or has been fully realized. Witnessing multiple instances of this at the same price level increases the probability that it is an area of value and therefore, a supply or demand zone.
✅ 3) Use indicators for confirmation of support and demand zones
Traders can incorporate daily or weekly pivot points to identify or confirm supply or demand zones. At DailyFX, we have a dedicated page showing relevant support and resistance levels for all major markets. Traders should look for support and resistance levels to line up with demand and supply zones for higher probability trades.
🏦 Often, a currency pair will climb to an area of resistance called a ‘selling zone’, where sellers perceive there to be great selling potential at a relatively overbought price. The reverse is also true for currency pairs that drop to relatively low levels, ‘demand zone’ where buyers perceive there to be great value to buy.
If you haven’t learned the basics of the supply and demand, or would like a refresher, read our guide on the forces of supply and demand.
🏦 Supply and demand zones are observable areas on a chart where price has approached many times in the past. Unlike lines of support and resistance, these resemble zones more closely than precise lines. Traders can customize charts to identify the demand and supply zones
Do you use this concept ? 🔥

EURGBP Can She Still Push Down?Hi Purpose Traders: Flow with me a bit while I give you the tea on EURGBP.
First, price is in a downtrend. Can you see the lower low and lower highs she is making on the weekly and daily? If yes awesome! If not, take a look at my price note tools. The exchange rates are decreasing at the highest peak lowest peak of each fluctuation.
What does this mean for you? I'm so glad you asked! A downtrend means you are the seller. I love teaching traders to trade what they speak and see. The word 'down" in downtrend means price is decreasing. The word decreasing means price is selling. The word selling means you are the seller. See how that came together?
For you, you want to sell beneath the last lower high at exchange rate 0.84780. I'm using my estimation zone(my name for my zone based on the low demand of buyers under the lower high). If today's candle closes bearish I am the seller back down to the low at 0.82030.
What can stop me from selling? If price passes 0.84780 and it is that simple. Why? I'm glad you asked. If price passes the last lower high that will mean price has reversed and it's time to be the buyer, but I'll only cross that road if price says to do so.
So, what do you think? Do you agree? Let's chat about it.

Shout AUDCHFAUDCHF is just slightly over a zone.
There is great obstacle of sellers volume here.
Try to sell from there.

USDCHF ANALYSISUSDCHF rebounded from the demand zone around 0.9160
price above key level around 0.9200
price above SMA 100
MACD shows bullish momentum
so its expected bullish movement to resistance level around 0.9420

STAY ALERT ! on Pullback / Reversal or Continuations Gold has been continuously spiking up since the best Volatile week
Potentially on double top before it makes a Pull Back to Demand Area H4 & D1
Perhaps will make some breakthrough on the following trend
KL is prepared to be fill
Disclaimer :
This is not a signal's
Education purposes only
Trading with real money at your own risk

The Perfect Way To Create Your WatchlistIf you have been struggling with what to trade and how to know when it's time for you to enter a trade, look no further. In this video, I will be showing you how to create a Forex watchlist and set alerts so you won't have to babysit your charts again.

AUDUSD ANALYSISAUDUSD broke dowtrend line
price now trading in an uptrend line
price above
- SMA 100
- HVN around 0.7200
- key level around 0.7250
RSI above 50
MACD shows bullish momentum
so it's expected bullish movement to resistance level around 0.7430

GBPAUD: Preparing For Sells As Price ReversesPrice just reversed on the daily timeframe. Buyers were pushing GBPAUD to the upside, but now that AUDUSD is increasing in strength, GBPAUD is decreasing. These two currency pairs are whats called negative correlating currency pairs.
The pair they have in common are AUD. It's like a seesaw. AUD is in the middle. If GBPAUD increases AUDUSD will increase. If GBPAUD decreases AUDUSD will increase. There are plenty of websites to find positive and negative correlations. A quick Google search should do the job. Be sure to focus on pairs that move 70 to (-70) with and against each other.
AS far as GBPAUD, I'm on my hands until price pulls-back. We don't know how long price will decrease until the pullback happens.
Press 👍🏽 if you enjoy this analysis and be sure to comment your thoughts and questions below.
Remember, let us be kind to one another and provide value, not just random thoughts.

USDCAD 1.27377 - 0.7 % SHORT IDEA * CONTINUATION & PRICE ACTIONHEY EVERYONE
HOPE EVERYONE IS DOING GOOD HAVING A GOOD ONE,
A LOOK AT POSSIBLE SCENARIOS THAT COULD PLAY OUT IN THE COMING WEEK ON THE DOLLAR / CAD PAIR.
* The PAIR is currently range bound consolidating between support and resistance That just saw a test of the base of structure.
- Short term the pair has currently entered an up trend as WE broke above the double bottom formation on the 4h chart.
- The pair just saw a retest of the 50 % Fibonacci retracement level and rejected this level.
* A break below of this level changes the plan and we await the market to show us direction.
- Looking for LONG entries on the pair this week should all the rules of the formation be met.
lets see how it goes
IF THIS IDEA ASSISTS IN ANY OR IF YOU LIKE THIS ONE
SMASH THAT LIKE BUTTON & LEAVE A COMMENT.
ALWAYS APPRECIATED
____________________________________________________________________________________________________________________
* Kindly follow your entry rules on entries & stops. |* Some of The idea's may be predictive yet are not financial advice or signals. | *Trading plans can change at anytime reactive to the market. | * Many stars must align with the plan before executing the trade, kindly follow your rules & RISK MANAGEMENT.
_____________________________________________________________________________________________________________________
| * ENTRY & SL -KINDLY FOLLOW YOUR RULES | * RISK-MANAGEMENT | *PERIOD - SWING TRADE

EUR / USD 1.13638 - 0.4 % SHORT IDEA * STRUCTURE & PRICE ACTION HEY EVERYONE
HOPE EVERYONE IS DOING GOOD HAVING A GOOD ONE, A LOOK AT THE EURO / DOLLAR PAIR.
* The pair has been range bound in consolidation for a while now, trading in a descending channel within this structure.
- The pair saw a break above of structure currently rejecting this move, which brings the possibility of the descending structure being in play again.
- Looking for short entries on the PAIR short term this week should all the rules of the formation be met.
lets see how it goes
IF THIS IDEA ASSISTS IN ANY OR IF YOU LIKE THIS ONE
SMASH THAT LIKE BUTTON & LEAVE A COMMENT.
ALWAYS APPRECIATED
____________________________________________________________________________________________________________________
* Kindly follow your entry rules on entries & stops. |* Some of The idea's may be predictive yet are not financial advice or signals. | *Trading plans can change at anytime reactive to the market. | * Many stars must align with the plan before executing the trade, kindly follow your rules & RISK MANAGEMENT.
_____________________________________________________________________________________________________________________
| * ENTRY & SL -KINDLY FOLLOW YOUR RULES | * RISK-MANAGEMENT | *PERIOD - SWING TRADE

Gold reentry for shortGold reentry for short
Elliotwaveanalysics
Supplyanddemand
Fibretracement
Wychoff
Orderblock
All are involve

AUDUSD ANALYSISAUDUSD broke uptrend line
price now trading in a downtrend line
price below SMA 100 and HVN around 0.7130
price below a key level around 0.7110
MACD shows bearish momentum
RSI below 50
so it's expected bearish movement to demand zone around 0.6970
