BTCUSDHello guys.. :))
here we see a price reversal on btc, I personally will wait whether the supply zone at (42800-43444) will be broken and I will take a buy opportunity if the price retraces back to 41600 using price action..
thank you for viewing my analysis if you like it please share or like this analysis here I really appreciate it :)
Supplydemandanalytics

JICPT| Bullish setup of AUDUSD with trigger on 60mHello everyone. It's a simple bullish setup mainly based on daily chart.
Daily: flip + fib retracement + Rally-base-rally demand zone.
60m: confirmation & trading timeframe with trigger that the downtrend line in red needs to be violated.


GBPJPY Weekly Analysis With All TimeFrameAs we can see GBPJPY Weekly close is above
the previous candle now we can see more
upward movement we have 2 point
1. Day candle close above D1 Resistance Level1
2. we can see some retracement

NAS100 BUY SETUPReverse Head and shoulder formation at 12950.00. After the bullish run for the past three weeks, price retraced back to 13855.0 price level and at the same time making a 38.2% fib retracement at that same level. So my anticipation will be that price is likely to continue it's bullish movement from next week. Expecting price to reach the previous all time high at 16958.00

GBPUSD: Recent Supply Sell 🎯I would like to see price begin bullish for the day. Since we have swept some buyer liquidity it is only right that we go for some seller liquidity before the trend continues.
I will be joining sells at the 1HR supply IF the price respects my imbalance levels and gives confirmation.
I will keep you all updated.
Let's smash this week traders! 🔥

OGNUSDT is testing the monthly supportThe price got a rejection from the 0.80 Daily resistance where the market created a double top.
On 4h timeframe the price is creating a descending channel and the market is testing the 0.618 Fibonacci level and monthly support on 0.49.
The market is testing the supply zone right now
How to approach?
The price must hold the monthly support on 0.49$ and flip again the supply zone as new support. IF the price is going to have a breakout from 0.59-0.60, According to Plancton's strategy , we can set a nice order
–––––
Keep in mind.
🟣 Purple structure -> Monthly structure.
🔴 Red structure -> Weekly structure.
🔵 Blue structure -> Daily structure.
🟡 Yellow structure -> 4h structure.
–––––
Follow the Shrimp 🦐

EURUSD POTENTIAL NEXT MOVEMENTsymmetrical triangle pattern in range since 2017 (*weekly timeframe), interesting. we need several week for confirmation to find out the major direction, tend to reversal or breakout to continuing down.
#notfinancialadvice
#nfa
#doyourownresearch
#dyor
#eurusd

APEUSDT m15 - 09/04/2022 Two possible scenarios for APE. Link to my long-term APE analysis below
Good luck

Going up?Price has reached our weekly bear orderblock level and we see price consolidating. We want to see a good bear reaction form that level.. This may unfold prolly tomorrow or next week. Just waiting for the right time. 90% waiting 10% trading

GBPJPYFX:GBPJPY have good point for buy entry please use risk management in your trade for good profit

NZDUSD Long Trade Plan✅ Potential long opportunity if we see price respect the bullish structure, preferably price remain trading above 0.69 major level.
❌ Long bias invalidated when price trading below 0.6870 level.
_________________________________________________________________________________________________________________________________________
Traders! if you like my ideas and do take the same trade, please write it in comment so we can manage the trade together .
Disclaimer
the content on this analysis is subject to change at any time without notice, and is provided for the sole purpose of assisting traders to make independent investment decisions.
_________________________________________________________________________________________________________________________________________
Thank you for your support

USDCAD Long Trade plan✅ Potential long opportunity if we see price respect the bullish structure, preferably price remain trading above 1.25 major level.
❌ Long bias invalidated when price trading below 1.2450 level.
_________________________________________________________________________________________________________________________________________
Traders! if you like my ideas and do take the same trade, please write it in comment so we can manage the trade together .
Disclaimer
the content on this analysis is subject to change at any time without notice, and is provided for the sole purpose of assisting traders to make independent investment decisions.
_________________________________________________________________________________________________________________________________________
Thank you for your support

Trading Plan GBP/JPYPotential for a fake breakout in the area around the significant Resisten on Entry Zone 1, and if the price penetrates entry zone 1, there will be a potential retrace in significant supply in entry zone 2


ETHUSDT wants to retest the supply zoneThe price got a rejection from the supply zone as I told you in the previous analysis.
On the weekly timeframe, the price created a nice candle below the weekly structure and now the market is testing the 0.382 Fibonacci retracement.
On 4h timeframe, the price is testing the previous resistance as new support on 2800$
For a bullish scenario, the price needs to flip the 3k resistance with volume and confirmations, retest the supply zone as new resistance.
In the short term, we could see a new retest of the weekly area.
––––
Keep in mind.
🟣 Purple structure -> Monthly structure.
🔴 Red structure -> Weekly structure.
🔵 Blue structure -> Daily structure.
🟡 Yellow structure -> 4h structure.

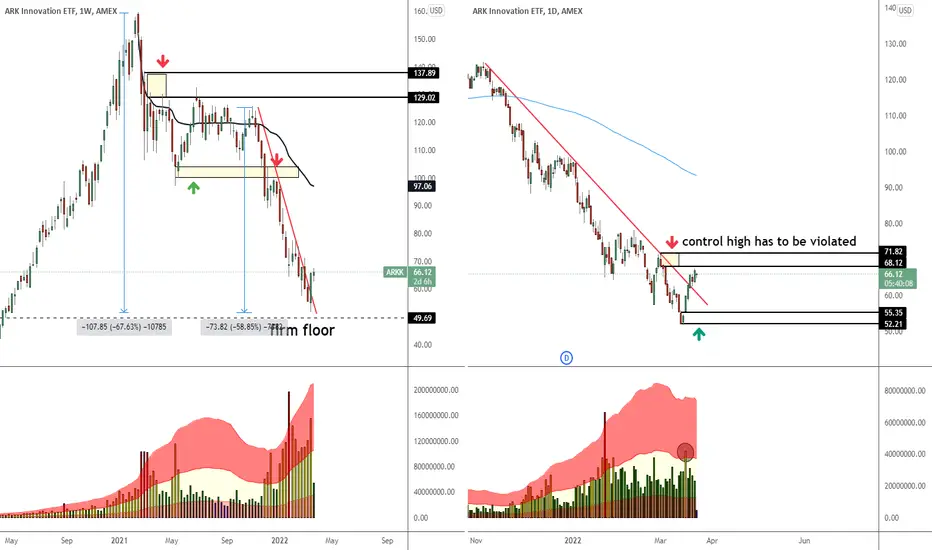
JICPT| ARK seeking to go up with supply zone ahead to conquer! Hello everyone. After tumbling approximately 70% from the high created Feb. of last year, now the chart of ARK started to get my attention.
On the daily, the red downtrend line looks to be violated. The nearest supply zone is $68 to $72, which it has to be conquered to establish momentum to the upside.
So, I'm neutral until the zone being penetrated through. Price is likely to go sideways with the bottom boundary around $52 to $55 . I will pay close attention to zone if it revisit and retest the zone.
SUPPLY vs DEMAND 📉📉📉✅1) Use longer time frames to identify supply and demand zones
By zooming out, traders are able to get a better view of areas where price had bounced off previously. Be sure to use the appropriate charts when altering the between multiple time frames. Draw a rectangular shape to denote this zone. Demand and supply zones do not necessarily have to appear together - often currency pairs can reveal one or the other.
✅ 2) Identify strong moves off the potential demand/supply zone
Certain price levels offer value to either bullish or bearish traders. Once institutional traders and big banks see this value, they will look to capitalize on it. As a result, price action tends to accelerate relatively quickly until the value has diminished or has been fully realized. Witnessing multiple instances of this at the same price level increases the probability that it is an area of value and therefore, a supply or demand zone.
✅ 3) Use indicators for confirmation of support and demand zones
Traders can incorporate daily or weekly pivot points to identify or confirm supply or demand zones. At DailyFX, we have a dedicated page showing relevant support and resistance levels for all major markets. Traders should look for support and resistance levels to line up with demand and supply zones for higher probability trades.
🏦 Often, a currency pair will climb to an area of resistance called a ‘selling zone’, where sellers perceive there to be great selling potential at a relatively overbought price. The reverse is also true for currency pairs that drop to relatively low levels, ‘demand zone’ where buyers perceive there to be great value to buy.
If you haven’t learned the basics of the supply and demand, or would like a refresher, read our guide on the forces of supply and demand.
🏦 Supply and demand zones are observable areas on a chart where price has approached many times in the past. Unlike lines of support and resistance, these resemble zones more closely than precise lines. Traders can customize charts to identify the demand and supply zones
Do you use this concept ? 🔥

GBPJPY triple swing (low risk)Bullish (Check new supply to double/triple below numbers/ place sell in reverse order of buy limit)
Buy limit placed 153.600. Stop loss 153.200. Take profit 155.416.
3.0 Lot. $900 risk. Reward $2,448. (possibly 2-3 x this if levels of supply and demand are respected)

NZDCAD: Price action and PatternesHi Friends. According to our chart, it hits an area of supply as well as the formation of a double top, and then goes to reach the goal specified in the diagram.


GBPJPY SHORT OANDA:GBPJPY daily & 4 hour chart we can see nice supply zone setting for next selling opportunity. If price reach to supply zone I'm looking ABC / 123 correction in 15 minute chart. #gbpjpy #eurjpy #audjpy #nzdjpy all 4 charts are providing same chart pattern.

AUDUSD SHORTA fresh supply zone with great odds to go short on, price has established signs of strong zone, noted on the break of structure and other factors that confirm this zone, digging down to 4Hr you'll see a refine zone to go short on.

CADJPY SHORT2 Supply Areas nested within a Daily supply, Under a Monthly and Weekly Down Trend equals a potential down fall for this pair.
Daily supply established two odds that help us declare this pair will fall at the 2 noted 4Hr supply zones, those two odds are Break of structure and Imbalance away from the zone and other odds are also seen
Definitely going to be looking for shorts up those supply zones.
