CADJPY 1H, Trade Alert! Buy Limit 108.210
Stop Loss 107.930
Take Profit 1 108.490
Take Profit 2 108.770
Take Profit 3 109.050
Supplydemandanalytics

AUDCAD: In middle of the long-term channelHello traders,
There are two entry and and two TPs for this chart.
Levels calculated order_block, regarding support and resistances, channel and pivot points.


EURUSD buy 15m Entry and Stoploss updateI have updated the entry and stoploss on EU. The TP remains the same.

Expecting a shift to the down side | GBPUSDGBPUSD have been ascending to the upside in 4H time frame taking the resent high as liquidity in to the supply zone (sell zone), regretless, the supply zone still holds since the daily time frame is bearish i am expecting a shift to the down side to take out the recent low at 1.27037 or the next at 1.26866 my expected target is 1.26624

BTCUSD will rise to to 31kBITCOIN shit at point of interest give a strong daily momentum candle(DMC) which indicate sellers exhaustion, i expect BITCOIN to rise to 31006.3 in to the supply zone

Market Structure Shift | DXY LongDXY failed to take liquidity at 101.748 and gave a structural shift to the upside with 4H bullish momentum candles indicating a potential long, i expect a reach to a target above 103.372 in to the supply zone.
DXY might take liquidity at 102.432 or tap into the demand zone(buy zone) below 102.311 before hitting the supply zone 103.372.

Time for pullback | US30US30 hits the demand zone leaving a pin rejection after taking the sell side liquidity at 34335.55 and also a 4H bullish engulfing pattern, i expect a reversal to target at 34724.97 or 34888.79 BSL

EURUSD weekly Bias | potential bearish sentimentconsidering the liquidity taking at 1.10484 and the instant bearish fall has negate the demand zone around 1.09378 - 1.09134 hence expect more of bearish sentiment

CORN wedge / triangle coiling for breakout LONGCORN on the daily chart since late June has fallen to the present level with a
flat or slowly falling support line. I see this as a falling wedge or a flat bottom triangle
slowly setting up a breakout whose upside could be 30% or more. Price had a nice
green engulfing bar to finish a down week in the general markets. CORN does not
follow the general market. It is following the collapse of the Black Sea grain deal and
the increases in the Brazil export levels. Brazil is coming into its growing season now
as it is in the southern hemisphere and spring approaches. The chart shows
CORN inside the triangle/wedge and is approaching its acute corner. I see this as
a long trade setup which I will take. If you want to trade this trade and am curious as to
the specifics as I see them, leave a comment.

potential BUY on demand zone | NasdaqNasdaq gave pin rejections on a demand zone and push to the upside with 4H momentum candle which could possibly indicate the sellers weakness.
on the daily time frame there is a bullish engulfing pattern indicating potential reversal
However WATCH OUT!

GBPUSD shows a bullish moveGBPUSD gave a star pattern after taking the sell side liquidity at 1.26602 which indicate a possible short- term buy, but i expect GU to take the liquidity at 1.26876 before pushing to the upside in to the the supply zone around 1.28066 - 1.27655

Possible bearish correction | USDCHF USDCHF on the daily time frame is still bearish ,after taking the liquidity around 0.87924 level mixed with bearish engulfing pattern and momentum candles, expecting a potential bearish move to the downside for a liquidity grab at 0.86624 ,0.87007 or 0.87175 price value

Potential short-term Buy | GOLDGOLD took the SSL and react on a demand zone given a bullish engulf pattern hence expecting a possible bullish move bellow 1937.48 for liquidity grab at 1947.06 in to the supply zone, note that the supply might give a bit of retracement

USDCAD | Risky short-term sellconsidering the buy side liquidity 1.33865 USDCAD wicked and closed below, along side with a trend line break expecting the previous day high as a liquidity momentum for a push to the down side below 1.33210

USDCAD Price Action Outlook considering the daily Bullish engulfing after taking the SSL on the demand zone could result to a possible take out of the supply zone 1.32341 and further push to the upside, however price might respect the supply zone and push to the downside for SSL hunt.

US30 short-term sellUS30 react to 35680.60 historical price level giving a 4H bearish engulfing which could indicate a possible retracement to 35352.39 or 35261.98 price value

EURUSD potential Buy, risky!EURUSD show a 4H bullish momentum candle (BMC) on demand zone which could indicate a short-term buy to price value 1.10476 liquidity.

watch out! potential supply zone, Nasdaqnasdaq is at extreme level, expecting a rejection at 15903.72 for a possible retracement to 15367.68

GOLD| Expecting, Bearish Sentiment explainedGOLD bulls has loose it after hitting a supply zone 1985.35 along side with a bearish momentum candle expect more to the down side

Nasdaq on Supply zoneNDQ100 is back on the supply zone expecting a short term sell to 15503.35 price value since NDQ100 have taking the BSL 15788.20 in to the zone going long is risky

Potential Rise on DXYdxy shows a strong bullish momentum candle, there is possibly for a potential rise after dxy takes out the BSL in to the demand zone with engulfing pattern expect further rise in to 102.214 zone

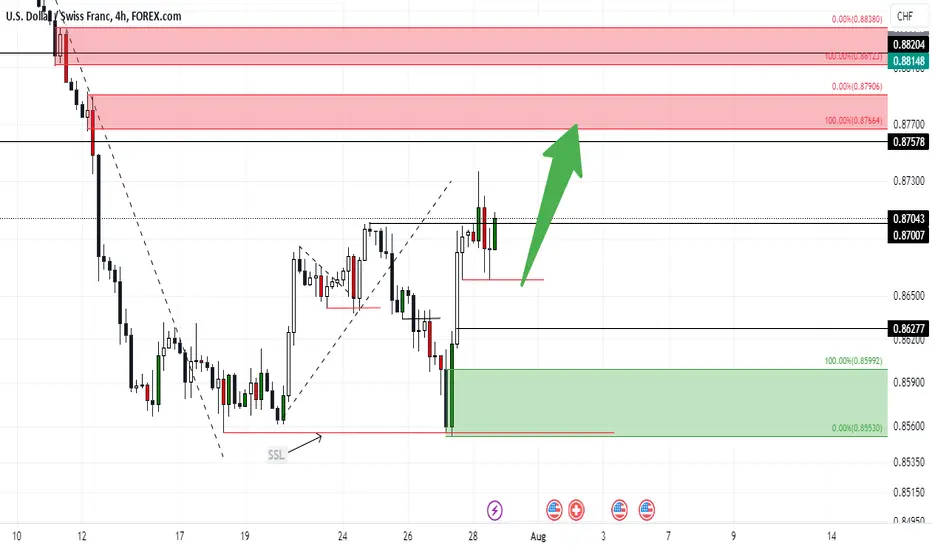
USDCHF potential BUYUSDCHF indicate a possible potential buy by indicating a bullish momentum candle, USDCHF will riseto 0.87578