DAY TRADE 023BYBIT:PHBUSDT.P
Goodmorning powerful people today we are hitting a trade with a limit on this spot I have created/predicted the chart has reacted really well off the 0.80 mark so in my eyes we are going to keep the reaction going. obviously we never know where these coins are going so its only obvious for me to grab a limit buy around that 0.90 mark. If this happens to hit my stop then i will re evaluate my desicion and look back down around the 0.80 mark again. all in all we are back and on that grind people. Off to the gym.
LIMIT - 0.8858
STOP LOSS - 0.8433
TAKE PROFIT - 1.1232
Supply Zone

GOLD|Weekly roadmap and important areasHello, I hope you are doing well
We see gold chart in 1 hour time frame.
We saw a drop for gold on Friday after the nfp data release.
Further, selling pressure on gold has been maintained and managed to break the important demand area downwards.
At the moment, we are on the demand zone, where we have to wait for this candle to close.
If candlestick or price patterns are formed, we can enter buying positions.
If this area breaks down, it is the next demand area (2011-2008).
Supply areas (2042-2039) and 2047 range are valid areas to check the price in this area.

GBPUSD|Important areas for entering a sales positionHello friends, I hope you are doing well.
We have a 4-hour time frame on the radar chart.
After its upward trend, it was in a neutral trend for a few days. This range and the support area that had prevented the price from falling many times have broken down.
Currently, by hitting the 4-hour demand area, it has moved upwards again, but because the general view is bearish and selling positions have a higher winning percentage.
Valid supply areas are marked on the chart.
When the price reaches these ranges, you can enter the position by seeing the candlestick patterns and price patterns in smaller time frames.

XAU/USD SELL - 07/02/2024Dear Students,
I trust you're all eager to explore the fascinating world of trading. Today, I want to walk you through the rationale behind a hypothetical sell position in gold in 2051, leveraging a supply zone strategy.
1. Identifying the Historical Supply Zone:
Upon thorough analysis of historical price charts, a prominent supply zone was identified at the price level of 2051. This zone represented a region where sellers historically dominated, creating a robust resistance level that had consistently held over time.
2. Technical Analysis:
The decision to initiate a sell position was heavily influenced by technical indicators. The presence of the supply zone, coupled with other bearish technical signals like overhead resistance, reversal candlestick patterns, or negative momentum indicators, provided a compelling case for a potential downward movement in gold prices.
3. Fundamental Analysis:
Fundamental factors were also considered in conjunction with the technical signals. If economic conditions, central bank policies, or geopolitical events aligned with the technical signals within the supply zone, it bolstered the conviction behind the sell decision.
4. Global Economic Conditions:
Understanding the broader economic landscape was pivotal. Factors such as interest rate decisions, economic indicators, and currency movements that interacted with the supply zone were carefully analyzed to anticipate potential catalysts for a downward price movement.
5. Market Sentiment and Supply Zone Dynamics:
The supply zone wasn't just a technical level; it also resonated with market sentiment. If there were indications of increased selling interest or a shift in sentiment aligning with the supply zone, it added another layer of confidence to the sell decision.
6. Diversification within the Supply Zone:
Initiating the sell position within the supply zone was strategic for portfolio diversification. By entering the market at a historically significant level, the trade aimed not only for potential profits but also to minimize risks associated with potential market reversals.
7. Short-Term Perspective:
This sell position was approached with a short-to-medium-term perspective, anticipating a potential price decline within the context of the identified supply zone.
8. Risk Management within the Supply Zone:
Robust risk management strategies were integral to this hypothetical trade. Setting stop-loss orders and closely monitoring price movements within the supply zone were paramount to control potential losses.
Remember, this discussion is intended for educational purposes, and trading decisions should be based on a comprehensive analysis of both technical and fundamental factors. If you have any questions or would like further clarification, feel free to reach out.
Happy learning,

OTE Entry ModelThis is the OTE Entry Model I use. It works when all Higher TF Targets and Bias are aligned.

XAU/USD LongDear Students,
I hope this message finds you engaged and ready to delve into the intricacies of trading. Today, I want to walk you through the thought process behind a hypothetical buy position in gold in 2019, with a focus on utilizing a demand zone strategy.
1. Identifying the Historical Demand Zone:
In 2019, as we reviewed historical price charts, it became apparent that there was a well-defined demand zone for gold. This zone represented a price range where buyers consistently stepped in, creating a support level that had proven resilient over time.
2. Technical Analysis:
The decision to enter a buy position was significantly influenced by technical indicators. The demand zone, coupled with other technical signals like bullish candlestick patterns or positive momentum indicators, provided a compelling case for a potential upward movement in gold prices.
3. Fundamental Analysis:
Fundamental factors were also taken into account. If economic conditions, central bank policies, or geopolitical events aligned with the technical signals within the demand zone, it strengthened the conviction behind the buy position.
4. Global Economic Conditions:
Understanding the broader economic environment was crucial. Factors such as interest rate decisions, economic indicators, and currency movements that interacted with the demand zone were carefully considered in the analysis.
5. Market Sentiment and Demand Zone Interaction:
The demand zone wasn't just a technical level; it also resonated with market sentiment. If there were indications of increased buying interest or a shift in sentiment aligning with the demand zone, it added another layer of confidence to the buy decision.
6. Diversification within the Demand Zone:
The demand zone served as a strategic entry point, allowing for diversification within the portfolio. By entering the market at a historically significant level, the trade aimed not only for potential profits but also to minimize risks associated with volatile market conditions.
7. Long-Term Perspective:
This buy position was approached with a long-term perspective. The demand zone, being a historically robust support level, suggested the potential for a sustained upward movement in gold prices over an extended period.
8. Risk Management within the Demand Zone:
Risk management strategies were integral to this hypothetical trade. Setting stop-loss orders and closely monitoring the price action within the demand zone were essential to ensure that potential losses were limited.
Remember, this discussion is intended for educational purposes, and trading decisions should be based on a comprehensive analysis of both technical and fundamental factors. If you have any questions or would like further clarification, feel free to reach out.
Happy learning,

REDINGTON - STRONG ALL TIME HIGH BREAKOUTEntry level triggered - 200
If falls again then you need to average at 160 level
Targets - 260,300+
Disclaimer - All information on this page is for educational purposes only,
we are not SEBI Registered, Please consult a SEBI registered financial advisor for your financial matters before investing And taking any decision. We are not responsible for any profit/loss you made.
Request your support and engagement by liking and commenting & follow to provide encouragement
HAPPY TRADING 👍

GBP Bullish potentialI have same idea for GU as last week, i will be looking to get some nice buys in if i can and also sells to the demandzones if Ordeflow lets me in on the daily opportunities. Short but powerful analysis, keep it simple and gain by doing so!

Gold lookoutI haven't been trading gold lately, bc of the All-time high being swept and by that gold followed some harder PA. I currently think gold is still bullish and that it could be a nice correlation between a potential DXY bearishness. Here are some zones i will have lookout for for some potential long moves or quick scalps! If this idea should be valid i would like to see price move below the weekly open immediately at the beginning of the week and then start to gain momentum later on in the week! Usually Wednesdays and Thursdays presents us the low or high of the week so that would be a nice confluence! i will be checking the daily and weekly open as i look in too these potenial buys! PEACE

📈 IMX Technical Analysis: Horizontal Level Shakeout ! Immutable X (IMX) has been trading on the 4-hour timeframe, forming a substantial horizontal level that acted as a significant resistance zone. Following a strategic breakout from this level, IMX initiated a move to challenge the descending trend line from above. The successful penetration of the trend line signals a breakout strategy's effectiveness, and the anticipation is for further upward movement with a target of $2.50.
🔄 Formation of Horizontal Level:
IMX's extended trading within a horizontal range on the 4-hour timeframe marked a period of consolidation and potential accumulation. The horizontal level acted as a formidable resistance barrier, creating a critical zone to overcome for sustained bullish momentum.
🚀 Breakout and Down Trend Line Penetration:
The strategic breakout from the horizontal level was accompanied by a decisive penetration of the descending trend line from above. This combination of breaking through a horizontal resistance and overcoming the trend line suggests a significant shift in market dynamics and a potential reversal of the prevailing bearish sentiment.
🔍 Significance of the Breakout:
The breakout from the horizontal level and the subsequent penetration of the down trend line are indicative of increased buying interest. Traders and investors may interpret this as a signal to enter long positions, with the expectation of further upward movement.
💡 Target at $2.50:
With the successful breakout and trend line penetration, the next target for IMX is set at $2.50. This level represents a key resistance point and a potential area for profit-taking, requiring careful monitoring for potential reactions.
🔮 Future Outlook:
The technical analysis suggests a favorable setup for IMX, with the successful breakout from the horizontal level and the penetration of the descending trend line. Traders should closely monitor the price action for confirmation of sustained upward momentum. The cryptocurrency market's dynamic nature emphasizes the importance of adaptability and risk management in trading decisions. If IMX continues on its current trajectory, reaching the $2.50 target becomes a plausible scenario.

Support and Resistance VS Supply and Demand. Important Lesson
In the today's post, I will compare support and resistance levels with supply and demand zones.
I will explain to you the difference between them and share important tips and examples.
What are support and resistance levels?
We also call them key levels. These are particular levels on a price chart from where in the past we saw significant bullish or bearish movements.
Key support will be a one single level, that has a historical significance and from where a bullish reaction will be anticipated.
The all-time low on USDCHF will be a perfect example of a key support.
It is one single level that was respected one time in the past and from where a bullish reversal initiated.
Key resistance will be a one single level on a price chart that has a historical significance and from where a bearish movement will be expected.
The all-time high on Gold will represent a key horizontal resistance.
That level was respected one time in the past and from that level exactly the market dropped heavily.
What are supply and demand zones?
In comparison to support and resistance levels, supply and demand zones are the areas on a price chart. The zones that are based on multiple touches and consequent strong bullish or bearish reactions.
Demand zone will be the area that was tested at least 2 times in the past, and the price should strictly respect different price levels within that area.
A similar reaction will be anticipated from the demand zone in the future.
The yellow area above will a good example of a demand zone.
You can see that the price tested that area 3 times, and each time the market respected different levels lying within that.
These 3 tests compose the demand area.
Supply zon e will be the area that was tested at least 2 times in the past and the price should strictly respect different price levels within that area.
A similar reaction will be anticipated from the demand zone in the future.
In this example, a supply area on EURUSD is based on 2 touches of key levels, lying very close to each other.
On the chart above, I underlined 2 horizontal support levels - the single levels that were respected by the market multiple times, and a supply zone - the area that is based on tests of multiple levels lying close to each other.
Support and resistance levels give you SINGLE levels from where you can look for trading opportunities. While supply and demand zones represent the areas. After a test of a supply and demand zone, the market may react to a RANDOM level within that.
For newbie traders, it is highly recommendable to trade single key levels, while experienced traders can broaden their strategies and trade supply and demand zones as well.
❤️Please, support my work with like, thank you!❤️

BITCOIN|Weekly roadmap and important areasHello friends, I hope you are doing well.
We have the weekly bitcoin outlook.
Bitcoin is now on an important supply area that has scalp reactions from this area.
The important areas that we can consider for buying positions are the demand area (40160-39800) and the next level is $38900 .
For selling positions, this upcoming supply area is a suitable place, the next area is (45700-46300) which we can have selling positions by reaching these areas.

IOC 4 YEARS OF SUPPLY ZONE BREAKOUT IN OCT 2023SUPPLY ZONE BREAKOUT IN OCT 2023
But i suggested this stock on 12th Nov 2023 at 100 level
Entered at 100
Targets - 110,120,130,150+
3 TARGETS COMPLETED IN JUST 45 DAYS.... GIVEN 35 POINTS (35%) RETURNS
CMP - 129.85
Re-entry possible at 120 levels... if again falls than average at 110 level
@Jagadheesh_JP
In this channel, I share my expertise in trading strategies, technical analysis, and market trends to help you make informed decisions in your trading ventures.
Stay tuned for daily updates, in-depth market analyses, and real-time trading scenarios to witness firsthand how we transform from Zero to Hero in the trading world. My Only aim is to empower you with the knowledge and skills necessary to navigate the complexities of the financial markets successfully.
Disclaimer - All information on this page is for educational purposes only,
we are not SEBI Registered, Please consult a SEBI registered financial advisor for your financial matters before investing And taking any decision. We are not responsible for any profit/loss you made.
Request your support and engagement by liking and commenting & follow to provide encouragement
HAPPY TRADING 👍

IRB INFRASTRUCTURE STRONG BREAKOUT ON OCT 2023STRONG SUPPLY ZONE BREAKOUT
- Strong BO Candidate
- Big Range Accumulation
- Strong Bullish Momentum
- Trading All Time High
- Strong HH-HL Trend
- Massive Volume Buildup
- Looks Ready For 40,45,50+
- Hold 4 to 5 Months
Entered at 35
Targets - 40,50,60,80+
1st Target Completed with in 2 months 23% returns & going
CMP - 41.55
Re-entry possible at 40 level
if falls again from 40 level then average at 35 level
Disclaimer - All information on this page is for educational purposes only,
we are not SEBI Registered, Please consult a SEBI registered financial advisor for your financial matters before investing And taking any decision. We are not responsible for any profit/loss you made.

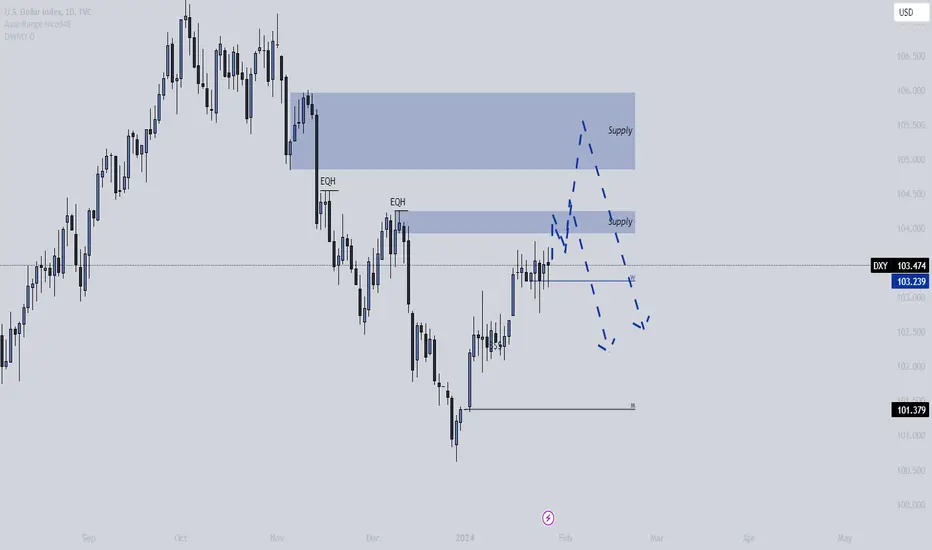
DXY BULL MSS INTO BEARI am looking for an extension in DXY to grab some resting liquidity and test the supply zones! Price looks exhausted, which is a great sign of weaker bullish pressure. Therefore we could soon be looking for more of a distribution phase in DXY to then see down movement! Enjoy!
Bearish to Bullish GUI am looking for a Bearish drop for GU for a potential buy on the pair! I have been loking for a nice buy setup on this pair, but i have only found nice sells so far! now i am looking for a nice Sellpreassure into the buy zones! By using The daily open we can later check if this bias was a good look for it! hopefully, we could see a nicer reversal move later in the week to form a nice weekly candle!

EUR/AUD Analysis: Bearish Outlook Signals Downside MomentumHello Traders,
The analysis on EURAUD indicates bearish sentiment. The currency pair faced rejection at a supply zone (which also coincides with the monthly resistance at 1.6655) and is within a downward channel, signaling a potential downtrend. Sellers are targeting the 1.6479 level, with a break below suggesting further decline to 1.6418, marking a key support level.
Cheers and happy trading

Smart Money Concept + 50ema + RSISmart Money Concept:
The term "smart money" refers to the institutional investors, fund managers, or sophisticated traders who are believed to have a deep understanding of the market and make well-informed investment decisions. The concept suggests that following the actions of these experienced and well-capitalized market participants can provide insights into potential market movements.
Exponential Moving Average (EMA):
The Exponential Moving Average is a type of moving average that places a greater weight on more recent data points. It reacts more quickly to price changes compared to the Simple Moving Average (SMA). The +50 EMA specifically refers to the 50-period EMA.
How it works:
If the current price is above the +50 EMA, it is considered a bullish signal.
If the current price is below the +50 EMA, it is considered a bearish signal.
Trading Strategy:
Some traders use crossovers between the price and the +50 EMA as buy or sell signals. For example, a bullish crossover (price crosses above +50 EMA) might be seen as a buying opportunity, while a bearish crossover (price crosses below +50 EMA) might be seen as a selling opportunity.
Relative Strength Index (RSI):
The RSI is a momentum oscillator that measures the speed and change of price movements. It ranges from 0 to 100 and is typically used to identify overbought or oversold conditions in a market.
How it works:
RSI values above 70 are often considered overbought, suggesting a potential reversal or pullback.
RSI values below 30 are often considered oversold, suggesting a potential reversal to the upside.
Trading Strategy:
Traders may use RSI to identify potential trend reversals or confirm the strength of an existing trend.
For example, if the RSI is above 70 and the price is also above the +50 EMA, it might signal an overbought condition, and a potential reversal or pullback could be anticipated.

How to identify high quality Supply and Demand zonesSupply and demand zones are powerful tools to find high probability trades. If they are used in the correct context they offer a high win rate and a very controled risk. These are some of the characteristics that high quality zones have:
•When a good zone is being created in real time you will watch that price pushes down/up with aggressive price action and follow through after the basing candle. Heavy volume on the development and candle closing at its highs are also good indicators.
•A high quality supply/demand zone is the one that creates new lows/highs. That means that it was able to push below/above the prior low/high.
•In short time frames, shorter than 1 hour, you would probably find good supply and demand zones to have a continuation of the trend. For example, if a Future is in an uptrend pay attention to the demands that are created in that trend and then when price pulls back to it look at the price action in the zone. Have in mind that in uptrends, demand zones are reliable and supply zones have a much lower probability of working. The opposite scenario happens in downtrends were supply zones are higher probability and demand zones should be avoided.
•In higher time frames, a very strong supply or demand zone could be an area for a change of structure (from an uptrend to a downtrend for example).
•A good indicator of a reliable supply/demand zone is when price pulls back to it and the candle has a strong rejection as it touches the zone, meaning an upper/lower wick is created below/above the zone. volume is developing with no follow through (orders hitting strong ask/bid in the tape) and the candle does not close inside the zone.
•Speed heading into the zone is also relevant, a high speed drop heading in to a demand zone is a good area to trap late sellers.
•If for example FX:EURUSD has a demand zone and TVC:DXY has a supply zone or a resistance level and both are having retracements from their trend, that could be a good opportunity to go long and also if price action gives an extra confirmation. This means that confluence is key for a high probability trade when using supply and demand zones.
• Use the concept of relative strength/weakness when using confluence with other charts.
Example: A 2 hour demand zone in Brent Futures $NYMEX:BZ1!. Notice how the red candle that reaches the zone is a strong one with higher volume and is not able to close inside the zone, It prints a lower wick and closes above it giving the demand zone a good price action confirmation.

HelenP. I Ethereum can fall to trend line and make impulse upHi folks today I'm prepared for you Ethereum analytics. After the price broke some days ago support 2, which is located in the support zone, ETH declined to the trend line. But soon it turned around and made a strong impulse up to support 1, thereby breaking one more time support 2. Later, ETH broke support 1, which coincided with the resistance zone, and rose to 2715 points, after which the price fell to the resistance zone. As well then, the price some time traded near this zone, but a not long time ago it tried to rise higher, but failed and in a short time declined below support 1, breaking this level again. Also soon, the price declined to the trend line, after which it bounced and rose back to the resistance zone, where it continues to trades to this day. For my mind, Ethereum will decline to the trend line and then the price can rebound up higher than it is now one more time. That's why I set my target at the 2575 level. If you like my analytics you may support me with your like/comment ❤️

HOW TO IDENTIFY STOPLOSS HUNTER AND TAKE PART ON IT - SETUP - HI BIG PLAYERS!
Today I want give you smart WAY to take part on stoploss hunters. I know everyone of us hate it to be stopped out. But to be honest, stoploss levels means a huge volume level, that institutions use for cheap entries.
This is why I want explain how I take part on stoploss hunting. I look on 4h chart for high demand and supply zones. On touching these area we all can expect more trade exchange and more volume.
If the price bounce of this zone and break with CHOCH (change of character ) the last trend, a lot of trader try to trade early as they can and the stoploss becomes calculatable .
As soon as the old trend is resumed, but in a narrow form, so that it is almost a sideways phase, then I identify stoploss hunter. The setup looks similar like this structure:
The good news: the stoploss to the last local point is very close and Risk-Return-Ratios of 1:3 are possible.
Comments are welcome!
Best regards
NXT2017

Bitcoin Bullish Outlook for January 2024INDEX:BTCUSD is currently inside its bullish channel. My target is $51k still the same as my previous outlook.
RSI is showing exhaustion on the daily chart but i still expect it to hit the upper channel trendline first before a pullback. It is a one last push before a relief pullback.
Hopefully when the price of Bitcoin drops, Ethereum and the rest of altcoin will still rise. That signals altseason because the money flows from bitcoin to altcoin.

LDOUSDT|Important areas to enter buying positionsWe have ldo currency chart in daily time frame.
In the weekly time frame, we see the formation of a triangle pattern, in the daily time frame, the neckline of the upward triangle has been broken, I have identified three support areas for you on the chart, I think that this currency is growing well, to buy this currency, These areas are good places, and the red area is the last abyss of this trade, if you reach this area, you can completely exit your position.
The initial target for the price growth is $9, if it can start the upward movement, I will put the next targets in the update.
