✅USD_JPY SWING SHORT🔥
✅USD_JPY is about to
Face a strong supply level
Of 142.232 thus despite my
Bullish bias a local bearish
Correction seems to be
Highly likely
SHORT🔥
✅Like and subscribe to never miss a new idea!✅
Supply Zone

EUR-USD Supply Level Ahead! Sell!
Hello,Traders!
EUR-USD went up sharply
After FOMC but the pair
Seems to be overbought
At this point so as the
Price is entering the
Horizontal supply area
Around 1.098 I think that
We will see a local
Bearish correction
Sell!
Like, comment and subscribe to help us grow!
Check out other forecasts below too!

Swing setup on EU potential 300+ pipsPrice has given us enough signs that it will continue to go up. I'm just waiting for a pullback into discounted areas to look for longs. Those of you who are experienced can also get in on shorts when the 4H is pulling back to make profit with both longs and shorts

NZDJPY - NEW BULLISH MOVE📈Hey Traders👋🏻
On The Daily Time Frame The NZDJPY Price Reached a Strong Support Level (84.024-83.434)✔
The Price Reject to Break This Key Level and Create a new Lower Low 📉
So, I Expect a Bullish Move📈
i'm waiting for a Retest...
-----------
TARGET: 86.848🎯
___________
if you agreed with this IDEA, please leave a LIKE, SUBSCRIBE or COMMENT!

GBPUSD: Supply Zone Needs To Clear For CABLE To Rise HigherGBPUSD Currently is at a very crucial level trading near 1.26600. This level represents such significance on the weekly & monthly chart, that if broken properly it could see this pair rise higher and the probability of targeting upcoming resistance would highly likely increase.
Current 1.26600 level represents an important supply zone that is still intact. In order to confirm that this zone gets broken properly, the monthly candle should also close above it. After this has happened, a long trade could be executed to target the upcoming supply zone located at 1.30600. The minimum risk to reward ratio should be 1:1 ideally and stop loss placed below swing low.
Note: This is just an analysis/view and not a trade signal. Once if the criteria is met, trade details would be posted in a separate post. Lets see what happens. Cheers

USDZMW USDZMW looking forward to continuation of the down trend after the market mitigated some of the imbalances on the highs.
Markert made a bullish engulf candle signaling a good sell off probability which is currently being tested and mitigated.
Currently the Zambian economy is facing a form of uncertainty as it has not yet successfully come to an agreement to restructure its debt with its official creditors. positive news towards such an agreement will strongly confirm my analysis apart from that low up and down volatility is to be expected.

EURUSD SHORT BEFORE ECB RATESEUR/USD pair retreated below 1.0800 during the American session, facing resistance at the 1.0820 level and the 100-day SMA at 1.0805. The short-term bullish bias remains, but technical indicators offer mixed signals. The pair's retreat from recent highs suggests potential downside, with support levels at 1.0760 and 1.0740. However, the overall bias remains bullish, despite volatility expected due to the upcoming FOMC meeting and ECB meeting.
In Germany, May's inflation data confirmed a decrease from April, while the ZEW survey showed unexpected improvement. Germany's Wholesale Price Index and Eurozone Industrial Production data will be released, with expectations for a 25 basis point hike by the ECB.
The US CPI for May showed a lower-than-expected increase, indicating slowing inflation. This may influence the Federal Reserve's tightening cycle decisions. The Greenback initially tumbled after the report but later recovered. The direction of the EUR/USD pair will depend on the US Dollar's performance ahead of the FOMC statement.
Overall, caution is advised in light of market volatility and the impact of central bank meetings. Traders should closely monitor economic data and the guidance provided by central banks to make informed investment decisions.
Nicola, CEO of Forex48 Trading Academy

AUDJPY I Wait for bearish confirmation Welcome back! Let me know your thoughts in the comments!
** AUDJPY Analysis - Listen to video!
We recommend that you keep this pair on your watchlist and enter when the entry criteria of your strategy is met.
Please support this idea with a LIKE and COMMENT if you find it useful and Click "Follow" on our profile if you'd like these trade ideas delivered straight to your email in the future.
Thanks for your continued support!

How to Use the Supply and Demand Deluxe Indicator
Welcome, fellow traders, to this exciting tutorial where we dive deep into the world of supply and demand analysis using the powerful Supply and Demand Deluxe indicator that I launched this morning. Prepare yourself for an enjoyable learning experience as we unravel the mysteries of supply and demand levels across various timeframes. So, grab your favorite trading beverage, sit back, and let's embark on this adventure together!
Section 1: Understanding Supply and Demand Analysis:
Before we delve into the specifics of the Supply and Demand Deluxe indicator, let's understand the importance of supply and demand analysis in trading. Supply represents the availability of shares or contracts for sale, while demand represents the number of buyers interested in purchasing those shares or contracts. By analyzing the interaction between supply and demand, traders can identify potential turning points, support and resistance levels, and areas of high buying or selling interest. This knowledge forms the foundation of effective trading strategies, and the Supply and Demand Deluxe indicator is here to assist us in this journey.
Section 2: Introducing the Supply and Demand Deluxe Indicator:
The Supply and Demand Deluxe indicator is a powerful tool designed specifically for TradingView. Its primary goal is to identify supply and demand levels on various timeframes, including weekly, daily, and hourly. With visual plots and customization options, this indicator empowers traders to make well-informed decisions based on the principles of supply and demand. It caters to traders of all styles and timeframes, from day traders to long-term investors.
Section 3: Getting Started: Installing and Adding the Indicator to Your Chart:
To begin using the Supply and Demand Deluxe indicator, install it on your TradingView platform. Visit the TradingView website, navigate to the indicators section, and search for "Supply and Demand Deluxe (Stock Justice)." Click on the indicator to access its details and add it to your chart. The indicator will be added and ready to unlock its potential.
Section 4: Exploring the Key Components and Functionalities:
Let's explore the key components and functionalities of the Supply and Demand Deluxe indicator, which help us identify and interpret supply and demand levels effectively.
4.1 Daily and Weekly Pivots:
Daily and weekly pivots provide essential reference points. The indicator allows you to plot the previous week's high and low, yesterday's high and low, and the midpoint of yesterday's range. Visualizing these pivots helps gauge potential areas of interest and determine price behavior.
4.2 Weekly Supply and Demand Levels:
Weekly supply and demand levels are critical for understanding the broader market context. With the Supply and Demand Deluxe indicator, you can plot these levels, customize the number of levels displayed, choose line colors and styles, and decide whether to extend the lines. Enabling the "Show Price" option enhances your analysis.
4.3 Daily Supply and Demand Levels:
Similar to the weekly levels, daily supply and demand levels provide valuable insights into intraday price dynamics. Customize the number of levels displayed, choose line colors and styles, and determine line extensions. Enabling the "Show Price" option visualizes corresponding prices.
4.4 Hourly Supply and Demand Levels:
Intraday traders will appreciate the Hourly Supply and Demand Levels feature. The indicator automatically identifies these levels based on the highest and lowest values of the past 10 bars. Customize the number of levels displayed, choose line colors and styles, and even show prices associated with these levels.
4.5 ATR Expected Moves:
The ATR Expected Moves feature calculates expected price moves based on the Average True Range (ATR). Customize the lookback length and multipliers. Extend lines, choose colors and line styles, and display prices. Incorporating ATR Expected Moves helps set realistic profit targets and manage risk effectively.
4.6 Futures Levels:
For futures traders, the indicator provides specific levels for the Midnight Open, London Open, Asian Open, and the 8:30am EST level. These levels act as potential reference points, aiding in identifying intraday opportunities and aligning trades with global market dynamics.
Section 5: Customizing the Indicator to Fit Your Trading Style:
The Supply and Demand Deluxe indicator offers customization options to align with your trading style and preferences.
5.1 Adjusting Input Parameters:
Fine-tune the indicator by adjusting parameters such as the number of levels plotted, lookback length, multipliers for ATR calculations, and more. Experiment with different settings to better suit your trading strategy.
5.2 Customizing Visual Elements:
Customize line colors, styles, and extension options to enhance aesthetics and readability. Choose colors, line styles, and decide whether to extend lines to the left, right, or both. This level of customization ensures a visually pleasing trading experience.
Section 6: Practical Applications and Trading Strategies:
In this section, we explore practical applications and trading strategies using the Supply and Demand Deluxe indicator.
6.1 Identifying Key Supply and Demand Levels:
The indicator helps identify key supply and demand levels across different timeframes. Analyzing these levels in conjunction with other technical analysis tools can identify high-probability trade setups.
6.2 Using Pivots for Reference Points:
Pivots, both daily and weekly, serve as crucial reference points. Consider price reactions around these pivots and consider them in conjunction with supply and demand levels to gain valuable insights into market dynamics.
6.3 Incorporating ATR Expected Moves in Risk Management:
Use the ATR Expected Moves feature for risk management. Set realistic profit targets and define appropriate stop-loss levels based on expected price moves. This statistical framework helps adjust position sizing and manage risk effectively.
Section 7: Tips and Tricks for Maximizing the Indicator's Potential:
To enhance your trading experience with the Supply and Demand Deluxe indicator, consider these tips and tricks:
7.1 Leveraging Different Timeframes:
Analyze supply and demand dynamics across different timeframes. Use higher timeframes for overall market context and lower timeframes for precise entries and exits. Combining multiple timeframes improves analysis accuracy.
7.2 Combining Multiple Timeframes:
Combine the Supply and Demand Deluxe indicator with other technical analysis tools such as moving averages, oscillators, or chart patterns. This synergy provides confirmation signals and increases the probability of successful trades.
Section 8: Conclusion:
Congratulations on completing this comprehensive tutorial on the Supply and Demand Deluxe indicator! We've covered the fundamental concepts, explored features and functionalities, and discussed practical applications and trading strategies. Experiment with different settings, customize visual elements, and integrate the indicator into your trading plan. As you gain experience, you'll be well-equipped to make informed trading decisions. Keep exploring, stay disciplined, and may the markets bring you success!

AUDJPY - RESISTANCE BECOMES SUPPORT📈Hello Traders👋🏻
On The Daily Time Frame The AUDJPY Price Broke The Resistance Level (92.189-93.048)✔
Currently, The Resistance Level Becomes New Support Level📈
So, I Expect a Bullish Move📈
i'm waiting for a retest....
-----------
TARGET: 94.700🎯
___________
if you agreed with this IDEA, please leave a LIKE, SUBSCRIBE or COMMENT!

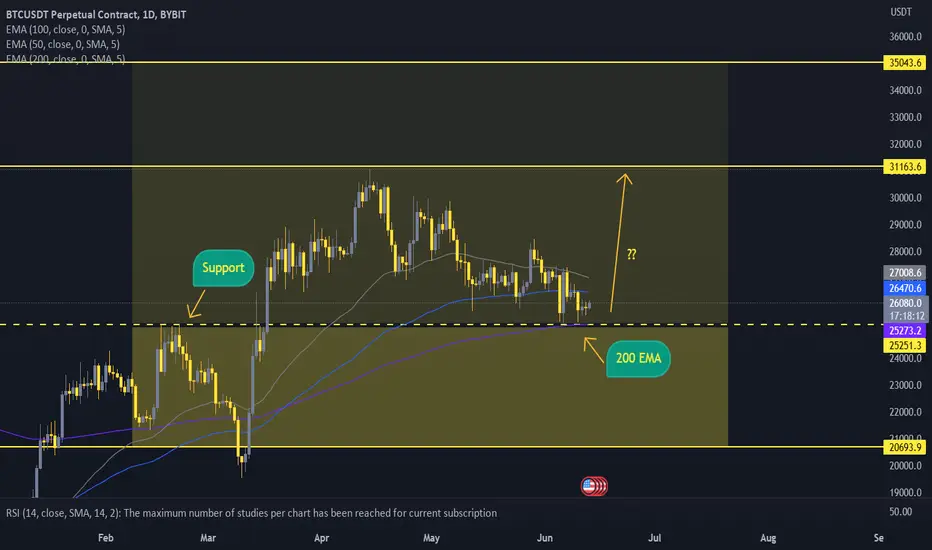
BTC ANALYSIS 13/06/23BYBIT:BTCUSDT.P
Just kicking my journey off with a nice and simple BTC analysis, so its quite obvious that we have come down too an area of support which is around the 25-26k mark. i dont care much for prices and news etc.. i like support and resistance... liquidity whatever... I'm purely a TA trader i have a very healthy strategy/routine that i have been in for a while now i will only be posting on what me as a person thinks is going to happen in the market, anyway btc has reached the 200EMA on the DAILY TF where you will also find a great zone of support (only valid if this support level proves confidence) now that we are in this zone of confidence we can set our SL's tight (under area of support) on a LOWER TF (15M, 1HR) ... then find your entry! Stick with the plan!
For more on my routine, mindset, etc... DM me!
NZDCAD BEARISH SETUP BEFORE FEDOn NZDCAD, we have a price consolidating around 0.8180 within an H1 supply zone. We anticipate a price decline followed by a bounce before descending towards the 0.808 area.
Happy trading to all. Nicola, CEO of Forex48 Trading Academy.

Back to Charting Again!* NQ1! Chart for 6/12 S/D LevelsTargeting R1 as a push through this resistance supply 4hr zone. I skipped the NY opening bell, and when I hopped on later in the morning, we were making bull strides to move up. VWAP and EMAs continued up by following PA so it didn't seem to waiver that we would fail dramatically to the downside. However, looking back for possible demand zones for later this week as we have FOMC and CPI/PPI being released. Looking for small points between 5-20 pt moves to avoid being chopped to much and using range/liquidity areas for targeting. I recommend using bookmap for your further conviction in seeing the order flow.
Throughout this week looking for BEAR targets at S1 14625 or lower to fill the gap we created to 14520. BULL target throughout the week is 15100 or 15231 *nearing* the double top resistance of Jan/March 2022.
Link for chart: www.tradingview.com

EURAUD BULLISH SETUP IS READYOn EURAUD, we notice a price consolidating around 1.592 within a demand zone. The price is consolidating after breaking a bearish trendline. In this area, many buying orders are accumulating, suggesting a potential increase in the stock price up to 1.62, where we have an interesting supply zone. I don't exclude a rise towards the 1.64 area.
Share your perspective.
Happy trading to all.
Nicola CEO of Forex48 Trading Academy

EURAUD - SUPPORT BECOMES RESISTANCE📉Hello Traders👋🏻
On The Daily Time Frame The EURAUD Price Reached A Support Level (1.60735-1.60358) !
The Price Failed to Create New Bullish Move📈and Broke The Key Level (Support Level Becomes New Resistance Level)
So, I Expect a Bearish Move📉
i'm waiting for a retest...
-----------
TARGET: 1.59221🎯
___________
if you agreed with this IDEA, please leave a LIKE, SUBSCRIBE or COMMENT!

SWING TRADING: LONG EURUSD. TARGET 1.07900TRADE TYPE: INSTANT ENTRY
TRADE DIRECTION: LONG
TIMEFRAME: 4H
ENTRY PRICE: 1.07000
STOP LOSS: 1.06450
TAKE PROFIT: 1.07900
RISK TO REWARD: 1:1
ANALYSIS: Price broke the supply zone comfortably and now shall look to aim towards the upcoming supply zone . stop loss ideally placed below swing low
Follow this thread for any future updates regarding this specific trade.
CAUTION: Trading outcome is Probability Based and could wipe out your account if risk management and strategy is not followed properly. Cheers

AUDCHF - RESISTANCE BECOMES SUPPORT📈Hello Traders👋🏻
On The Daily Time Frame The AUDCHF Price Broke The Resistance Level (0.60648-0.60276)✔
Currently, The Resistance Level Becomes New Support Level📈
So, I Expect a Bullish Move📈
i'm waiting for a retest....
-----------
TARGET: 0.61855🎯
___________
if you agreed with this IDEA, please leave a LIKE, SUBSCRIBE or COMMENT!

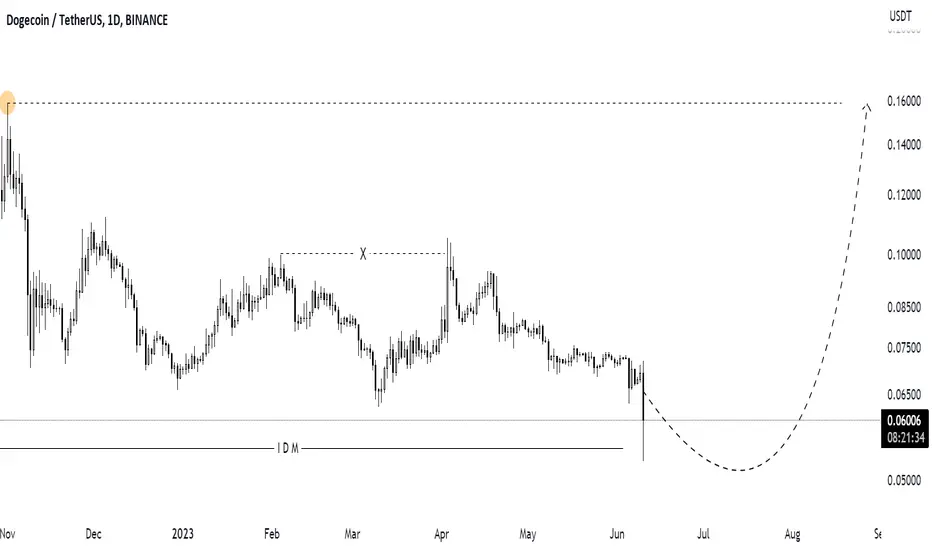
Buy opportunity on DOGEUSDTas you can see Doge grabed IDM liquidity and if this candle closes above the IDM , then we can buy until 0.157 on structure high.
This is not a financial advice and its just my analysis based TrueSMC
XAUUSD SHORT BEFORE FED RATESOn gold, we have a price that, after reaching the 1965 zone within a supply zone, reversed its course due to the significant volume present in the area. Now, the price has started to decline, and a target is expected around the 1946 zone, where there is a high concentration of orders and a demand zone at the 1943 level. Therefore, currently, we have a profitable short trade.
Share your perspective.
Wishing everyone successful trading, Nicola, CEO of Forex48 Trading Academy.

Long position 📉📈 high probability tradeHello to all trades.
In this chart we saw a good pressure from the bulls and I think the can have nice rally.
Please feel free to leave comment for me 🙏🙏🙏.
Cheers 🥂.

USDCHF - BEARISH MOVE📉Hey Traders👋🏻
The USDCHF Price Reached A Support Level (0.90568-0.90350) !
Currently, The Price Broke This Key Level (Support Level Becomes New Resistance Level)
Moreover, The Price Broke The Support Line 📈
So, I Expect a Bearish Move📉
i'm waiting for a retest...
-----------
TARGET: 0.89806🎯
___________
if you agreed with this IDEA, please leave a LIKE, SUBSCRIBE or COMMENT!

EURGBP I Headed to retest demand zone and will possibly break itWelcome back! Let me know your thoughts in the comments!
** EURGBP Analysis - Listen to video!
We recommend that you keep this pair on your watchlist and enter when the entry criteria of your strategy is met.
Please support this idea with a LIKE and COMMENT if you find it useful and Click "Follow" on our profile if you'd like these trade ideas delivered straight to your email in the future.
Thanks for your continued support!

clear 130.000 price areas for flight 'ninja' landingprice is in a bearish parallel channel and is failling to trade above 140.000 price areas.
i have short targets to daily demand of proximal price @ 137.300
put together by : @currencynerd , pako phutietsile
supply and demand!
