Gold Poised to Rise on Looming Russia Sanctions!!Hey Traders, above is a breakdown of the current technical and fundamental setup for Gold, with a focus on key support zones and the macro landscape that could drive further upside.
From a technical standpoint, the first major support area to watch is around 3,334, which previously acted as a strong resistance level. Now that price has broken above it, we could see this zone retested as a support — a classic breakout-retest scenario that may offer a potential bounce opportunity.
The second key zone is located near 3,311, a historically significant support/resistance level. What makes this level even more critical is its confluence with the primary ascending trendline, reinforcing its importance as a structural support in case of a deeper retracement.
On the fundamental side, gold continues to benefit from its role as a safe-haven asset, especially amid rising geopolitical and economic tensions. There are two major catalysts in play right now:
Escalating trade tensions, particularly around new tariffs. Markets are pricing in a high baseline tariff risk of 15%, which adds a layer of uncertainty and supports defensive assets like gold.
Mounting geopolitical pressure on Russia, with the U.S. expected to announce secondary sanctions this week. These could further disrupt global markets and drive demand for hard assets.
In summary, gold is positioned well both technically and fundamentally. If price holds above the mentioned support zones, we could see renewed bullish momentum in the sessions ahead. Keep an eye on developments related to trade policy and sanctions, they could be key drivers of the next move.
Support

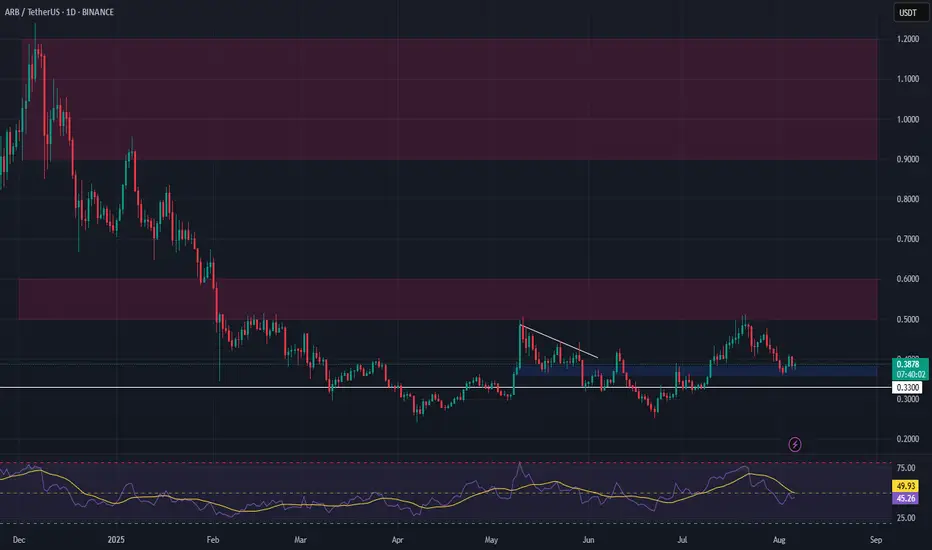
ARB Setup – Watching Key Support for Long EntryArbitrum (ARB) has pulled back into a critical support zone after recent declines. This level is showing strong buyer interest, and we’re eyeing a potential spot long entry as price consolidates near the lows.
📌 Trade Setup:
• Entry Zone: $0.386 – $0.38
• Take Profit Targets:
o 🥇 $0.50 – $0.60
o 🥈 $0.95 – $1.20
• Stop Loss: Just below $0.33
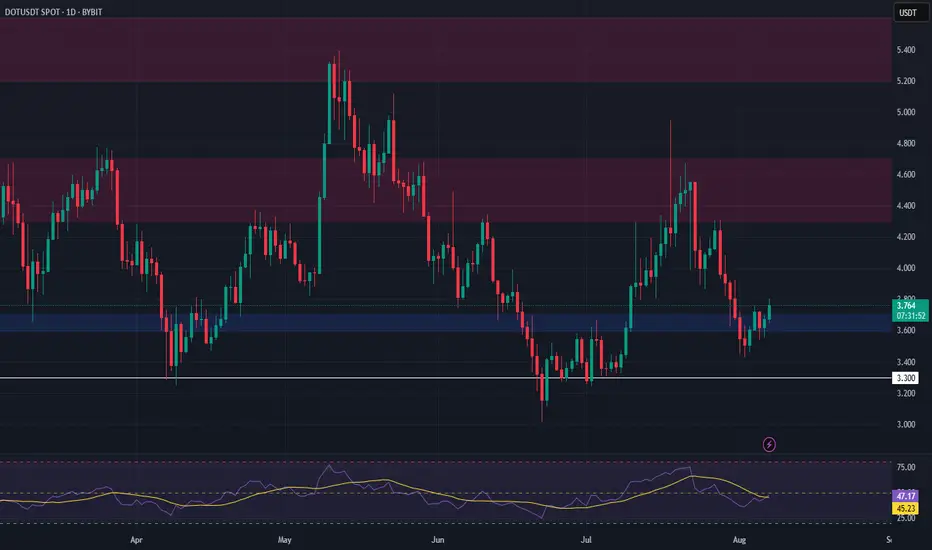
DOT | Bounce Setup from Major Support ZonePolkadot (DOT) has dropped sharply in recent weeks and is now testing a significant support zone between $3.60 – $3.70. This level has historically provided strong demand, making it a potential launch point for a bounce toward higher resistance levels.
Trade Setup:
🔹 Entry Zone: $3.60 – $3.70
🔹 Take Profit Zones:
• TP1: $4.30 – $4.70
• TP2: $5.20 – $5.60
🔹 Stop Loss: Below $3.30
AUD eyes yield advantage over USD UBS strategists view the Australian dollar as a compelling long opportunity at current levels, supported by expectations that the Reserve Bank of Australia will ease policy more gradually than the U.S. Federal Reserve.
The bank forecasts 75 basis points of rate cuts from the RBA through Q1 2026, compared to 100 basis points from the Fed—helping to preserve a relative yield advantage for the Aussie.
On the daily chart, AUD/USD remains within a well-defined ascending channel that began in late 2024. The pair recently bounced off the lower boundary of the channel near 0.6450, with long lower wicks potentially indicating dip-buying interest.
Immediate resistance could sit at 0.6600, followed by a major zone near 0.6670. A break above these levels could confirm bullish continuation.

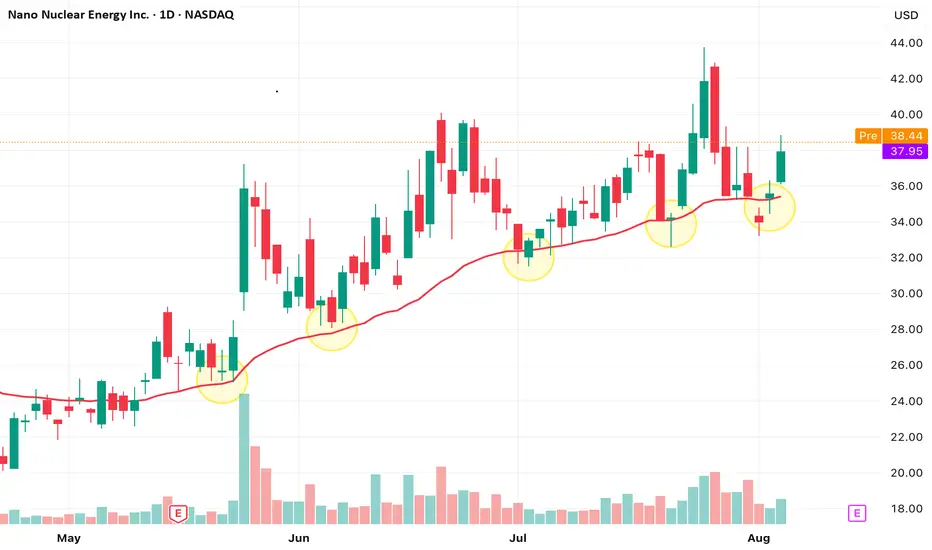
NASDAQ: NNE - Bouncing Off the Strong EMA 30?Nano Nuclear Energy - Price is retesting the EMA 30 after a sharp rally—will it hold as dynamic support and fuel the next leg up?
BTC Support Tested, Mixed Cross-TF Signals, Tactical Caution__________________________________________________________________________________
Technical Overview – Summary Points
__________________________________________________________________________________
Momentum & context: Bullish bias confirmed on higher timeframes (1D/4H), but bearish divergences appearing from 2H downward.
Major support/resistance: 114,600–115,000 and 114,667 hold as the critical zone. Key resistance: 116,900–117,000 must break for a bullish trigger.
Volume: Normal on HTF. Very high volumes detected on 30min/15min during the 116,000+ resistance test (climax/reversal risk).
Multi-timeframe behavior: Risk On / Risk Off Indicator = “Strong Buy” from 1D to 1H, short-term sellers active below 2H (ISPD = Sell on 15min).
__________________________________________________________________________________
Strategic Summary
__________________________________________________________________________________
Overall bias: Bullish structure preserved, but fragility evident on intraday.
Opportunities: Tactical buys possible on 114,600–115,000 (stop <114,000) or strong breakout above 116,900.
Risk: Clear break below 114,000 = risk of drop to 110,000. Volume climax/ISPD Sell below resistance = profit taking advised.
Macro catalysts: Ongoing geopolitical news (US/Russia/China), volatility during US announcements; post-Fed digestion.
Action plan: Strict monitoring of ETF flows/funding/US news. Cautious accumulation on daily/4H, short-term shorts only if confirmed by lower timeframe signals.
__________________________________________________________________________________
Multi-Timeframe Analysis
__________________________________________________________________________________
1D: Strong upward bias, price at major support, calm volume.
12H/6H/4H: Robust sectorial momentum (Risk On / Risk Off Indicator “Strong Buy”), daily/4H supports holding, initial bearish signs on 2H/1H.
2H/1H: Growing fragility: “Down” trend confirmed on 2H, momentum loss, buyer exhaustion visible.
30min/15min: Very high volumes under resistance, ISPD Sell 15min: short-term correction alert. Overbought microstructure, trigger risk if rejection at 116,000–116,250.
Cross-TF summary: Market mostly “Up”, but tactical vigilance around supports, increased caution above 116,000.
Summary:
- Bullish structure maintained on daily/4H, but top/reversal warning signals on brief lowest TFs (15/30min).
- 114,600–115,000 pivot zone is decisive: holding = increased stabilization/accumulation probability; break = risk of extension down to 110,000.
- Active monitoring of ETF flows/funding/news is essential.
__________________________________________________________________________________
Macro & Bitcoin Analysis (Twitter Summary)
__________________________________________________________________________________
Geopolitical risks remain high, US/China protectionism & Fed on hold: crypto market in wait-and-see mode.
BTC broke 116k, entered low-liquidity zone; rebound remains “fragile.”
ETF flows: moderate return to buying, funding neutral.
Possible post-pullback accumulation signal, but needs confirmation.
Strategy: swing buy on defended/major supports, strict management if short-term seller signals (volume/ISPD).
__________________________________________________________________________________
Action Steps
__________________________________________________________________________________
Buy on 114,600–115,000 zone if confirmed by daily/4H, stop loss <114,000.
Re-buy or more aggressive swing on clear breakout above 116,900–117,000.
Take profits/short if clear rejection 116,000+ with volume climax/ISPD Sell.
Monitor macro (US events), ETF flows, funding rate, volume behavior.
Chainlink (LINK/USDT) from 1D interval📈 Trend and Market Structure
Current trend: Upward (higher lows and highs)
The price is moving within an ascending price channel, marked by two black trend lines.
The recent rebound occurred from support around 14.83 USDT, which coincides with the lower boundary of the channel.
🔍 Key Levels
✅ Resistance (green horizontal lines)
18.98 USDT – local high
21.16 USDT – main resistance, possible target after breaking $19
18.27 USDT – current local resistance zone, currently being tested
17.62 USDT – mid-range resistance
🛑 Support (red horizontal lines)
15.97 USDT – first local support
14.83 USDT – important support (price reaction, trend confirmation)
13.30–13.50 USDT – key demand zone
12.50 USDT – lower historical support
📊 Indicators
🔄 Stochastic RSI
%K and %D lines cross from below → buy signal
Currently emerging from oversold levels (< 20), which could indicate a continuation Growth
📉 MACD
The histogram is decreasing, but the rate of decline is slowing.
Possible buy signal if the MACD line crosses the signal line from below.
🔊 Volume
Increasing volume during gains, lower volume during corrections – confirms bullish strength.
The recent decrease in volume may indicate consolidation or preparation for the next move.
📌 Scenarios
🟢 Bullish Scenario:
Uptrend maintained within the channel.
Breakout above 18.27 and 18.98 → possible rally to 21.16.
Confirmation by MACD/Stoch RSI.
🔴 Bearish Scenario:
Break of support at 15.97 and the trend line → possible decline to 14.83 or lower (13.30).
MACD may continue to decline if a strong rebound is not achieved.
🧠 Summary
Trend: Bullish
Price is currently testing resistance at 18.27.
Key support levels to watch: 15.97 and 14.83.
Indicators are providing potential buy signals, but confirmation will be needed on higher time frames or on stronger volume.

BNBUSDT 4H Review🔍 Technical Structure
📉 Descending Channel (orange lines)
The price was moving in a clear downtrend within the channel.
A breakout from the channel to the top occurred, which is a potentially bullish signal.
The price is currently testing a level above the channel—a classic retarget (retest) of the breakout.
🟩 Support/Resistance Levels (green and red lines)
✅ Support:
760.97 USDT – currently tested as support after the breakout from the channel.
739.81 USDT – local support, previous resistance.
717.89 USDT – stronger support, lower boundary of the channel.
❌ Resistance:
779.87 USDT – short-term resistance.
809.72 USDT – key resistance on the higher timeframes.
📊 Volume
Volume increased during the breakout from the channel, supporting its credibility.
It is currently declining slightly, which may suggest consolidation or waiting for another impulse.
🔄 Stoch RSI Oscillator (at the bottom of the chart)
Currently leaving the overbought zone (>80) and heading down.
Potential bearish or consolidation signal for the coming sessions.
🧠 Scenarios
1. Bullish Scenario (continuation of the breakout):
If the 760.97 level holds as support,
A move to 779.87 is possible, followed by a test of 809.72.
2. Bearish Scenario (false breakout):
If the price falls below 760.97 and fails to stay above 739.81,
A retest of 717.89 or even a return to the descending channel is possible.
📌 Conclusions
Currently, the key level is 760.97 USDT – maintaining it will confirm the bulls' strength.
Oscillators suggest a possible correction or consolidation.
For a long position: a good place to test 760.97 with a narrow SL below 739.81.
For a short position: a potential signal if 760.97 is not maintained.

BTCUSD Technical Analysis – Smart Money Concept Based
🔍 BTCUSD Technical Analysis – Smart Money Concept Based
🕒 Timeframe: Intraday (likely 1H or 4H)
📅 Date: August 5, 2025
📉 Price: ~114,445 USD
📌 Key Zones and Observations
🔴 Previous Resistance (117,000–119,000)
This area has a strong high formed after multiple equal highs (EQH), indicating a liquidity pool above.
Price sharply rejected this zone, validating it as a significant supply zone.
🔵 Support Zone & Liquidity Pool (~112,600–113,200)
This is a high-volume node (visible on VRVP) where price consolidated previously.
Market structure suggests liquidity resting below, as indicated by the marked “Target” area at 112,648.
Smart Money may aim to sweep liquidity below this support zone before any meaningful reversal.
🟤 Order Block & Rejection at 115,210–116,065
Price tapped into a bearish order block, creating a minor change of character (ChoCH) and then started to decline.
Rejection from this zone signals distribution by institutions or Smart Money, leading toward bearish continuation.
🟢 Value Gap and Imbalance (Above 115,000)
A visible value gap still remains unfilled; however, current momentum is bearish, and price failed to reclaim it, hinting downside continuation.
🔄 Market Structure
BOS (Break of Structure) to the upside confirmed short-term bullish momentum.
CHoCH back to the downside near current price reflects bearish shift in order flow.
Price is respecting lower highs, and failing to break above 115,210 confirms a bearish bias.
🎯 Target and Outlook
Primary Bearish Target: 112,648 USD
This is a liquidity pool and previous support area where institutions may look to rebalance and accumulate.
Scenario:
If price retests 115,000–115,210 again and fails, expect strong continuation downward toward the 112,648 target.
If price breaks and holds above 116,065, bullish invalidation may occur, and we can look for higher retracement toward 117,000–119,000.
✅ Conclusion
BTCUSD is currently respecting a bearish order block, with Smart Money likely targeting liquidity resting below at 112,648 USD. Unless price breaks above 116,065 with strong volume, the bias remains bearish short-term.

COIN: Retesting Broken Resistance - Decision Point IncomingCOIN (Coinbase) has pulled back sharply after its breakout run to ~420 and is now retesting the prior resistance zone near 310–315, which previously acted as a lid during Q1.
This area now becomes a classic support-turned-resistance flip and serves as a major decision point for price:
Technical Levels & Setup:
310 horizontal zone = former resistance from February/March → now being retested
Buyers stepping in here would confirm a bullish retest, keeping the breakout structure intact
Failure to hold opens the door for a deeper flush toward 220-250
Price currently sitting on the zone with indecision - watch for confirmation candle (hammer / bullish engulfing)
Measured breakout continuation still targets 450+ if support holds
Is COIN simply back-testing the breakout before another leg higher - or is this the start of a larger reversal?

XAUUSD – Mid-Channel Rejection Near Key Supply ZoneGold has made an impressive recovery off the $3,250 zone, pushing back into the $3,380–$3,390 region — a key supply area which previously led to strong sell-offs.
We’re now sitting at the upper boundary of a 1H ascending channel and just under a significant resistance area seen on the 4H and daily timeframes.
Although bullish momentum is still present, price is showing early signs of exhaustion at this level — with small rejections forming and volume beginning to taper off.
The key zone to watch is $3,384 – $3,390. If price fails to break and close above this zone cleanly on the 4H, we may see a corrective pullback back toward the midline of the channel — or even a full retest of the lower boundary near $3,305 or $3,268 depending on momentum.
Bias: Short-term bearish / corrective – waiting for confirmation of rejection or bearish candle formation below $3,384.

ETHUSDT 4H Chart Review🔍 General Technical Context:
Prior Trend: Upward (strong rally from around 3,150 USDT).
Current Structure: After breaking out of the ascending channel, there was a strong decline, but is currently rebounding upward – it looks like a test of prior support as resistance.
📈 Key Horizontal Levels (Support/Resistance):
Resistance:
3,794 USDT – strong resistance resulting from the prior high (green line).
3,943 USDT – high of the ascending channel.
Support:
3,504 USDT – prior support, now potentially acting as resistance (red line).
3,383 USDT – July support.
3,132 USDT – strong base support, potential correction low.
📉 Technical Patterns:
Broken Upward Channel (orange lines): A clear downward breakout suggests a weakening of the previous trend.
Downward Trendline (purple): The current price is approaching it – a test and reaction (bounce or breakout) may occur.
📊 Stochastic RSI (oscillator at the bottom):
The indicator is entering the overbought zone (>80).
This may indicate an impending slowdown or correction, especially if the price encounters resistance at the purple downward trendline.
🔮 Scenarios:
✅ Bullish (if the breakout is upward):
A breakout of the purple trendline and resistance at 3,794 USDT could signal further gains towards 3,943 USDT or higher.
Confirmation could come from a retest of the purple line as support.
❌ Bearish (if resistance rejected):
Rejection from the trendline or the 3,794 USDT zone = possible correction to 3,504 or 3,383 USDT.
Break of 3,383 = potential decline to the 3,132–3,150 USDT zone.
🧭 Conclusion:
The market has regained strength from the local low but is at a potentially strong resistance zone.
Stochastic RSI overbought + near resistance = high risk of a near-term correction.
The key will be price performance within the purple trendline and 3,794 USDT.

Swing opportunity on cluster support, technical & macro plan__________________________________________________________________________________
Technical Overview – Summary Points
__________________________________________________________________________________
Momentum : Tech sector bias supportive on higher timeframes (Risk On / Risk Off Indicator “Buy” on 1D/12H) despite MTFTI “Down” on intraday (15min to 6H).
Key Supports : Major cluster at 111,900–112,772 (W Pivot High, 12H/24H Pivot Low). Critical defense short/mid term.
Resistances : 114,723, then 115,900, then 119,800–122,318 (break to relaunch impulse).
Volumes : Moderate to normal across all timeframes: no panic or capitulation.
Multi-TF Behaviour : ISPD DIV neutral everywhere: neither fear nor euphoria; wait-and-see market. No climax nor emotional extremes: conducive to squeeze or extension after catalyst.
__________________________________________________________________________________
Strategic Summary
__________________________________________________________________________________
Global Bias : Neutral to cautious bullish if 111,900–112,772 holds (invalidate if <111,900).
Opportunities : Defensive swing long entries on support. Gradual targets: 114,723, 115,900, 119,800–122,318.
Risks : Daily/4H close below 111,900 = acceleration towards $110k/$105k (on-chain air-gap).
Macro Catalysts : Geopolitical tensions (Gaza/Ukraine/China), China crypto ban headlines, sector decoupling, Fed/BoE policy.
Action Plan : Strict stop management (<111,750), agile on volume/ISPD signals. Critical macro monitoring: any exogenous move can trigger directional volatility.
__________________________________________________________________________________
Multi-Timeframe Analysis
__________________________________________________________________________________
1D (Daily) : Key support 114,723.2. Tech sector indicator (Risk On / Risk Off Indicator) bullish. MTFTI Up. Normal volume, no panic. Lack of ISPD oversold signal.
12H : Support W Pivot High 111,900 – 12H Pivot Low 111,920. Uptrend, moderately higher volumes, ISPD neutral. Battling for support maintenance and bounce.
6H : Core pivot support 111,900–112,000. MTFTI Down. No volume excess or sentiment signal. End of momentum, increase vigilance.
4H : Weakness confirmed, supports 112,000–112,500, resistance 117,722 to 119,800. Last short-term rampart tested.
2H-1H : Bearish, attacks on 111,900–112,772 supports, immediate resistance at 114,723/115,900. Weak range market.
30min-15min : Neutral, lower range between supports (111,900–112,772) and resistances (113,950–114,723). Volatility on breakout events, no sector bias.
Risk On / Risk Off Indicator : Persistent “Buy” on higher timeframes (12H/1D), neutral/bearish intraday (4H and below).
ISPD DIV : No extremes detected: no exhaustion, panic or major oversold; “range” environment.
Volumes : Normal, no climax or anomaly. Market awaiting a catalyst.
__________________________________________________________________________________
Fundamental, Macro Events, Sentiment Overview
__________________________________________________________________________________
Macro : Newsflow on China crypto ban, multiple tensions (Gaza, Russia-Ukraine), Fed/BoE slowing. Globally cautious setting despite no direct institutional shock.
On-chain (Glassnode) : Major OTC sale (~80k BTC) absorbed, 97% supply in profit: “moderate euphoria” phase, not capitulation; on-chain supports $110–117k, resistance $125–141k, air-gap below $115k.
Twitter : No panic, “final wick” narrative then anticipated technical rebound. No institutional outflows. China ban read as cyclical FUD.
__________________________________________________________________________________
Summary & Action Plan
__________________________________________________________________________________
Support 111,900–112,772 = key multi-TF cluster; area for defensive swing opportunity.
MTFTI is “Down” on lower TF, but Risk On / Risk Off Indicator bullish on daily/12H.
No capitulation, normal volume, market waiting for catalyst.
Swing bullish invalidated below 111,900—stop required, R/R 1:2 minimum.
Fast reclaim above 114,723 plus strong upside volume: short squeeze & potential extension to 119,800–122,318.
Macro monitoring essential (China ban, monetary policy, geopolitics).
__________________________________________________________________________________
Operational Summary : Favor defensive swing long plans on multi-TF cluster support (111,900–112,772), strict stop <111,750, progressive TPs to 114,723/115,900/119,800. Stay opportunistic: bias cautiously bullish but risk management is paramount in a cautious global environment and with no strong extremes detected.
__________________________________________________________________________________

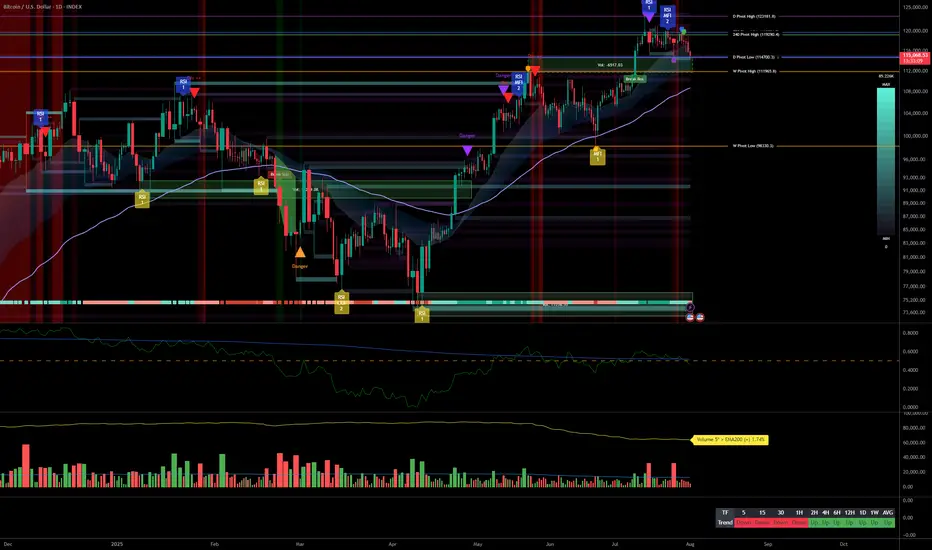
BTC/USD 1D Chart 🔼 Resistance:
• USD 123,263 - local peak, strong resistance (green line)
• USD 119,120 - level tested several times, recent reflection
• 116,224 USD - zone of previous consolidations
🔽 support:
• 110,945 USD - SMA #2 (movable average), tested in the past
• 107,804 USD - local hole
• USD 103,542 - strong support from the past (historical retention of declines)
⸻
📊 Technical indicators
📉 Trend:
• The yellow upward trend line has been broken - a potential bull weakness signal.
• The candle pierces the trend line from the bottom - it is possible to change the direction to a side or downward trend.
📈 Medium walking (SMA):
• The red SMA #1 line acted as dynamic resistance.
• The price is currently testing SMA #2 as support.
• SMA #5 (blue, approx. 98,600 USD) is very strong long -term support.
📉 Macd:
• The MacD line is below the signal line → Bear signal (Bearish).
• Red histogram - inheritance impetus is growing.
📉 RSI:
• RSI has fallen below the level of 50 → the advantage of supply.
• Currently, it is approaching the supply of supply overload (<30), which can herald the technical reflection.
⸻
🔮 Scenarios
✅ Scenario Bycza (Bullish):
• Maintenance of a price above 110.945 USD (SMA #2).
• Return above the trend line or testing USD 116,224 and piercing up.
❌ Bear scenario (Bearish):
• Loss of support to 110.945 USD → decrease to USD 107,800.
• If this does not keep the course, the next strong level is USD 103,500.
⸻
🧠 Applications:
• Short -term: the market looks weak, the candle breaks the upward trend.
• Medium -term: still in the game, but if it does not reflect from the current levels, a greater correction is possible.
• Commercial decisions: It is worth waiting for confirmation of the direction (reflection from support or continuation of declines).

XAUUSD 4H AnalysisXauusd breaks the downward trendline and changes its direction toward important resistence levels 3369-3374. This zone is very important based on ichimoku, so we expect good reaction. after the reaction, the chart will be updated.
important support level is 3317.

POSSIBLE BEARISH CONTINUATION ON GOLDBased on price action, Gold presents a very bearish sentiment from the daily point of view.
The indicated supply region may be the area of interest for the build up of the sells if indeed Gold is bound for the monthly lows.
Confirmation is needed for an entry.

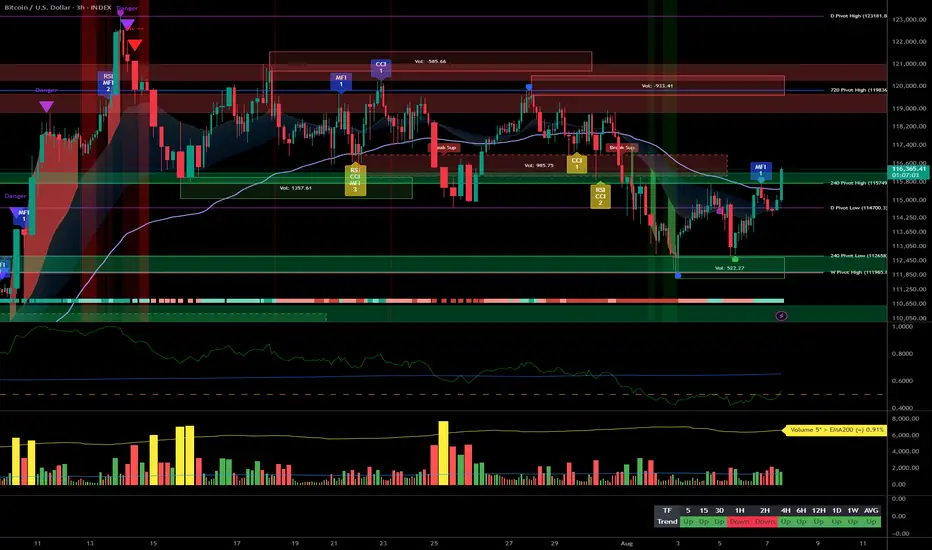
Bitcoin Facing Macro Volatility: Key Supports Hold Firm__________________________________________________________________________________
Technical Overview – Summary Points
__________________________________________________________________________________
Momentum: Dominant bullish bias on higher timeframes (1D to 2H).
Key Supports/Resistances: Key pivot zone at 114.7K–115.8K defended across all timeframes; major resistances at 119.7K, upside extension to 122.3K.
Volume: Peaks on breakout, normal to high volumes depending on TF, no signs of seller capitulation.
Behavioral Indicators: Risk On / Risk Off Indicator remains strong on all strategic TFs; ISPD DIV neutral except for a defensive buy signal on 1H.
Multi-timeframe summary: Broad horizontal consolidation, no panic or euphoria detected. Major supports overlap, confirming structural strength amid macro volatility.
__________________________________________________________________________________
Strategic Summary
__________________________________________________________________________________
Overall bias: Bullish above 114.7K; neutral/slightly bearish below this key level.
Opportunities: Longs via scalping/range trading on reactions at 114.7–115.8K; swing accumulation on daily/4H stabilization above 115K.
Risk: Break below <114.7K, macro volatility around NFP/PMI, false breakouts.
Macro catalysts: Expanded US tariffs (Trump), NFP, PMI, Fed status.
Action plan: Reactivity on pivots, reduce exposure during macro events, hard stops <114.5K H4.
__________________________________________________________________________________
Multi-Timeframe Analysis
__________________________________________________________________________________
1D: Working the 114723 pivot support. Bullish momentum, no excessive selling, Risk On / Risk Off Indicator “STRONG BUY”.
12H-6H: Building a bottom on the daily base; sustained volumes during sell-off, no panic, technical buy signals emerging.
4H-1H: Vigorous support defense, 1H ISPD DIV “buy” signal. Healthy range pattern; volumes up during rebound attempts.
30min-15min: Slow recovery after high-volume drop, no euphoria or capitulation. No “trap” or imminent squeeze, favorable for tactical trades.
Risk On / Risk Off Indicator: Higher TFs (1W/1D/12H/4H) show strong bullish signals, boosting risk confidence. Decorrelation with lower TFs allows flexible management, controlled accumulation, tight stops at 114.7K.
__________________________________________________________________________________
Macro & BTC Context Summary (Twitter)
__________________________________________________________________________________
Macro: US tariff shock, max volatility likely, amplified moves in equities and crypto.
Bitcoin: Sharp correction post-record close, but solid supports remain, no sign of trend end.
Integration: Technical status quo; favor defensive accumulation, caution on NFP/PMI.
__________________________________________________________________________________
Actionable Synthesis: Plan & Risk Management
__________________________________________________________________________________
Strategies: Longs/scalp >114.7K; swing/accumulate post daily/4H confirmation; partial TPs near 119.7K/122.3K.
Risk Zones: Hard stop <114.5K. Tight monitoring around NFP for volatility spikes.
Reward: Risk-to-reward >2 if buying lower range with strict stops.
__________________________________________________________________________________
Key Macro Events to Watch
__________________________________________________________________________________
2025-08-01: US NFP, unemployment, hourly wages – High volatility expected, possible swings
2025-08-01: ISM Manufacturing PMI – Short-term trend confirmation or invalidation
2025-07-30: FED conference – Range-bound / Moderate volatility
US Tariffs (Trump) – Global risk-off, caution BTC & tech
__________________________________________________________________________________
Conclusion
__________________________________________________________________________________
BTC consolidates steadily between 114.7K–122.3K despite macro shocks
Daily/H4 supports robust, Risk On / Risk Off Indicator strong on higher TFs
Accumulation/scalping favored as long as supports defended
Main risk = break of 114.7K, imminent macro volatility
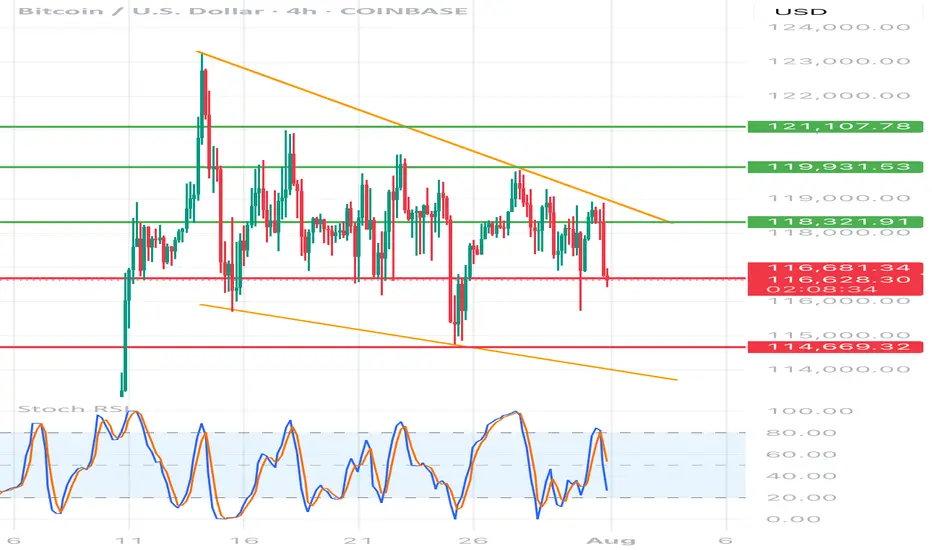
BTC/USD 4h chart🔸 Formation: Triangle descending (descending)
• Upper trend line (orange) - inheritance, connects lower and lower peaks.
• Lower support line (red) - approx. 116,700 USD - key support, tested many times.
🔻 Support
USD 116,700
Tested several times, currently threatened
🔻 Another support
USD 114,669
Target level when struck with a triangle
🔼 Resistance
USD 118,321
The nearest resistance - the former level of support
🔼 Resistance
USD 119,931
Local peak
🔼 Strong resistance
USD 121,107
Upper level of structure
📉 STOCHASTIC RSI (lower indicator)
• Line cutting and a decrease in the purchase area (> 80) towards the center.
• No extreme sales signal, but the trend begins to be negative.
⸻
📌 Applications and possible scenarios:
🔻 Bearish script (more technically likely):
• If BTC breaks below USD 116,700 with a 4H candle closure, possible:
• a decrease around USD 114,669 (lower limit of the triangle)
• Even lower - around 113,500-112,000 USD with an increased volume
🔼 Bullly script (less likely but possible):
• needed quick breaking above USD 118,300 and maintaining above this level
• Then the goal will be USD 119,931, and then possible traffic up to USD 121.107
⸻
📍 Summary:
• We see classic triangle descending-pro-draft formation.
• Support 116,700 USD very close to breaking - if it falls, down movement can be dynamic.
• Stochastic RSI coincides with the deterioration of the moment.
• The inheritance scenario seems dominant, unless there is a strong demand and over 118,300 USD.
ADA Setup – Eyeing Entry After 70%+ RallyCardano (ADA) has surged over 70% in recent weeks. A healthy pullback is underway, and we’re watching the key support zone for a potential long entry targeting the next leg higher.
📌 Trade Setup:
• Entry Zone: $0.65 – $0.67
• Take Profit Targets:
o 🥇 $0.98 – $1.15
o 🥈 $1.50 – $1.60
• Stop Loss: Just below $0.62

BONK Setup – Watching for Retracement After 200%+ RallyBONK has surged over 200% in recent weeks. We're now eyeing a retracement to a key support zone that could offer a prime entry for the next leg higher.
📌 Trade Setup:
• Entry Zone: $0.00002240 – $0.00002500
• Take Profit Targets:
o 🥇 $0.00004050 – $0.00004800
o 🥈 $0.00005500 – $0.00006500
• Stop Loss: Just below $0.00002000

EURUSD FORMED BEARISH PENNANT. THE PRICE IS READY TO DROP.EURUSD FORMED BEARISH PENNANT. THE PRICE IS READY TO DROP.
EURUSD has been trading sideways within the last day, showing lower highs and higher lows. Eventually, the price has formed the pennant chart pattern.
What is a pennant?
A pennant chart pattern is a short-term continuation pattern in technical analysis, resembling a small symmetrical triangle, formed after a strong price movement (flagpole). It consists of converging trendlines, indicating a brief consolidation before the trend resumes. Bullish pennants form after an uptrend, bearish pennants after a downtrend.
The price is expected to decline towards 1.14500 support level

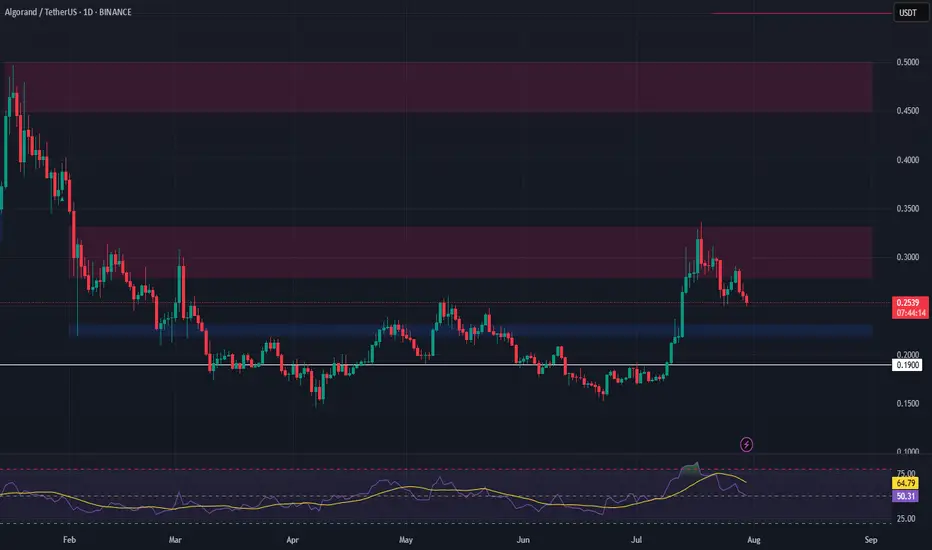
ALGO Swing Trade – Waiting for Pullback to Key SupportAfter a 100%+ surge, ALGO is now retracing and approaching a critical support zone. A dip into this area could offer a strong entry for the next leg higher.
📌 Trade Setup:
• Entry Zone: $0.22 – $0.23
• Take Profit Targets:
o 🥇 $0.28 – $0.33
o 🥈 $0.45 – $0.50
• Stop Loss: Just below $0.19
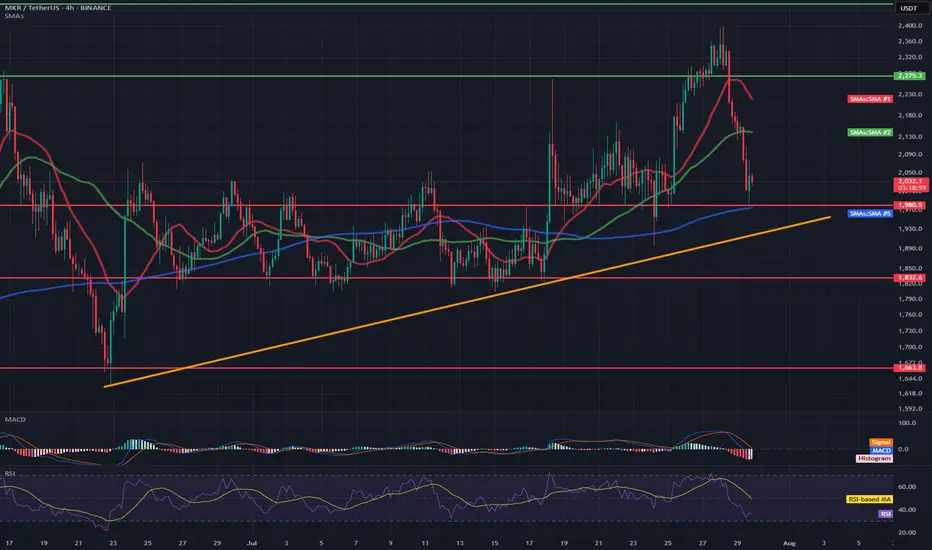
MKR/USDT 4H Chart📉 Short-term situation:
The price is currently trading around 2028 USDT, after a sharp decline from around 2273 USDT (resistance).
The support level around 2000 USDT is currently being tested (coinciding with the SMA 200 – blue line).
A dynamic uptrend line (orange) is also visible, which could act as a key support level in the event of further declines.
🔍 Support and Resistance Levels:
Resistance:
🔴 2188 USDT – recent local high and convergence with the SMA 21.
🟢 2273 USDT – major resistance; previous rebound and point of significant price reaction.
Support:
🔵 1980 USDT – local support + SMA200.
🟠 Uptrend line (~1940–1960 USDT).
🔴 1832 USDT – stronger horizontal support with multiple confirmations.
🔴 1623 USDT – very strong support, from previous lows.
📊 Technical indicators:
RSI (Relative Strength Index):
Current value: ~42, neutral, but approaching the oversold zone (<30).
The RSI is falling rapidly, suggesting selling pressure, but a reaction is possible near current support.
MACD:
Negative signal: signal line crossing from above + descending histogram.
Indicates a continuation of the correction, but we are approaching the potential exhaustion of the downward momentum.
📈 Moving averages:
EMA/SMA 50 and 200:
The price is currently testing the SMA200 – crucial for the medium-term trend.
SMA21 (red) and SMA50 (green) – have reversed downward, which may suggest a weakening of bullish momentum.
🔮 Scenarios:
🟢 Bullish scenario (confirmation of support):
A rebound from 1980–2000 USDT and further upward movement.
Potential target: first ~2180 USDT, then ~2273 USDT.
The condition is a demand response at the current level + an improvement in the RSI/MACD.
🔴 Bearish scenario (breakout of support):
If the 1980 USDT level is broken and the price falls below the uptrend line, a continued decline to 1832 USDT or even lower is possible.
Confirmation will be a strong bearish candle with high volume and a further decline in the RSI/MACD.